
Data View
SUB) Overview
Provides the analysis of the proportion of multiple instances or dates. It also provides a bi-directional connection analysis among the Instance, Schema, Program (or Module), and SQL. Among the Data Visualization techniques, the Flow visualization technique has been applied.
SUB) Window Configuration
The window configuration is as follows.
SUB) Search Condition
| Search Condition | Description |
| |
Selects the target instance for analysis. For selection convenience, the autocomplete function is available. You can choose 2 or more instances by clicking the items in the Combo Box.
|
|
|
Provides the UI from which you can easily select multiple instances.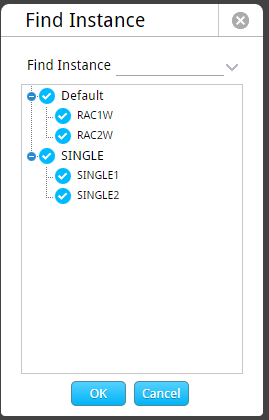
|
Sets the analysis period for the last 1 week.
|
|
| |
Sets the analysis date for yesterday. (Default Value) |
| |
Sets the analysis date for today. |
| |
You can either enter the analysis date, or select the date from the calendar UI.
|
| |
You can either enter the analysis date, or select the date from the calendar UI.
|
| |
Select the 1st axis item. The available option items are as follows.
|
| |
Select the 2nd axis item. The available option items are as follows.
|
| |
Select the 3rd axis item.
|
| |
Select SQL as the 4th axis item.
|
SUB) The UI When Analyzing a Particular Date for Multiple Instances
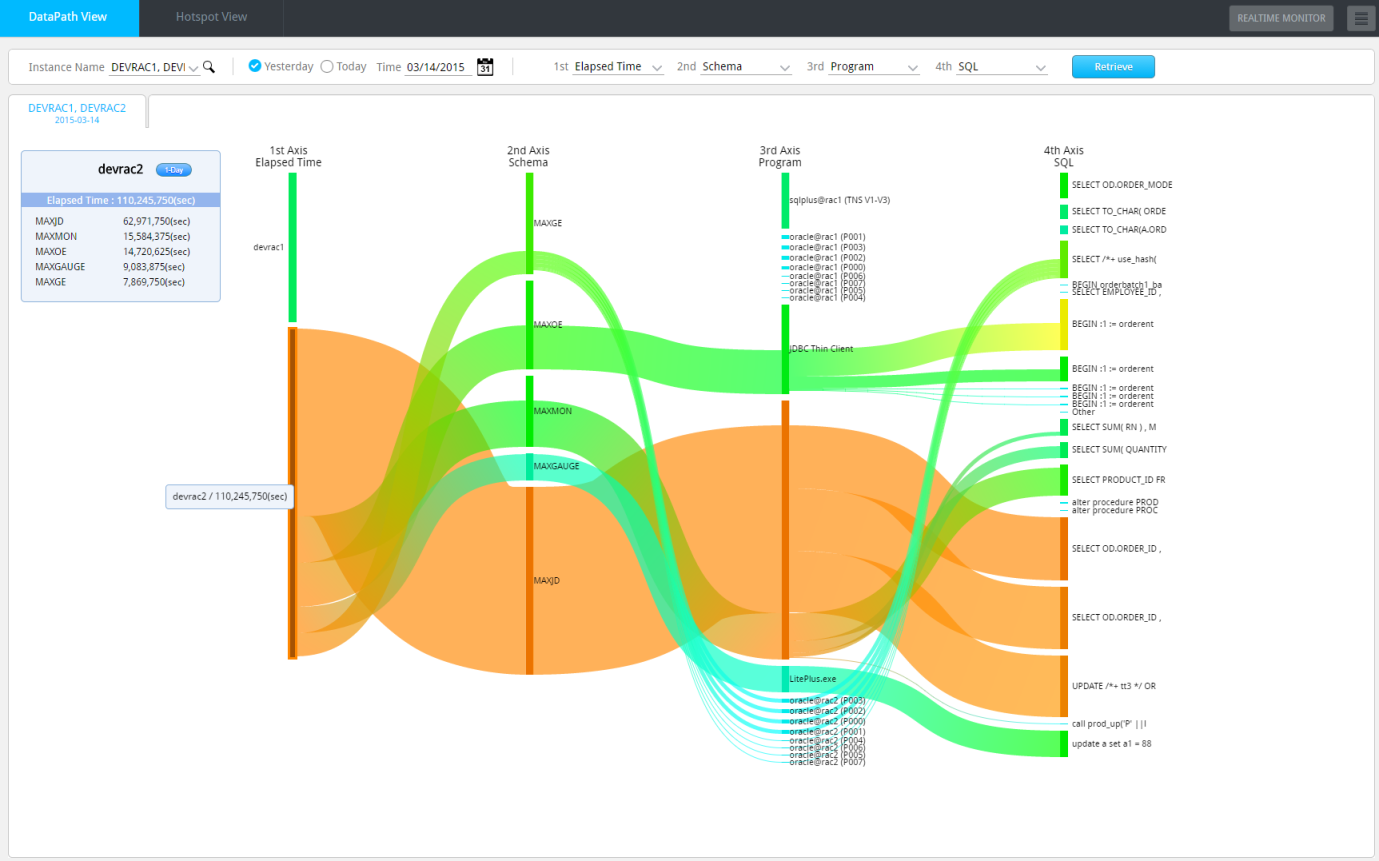
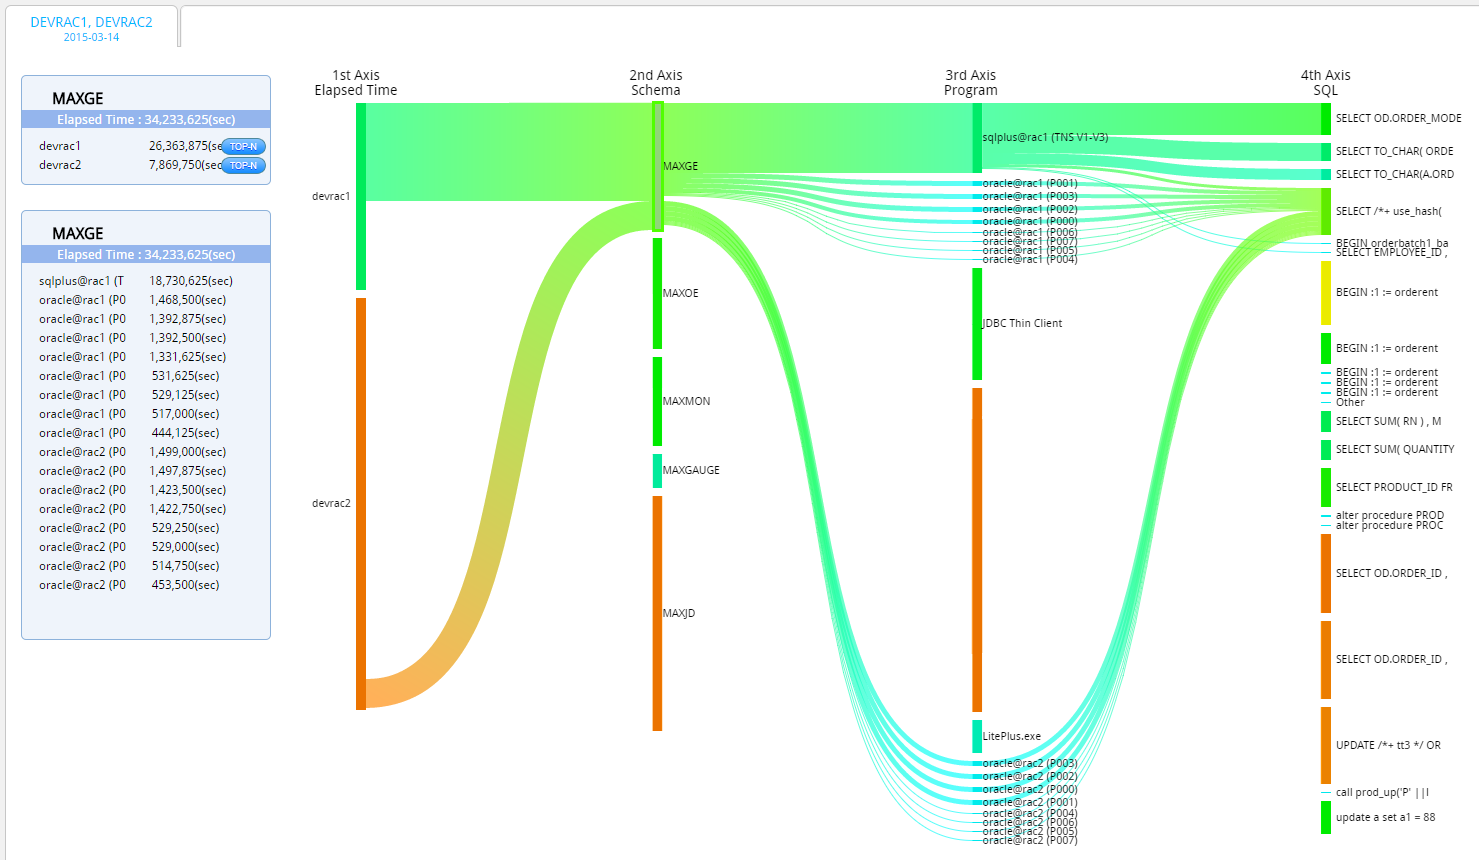
We will use the example when Elapsed Time is selected as the 1st axis and composed of 4 axes.
| Item | Description |
| 1st Axis | Indicates the Elapsed Time of each instance with the length of the bar. |
| 2nd Axis | Indicates the Elapsed Time of each Schema with the length of the bar. |
| 3rd Axis | Indicates the Elapsed Time of each Program with the length of the bar. |
| 4th Axis | Indicates the Elapsed Time of each SQL with the length of the bar. |
Initial Screen
Provides a top-down analysis of Instance -> Schema -> Program -> SQL, based the instance whose Elapsed Time value is the highest.
Note. The thickness of the connecting lines is proportional to the Elapsed Time value.
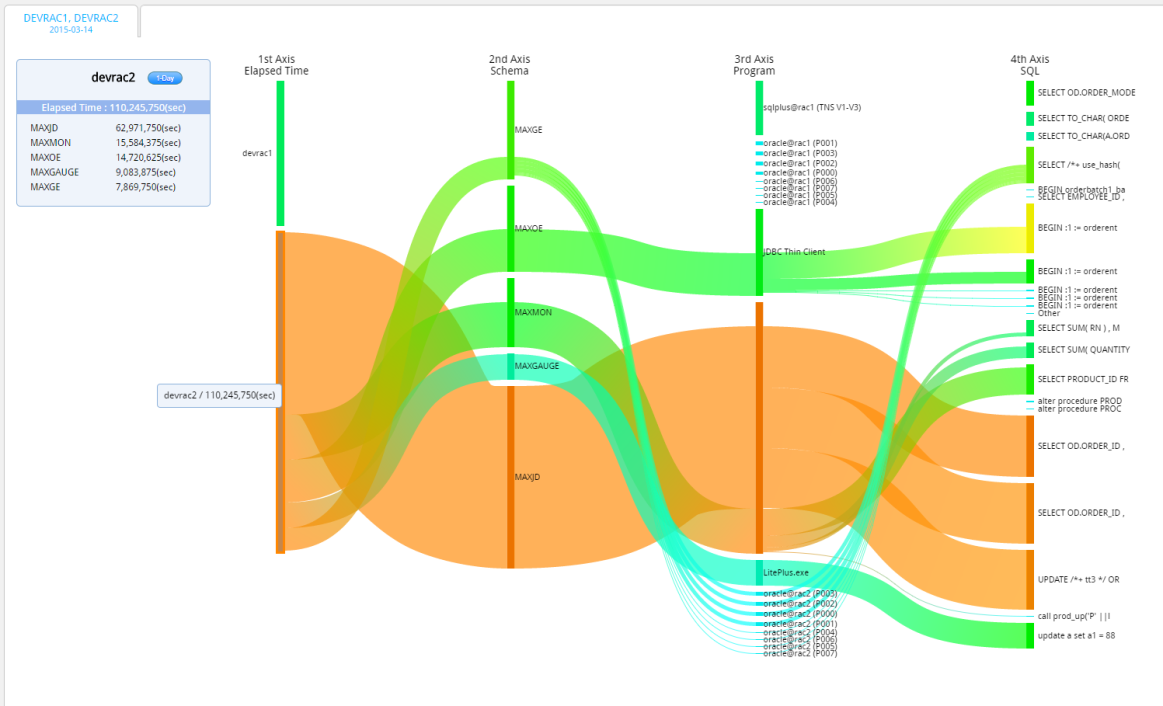
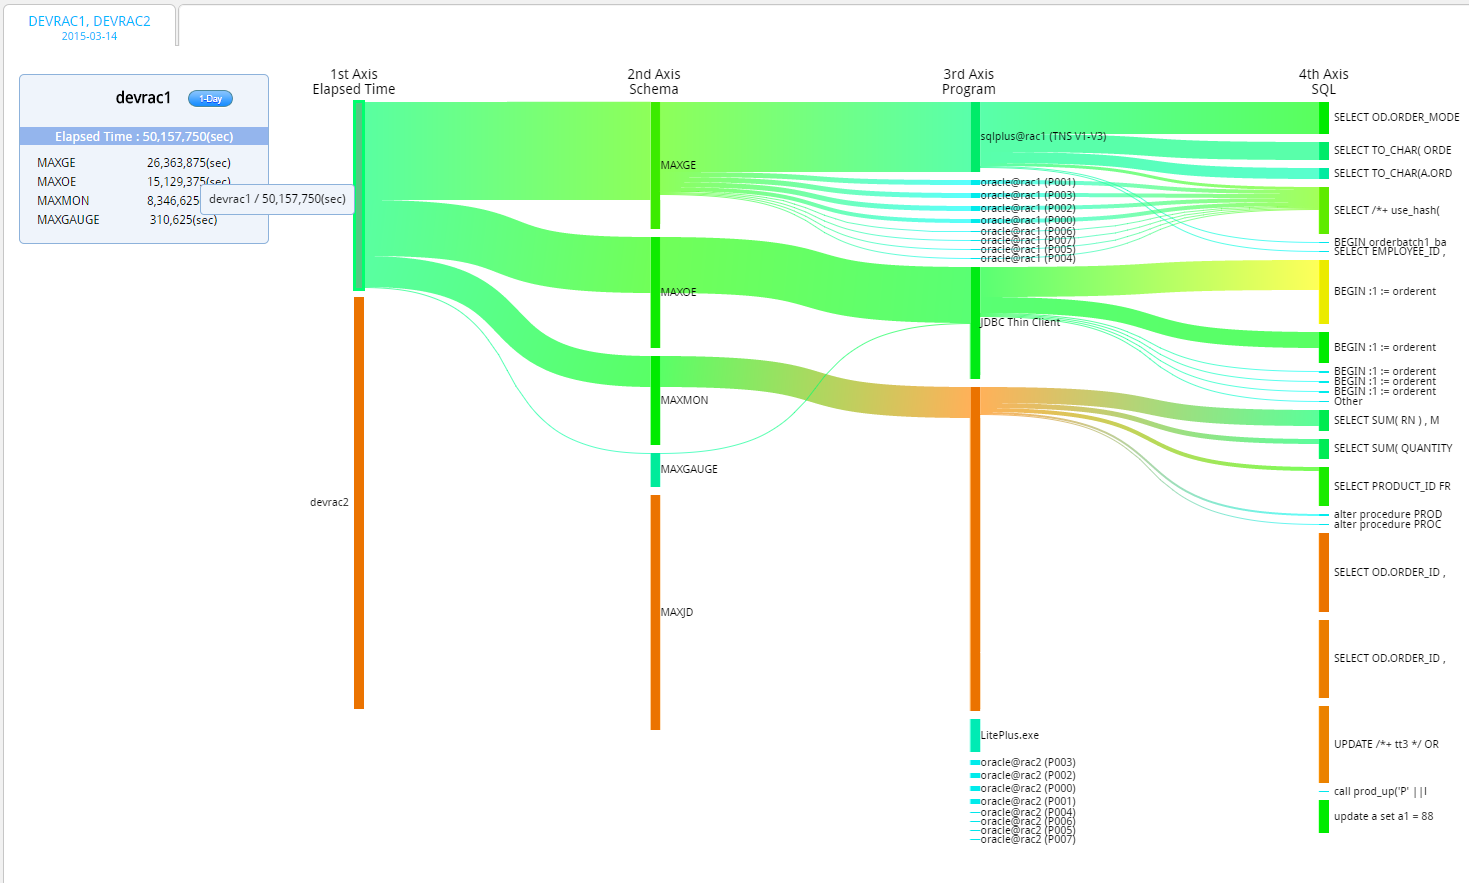
The Screen After Selecting a Particular Instance on the 1st Axis
Provides a top-down analysis of Instnace -> Schema -> Program -> SQL, based on the selected instance.
Window Connection
When you click on the 1-Day Summary button, it connects to the 1-Day Summary View of the corresponding instance.
Input Parameter at the Time of Window Connection
- Analysis Period: Date selected in Search Condition
- Instance Name: Name of the Selected Instance
The Screen After Selecting a Particular Schema on the 2nd Axis
Provides a bi-directional analysis of Instance <- Schema -> Program -> SQL, based on the selected schema.
Window Connection
When you click on the Top-N Analysis button, it connects to the Top-N Analysis of the corresponding Schema.
Input Parameter at the Time of Window Connection
- Analysis Period: Date Selected in Search Condition
- Instance Name: Instance whose execution proportion of the selected Schema is the highest
- Schema Name: Name of the Selected Schema
The Screen After Selecting a Particular Program on the 3rd Axis
Provides a bi-directional analysis of Instance <- Schema <- Program -> SQL, based on the selected program.
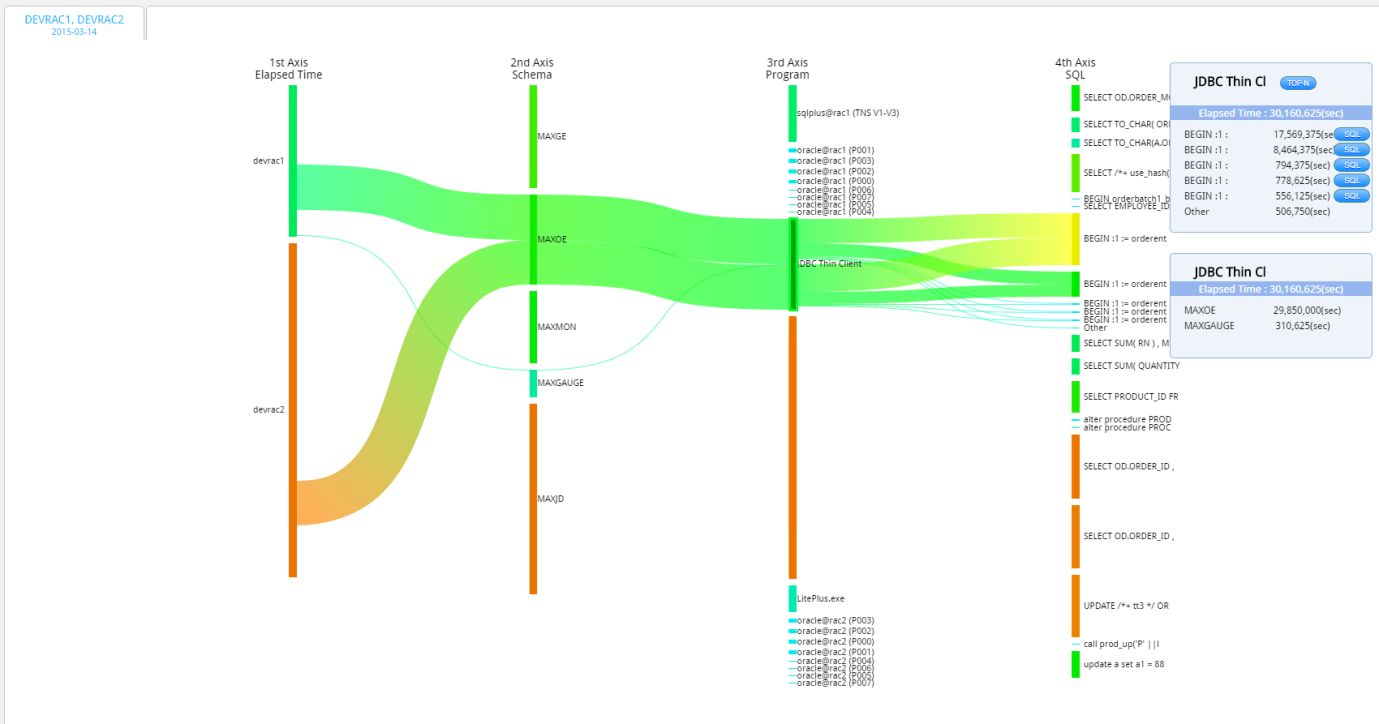
Window Connection
When you click on the Top-N Analysis button, it connects to the Top-N Analysis of the corresponding program.
Input Parameter at the Time of Window Connection
- Analysis Period: Date Selected in Search Condition
- Instance Name: Instance whose execution proportion of the selected program is the highest
- Program Name: Name of the Selected Program.
The Screen After Selecting a Particular SQL on the 4th Axis
Provides a bottom-up analysis of Instance <- Schema <- Program <- SQL, based on the selected SQL.
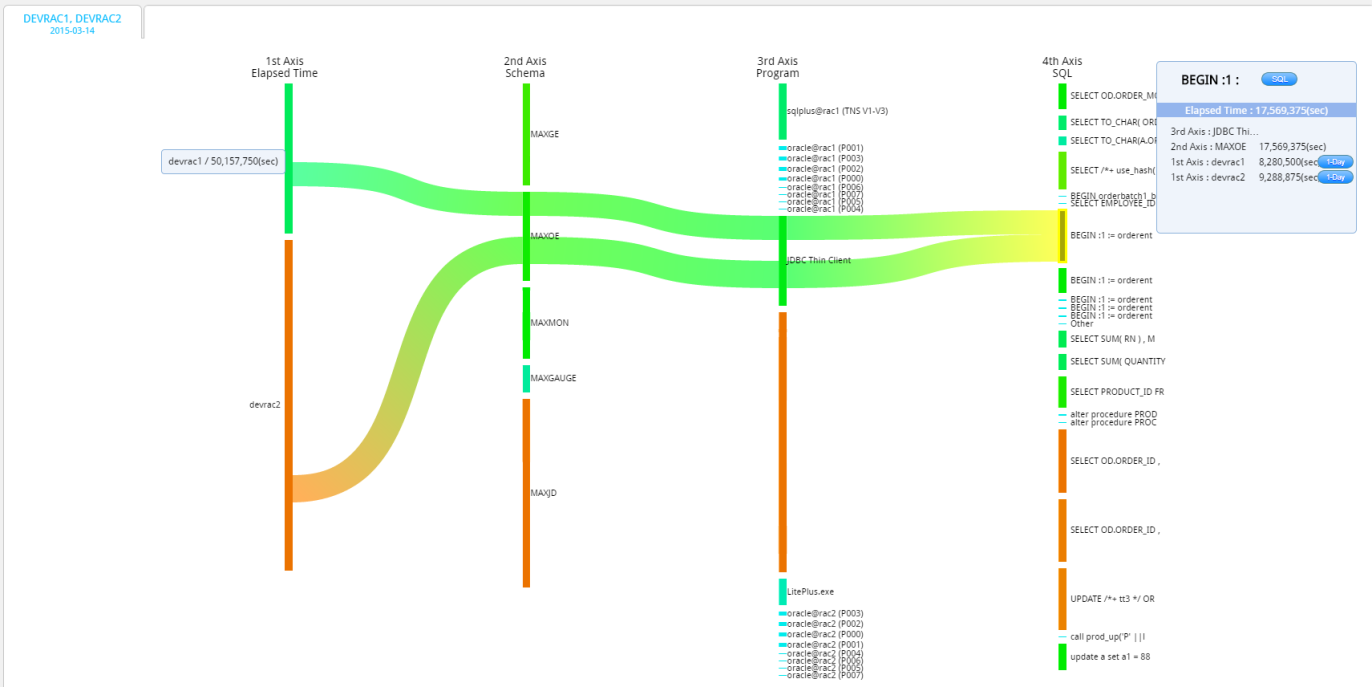
Window Connection
When you click on the SQL Text button, you can check the corresponding SQL Full Text.
When you click on the SQL Detail button, it connects to the SQL Detail Window of the corresponding SQL.
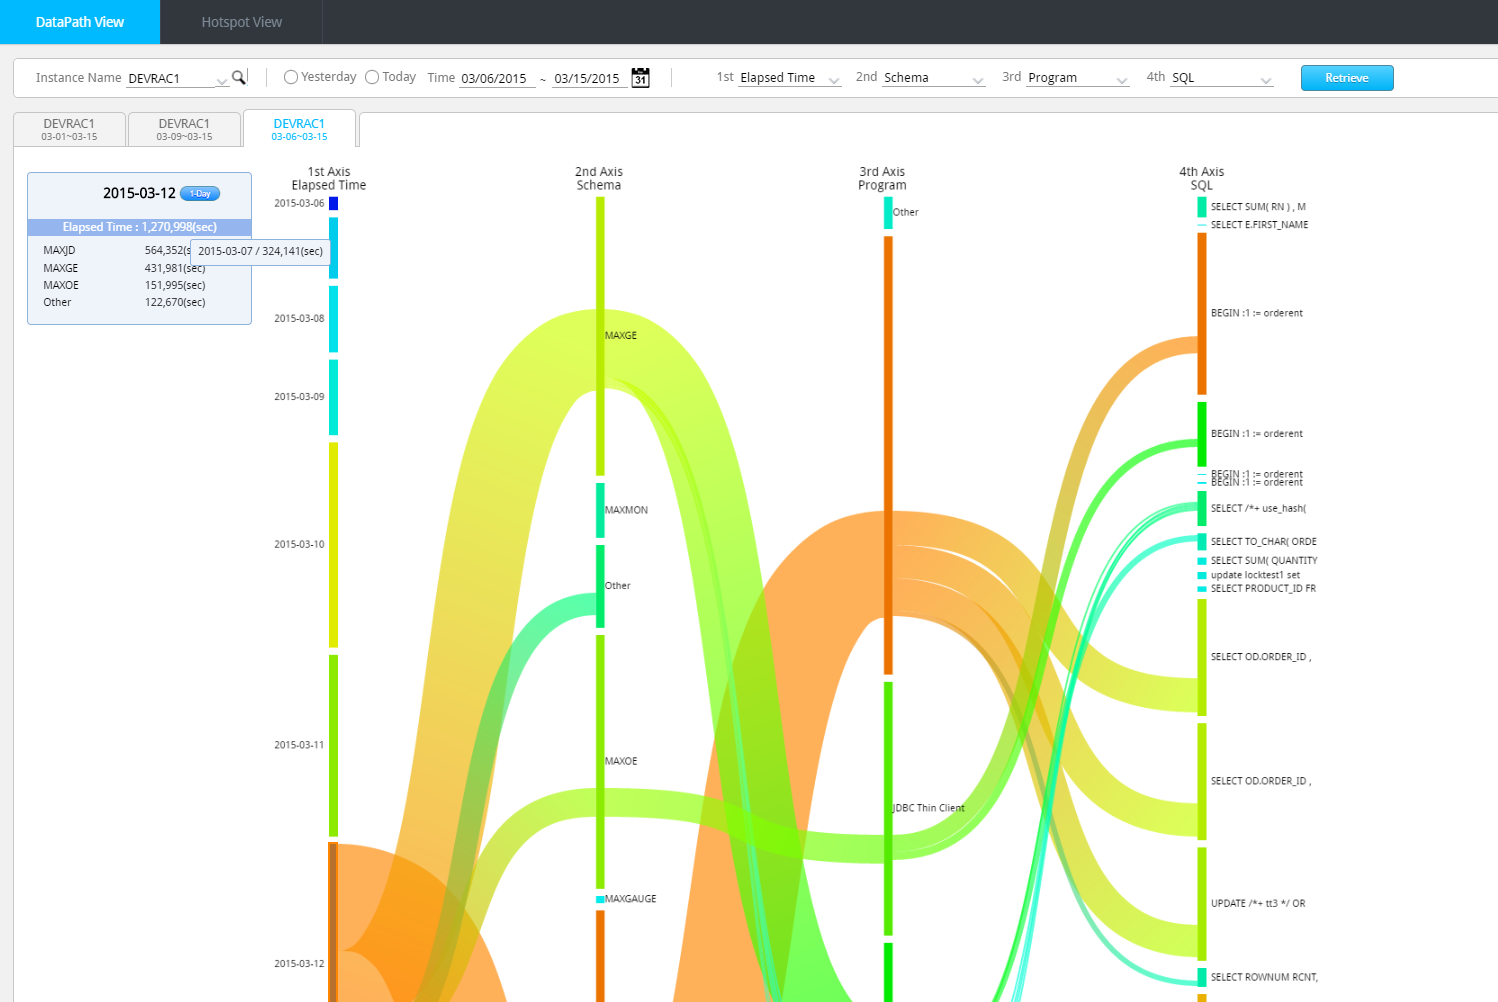
SUB) The UI When Analyzing a Long-Term Period of 1 Instance
We will use the example when Elapsed Time is selected as the 1st axis item and composed of 4 axes.
| Item | Description |
| 1st Axis | Indicates the Elapsed Time by each date with the length of the bar. |
| 2nd Axis | Indicates the Elapsed Time by each Schema with the length of the bar. |
| 3rd Axis | Indicates the Elapsed Time by each Program with the length of the bar. |
| 4th Axis | Indicates the Elapsed Time by each SQL with the length of the bar. |
Initial Screen
Provides a top-down analysis of Date -> Schema -> Program -> SQL, based on the date whose Elapsed Time value is the highest.
Window Connection
When you click on the 1-Day Summary button, it connects to the 1-Day Summary View of the corresponding date.
Input Parameter at the Time of Window Connection
- Analysis Period: Selected Date
- Instance Name: Instance Name Selected in Search Condition
Note. Except the fact that the 1st axis bar represents the “Date”, all other remaining functions are the same as explained in “The UI When Analyzing a Particular Date for Multiple Instances”.
Hotspot View
SUB) Overview
Provides the CPU (%) hotspot period of multiple instances or several dates. Among the data visualization techniques, the heat map technique has been applied.
| Item | Description |
| Extended period’s CPU (%) hot spot analysis for 1 instance | Provides the CPU (%) hotspot by each date and time (every 10 minutes) for the corresponding instance |
| Particular date’s CPU (%) hotspot analysis for multiple instances | Provides CPU (%) hotspot by time (every 10 minutes) of a particular date for multiple instances |
SUB) Window Configuration
The window configuration is as follows.
SUB) Search Condition
| Search Condition | Description |
| |
Selects the target instance for analysis. For selection convenience, the autocomplete function is available. You can choose 2 or more instances by clicking the items in the Combo Box.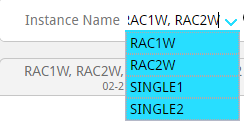
|
|
|
Provides the UI from which you can easily select multiple instances.
|
| |
Sets the analysis period for the last 1 week.
|
| |
Sets the analysis period for the last 1 month.
|
| |
Sets the analysis date for yesterday. (Default Value) |
| |
Sets the analysis date for today. |
| |
You can either enter the analysis date, or select the date from the calendar UI.
|
| |
You can either enter the analysis date, or select the date from the calendar UI.
|
SUB) UI Concept
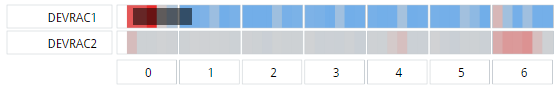
The closer it is to the red color, the higher the CPU (%), and the closer it is to the blue color, the lower the CPU (%).
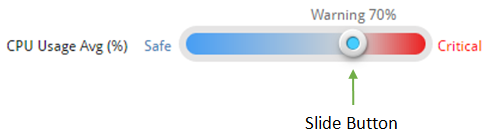
SUB) Hostpot Indicator
This is used to change the Hotspot standard. The CPU (%) standard is 70% (Default Set Value). If you wish to raise or lower the corresponding standard, click on the Vertical Bar and adjust the standard.
SUB) CPU(%) Hostpot Area
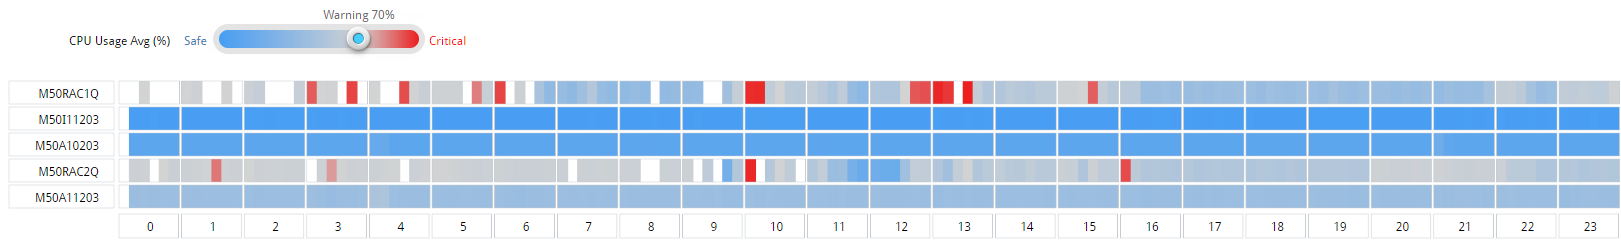
A Particular Date’s CPU (%) Hotspot Analysis of Multiple Instances
| Item | Description |
| Y Axis | Instance Name |
| X Axis | 0~23 Hour |
| Hotspot Individual Box |
Provides CPU (%) hotspot of 1 hour period divided into 6 sections of 10 minutes. This helps to easily identify the period in which the CPU (%) is high within the 1 hour period. |
An Extended Period’s CPU (%) Hotspot Analysis for 1 Instance
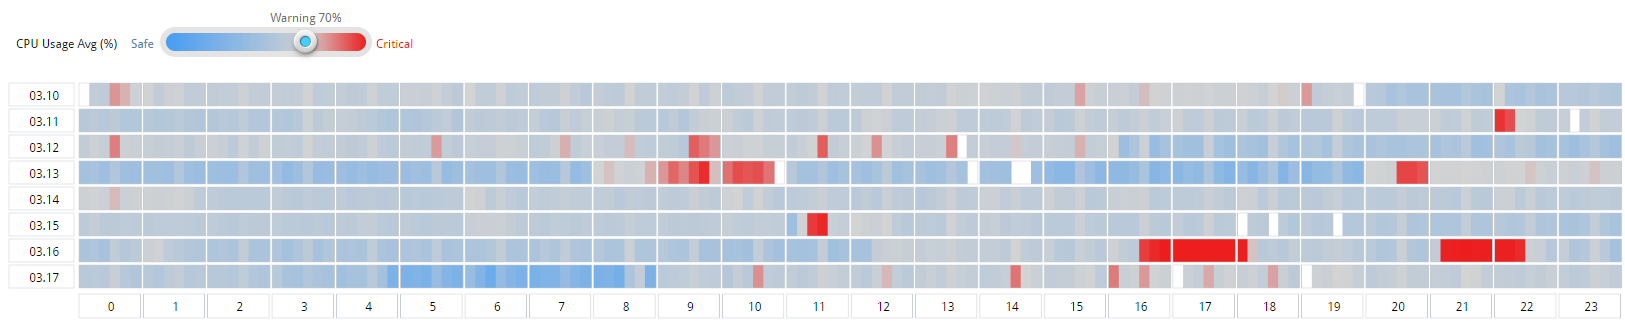
| Item | Description |
| Y Axis | Date |
| X Axis | 0~23 Hour |
| Hotspot Individual Box |
Provides the CPU (%) hotspot of 1 hour period divided into 6 sections of 10 minutes. This helps to easily identify the period in which the CPU (%) is high within the 1 hour period. |
SUB) 1-Day Summary View Connection Method
If a CPU (%) hotspot of particular date or an instance has been identified through the Hotspot View, then it is necessary to do a close-up analysis on the corresponding time period. For this purpose, the Hotspot View provides the function through which you can connect the hotspot period to the 1-Day Summary View. To connect to the 1-Day Summary View, drag with the mouse over the hotspot period you wish to analyze.
| Item | Description |
| When the selection range is for several dates | Tab by each date will be created in the 1-Day Summary View. |
| When the selection range is for several instances | Tab by each instance will be created in the 1-Day Summary View. |