Functions Overview by PA Window
Main functions provided by PA are as follows.
SUB) SQL Analysis
Provides various functions for performance and error analysis.
| Screen Name | Description |
| Top-N Analysis | Provides long-term Top-N stat analysis function.
l Provides Top-N data with respect to the 6 categories (Schema, Program, Module, Machine, OS User, and SQL) based on Elapsed Time, CPU Time, Logical reads, Physical Reads, Executions. |
| Elapsed Time Analysis | Provides elapsed time analysis function and the data from 2 points of view.
l Provides Top-down method elapsed time analysis function with respect to the 6 categories (Schema, Program, Module, Machine, OS User, and SQL). l Provides SQL execution distribution and the elapsed time analysis function by individual SQL by providing individual SQL’s elapsed time in a scatter chart. |
| Long-Term Trend | Provides long-term performance and Top-N trend analysis function.
l Provides daily trends of Top-N (Schema, Program, Module, and SQL). |
| Change History Trend & Analysis | Provides the number of SQLs with changes in the execution plan by date and the execution plan comparison function.
l Provides the number of SQLs with changes, differentiating the number of SQL’s whose elapsed time has increased or decreased in accordance with the changes in the execution plan. l Provides CRUD matrix by table and the related SQLs. |
SUB) Trend Analysis
Provides various functions for performance and error analysis.
| Window Name | Description |
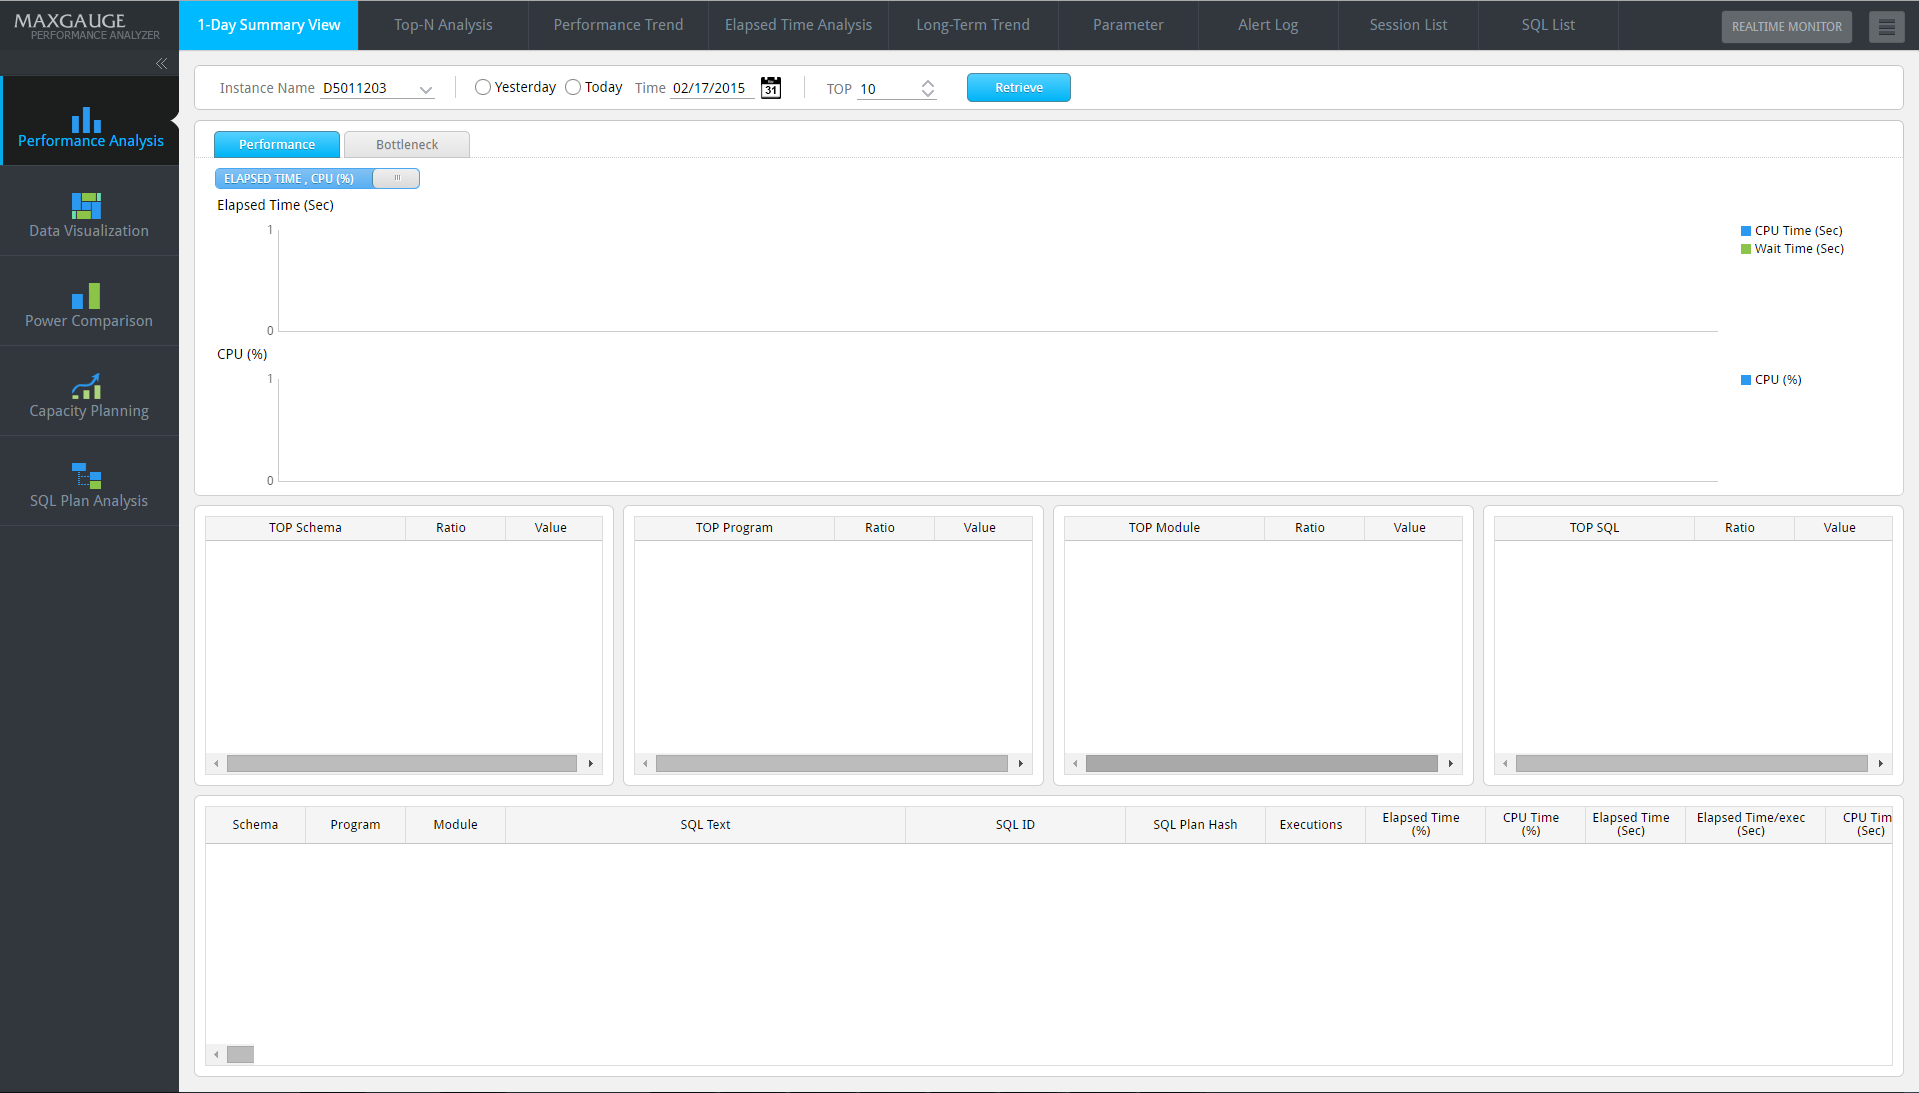
| 1-Day Summary View | Provides a quick analysis of the peak time period within the day.
|
| Performance Trend | Provides a function for detailed performance analysis
|
| Session List | Provides the session search function. |
| SQL List | Provides SQL search function. |
| Long-Term Trend | Provides a function for analyzing the long-term performance and Top-N trends.
|
| Parameter | Provides Oracle parameter information and parameter change history. |
| Parameter | Provides Oracle parameter information and parameter change history. |
| Alert Log | l Provides Oracle alert log and alarm generation details. |
| Session ListAlert Log | Provides session search function. Provides Oracle alert log and alarm generation details. |
SUB) Data Visualization
Provides an analysis window which has been applied with a Data Viualization technique.
| Window Name | Description |
| DataPath View | Provides the analysis of the degree of significance of multiple instances or dates. It also provides a bi-directional connection analysis among the Instance, Schema, Program (or Module), and SQL.
|
| Hotspot View | Provides the CPU (%) hotspot period of multiple instances or several dates.
|
SUB) Power Comparison
Provides a function for performance comparisons from various points of view.
| Window Name | Description |
| Module Comparison | Provides a function for comparing with previous execution history, in the event of a particular module’s (up to 5) performance degradation. |
| Program Comparison | Provides a function for comparing with previous execution history, in the event of a particular program’s performance degradation. |
| Session Comparison | Provides a function for comparing with previous execution history, in the event of a particular session’s performance degradation. |
| Peak Time Comparison | Provides a function for comparing with the previous dates’ corresponding time, in the event of performance degradation at a particular time period. |
| Node Comparison | Provides a function for comparing the workload and SQL performance of multiple instances. |
| Load Test Comparison | Provides a function for comparing the performance among the different load tests executed several times throughout the day (up to 5 times). |
SUB) Capacity Planning
Provides the data required for capacity calculation.
| Window Name | Description |
| Tablespace | Provides the tablespace’s usage and free space trends. It also provides the Top-N segment information within the tablespace whose usage increase ratio (and size) is high. |
| Segment | Provides the trends of a specific segment’s daily size and the daily increase in size. |
SUB) Analysis Report
Provides a function for SQL Plan analysis.
| Report Template | Description |
| Daily Report | Provides performance analysis report of a specific date. |
| Long-Term Report | Provides performance analysis report of a specific period. |
| Hotspot Report | Provides performance analysis report of a Hotspot area. |
Getting Started
To start the task of performance management through PA, enter the MaxGauge website address into the web browser bar.
![]()
Note. The IP and the PORT are in reference to the platform.JS, which is one of MaxGauge’s components. IP is the server IP in which the platform.JS is located and the PORT is one which is used by the platform.JS.
On the left panel of the Login screen, select Performance Analyzer, and enter the ID and the password.
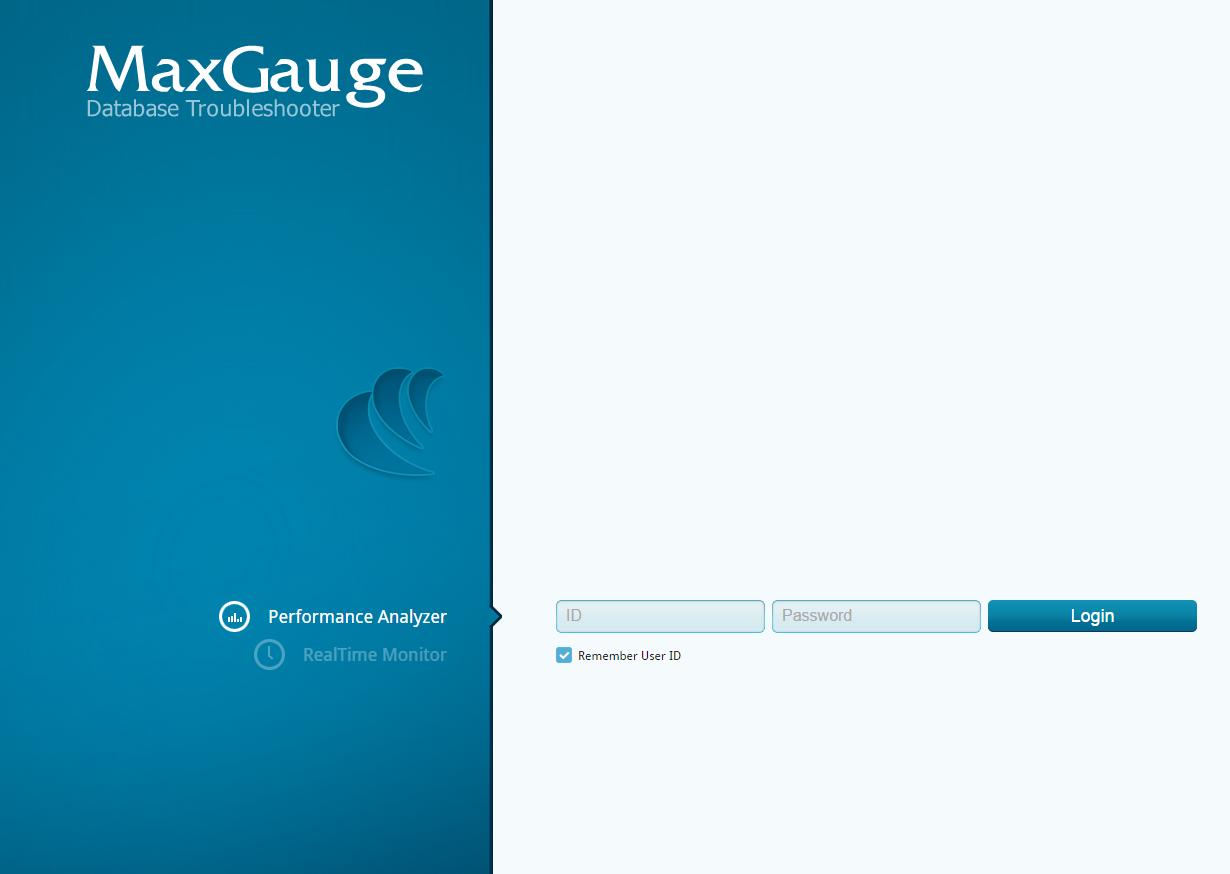
SUB) Enter ID/Password
Enter MaxGauge ID and password. The default ID is as follows.
| ID | Default Password | Permissions |
| admin | manager | Super User |
Note. MaxGaugae ID and password are case-sensitive. For information on user management, please reference “MaxGauge Configuration Manual”.
Once user authentification process is over, then the following screen will appear.