
Module Comparison
SUB) Overview
In the event of a particular module’s (up to 5) performance degradation, it provides the function through which you can compare with the previous execution history.
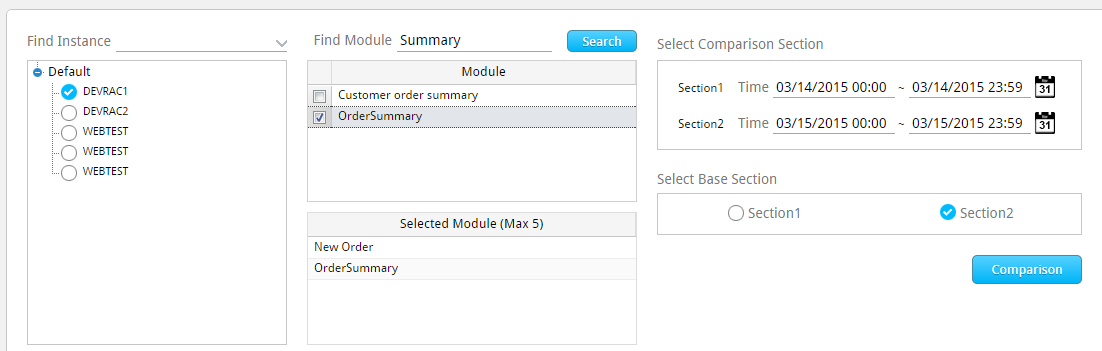
SUB) Search Condition
The Search Condition window configuration is as follows.
| Search Condition | Description |
| |
Enter or select the target instance for analysis. For selection convenience, the autocomplete function is available. When you click on the drop-down menu, a list of all the instances will appear. |
 |
Indicates the instance selected in Find Instance. You can also directly selecte the target analysis instance from the corresponding screen. |
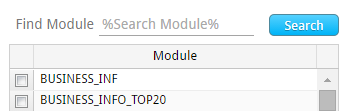 |
Used for module search. When you click on the “Search” button without entering the module name in the Find Module, then the whole list of module names will be output at the bottom. The Find Module input rules are as follows.
|
|
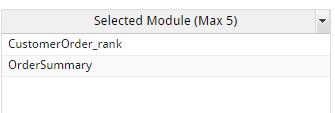
Provides a list of modules selected in the Find Module window.
|
 |
Set the comparison sections. |
|
|
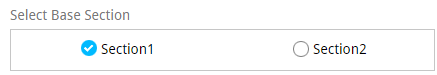
Set the standard section.
|
SUB) Window Configuration
The window configuration is as follows.
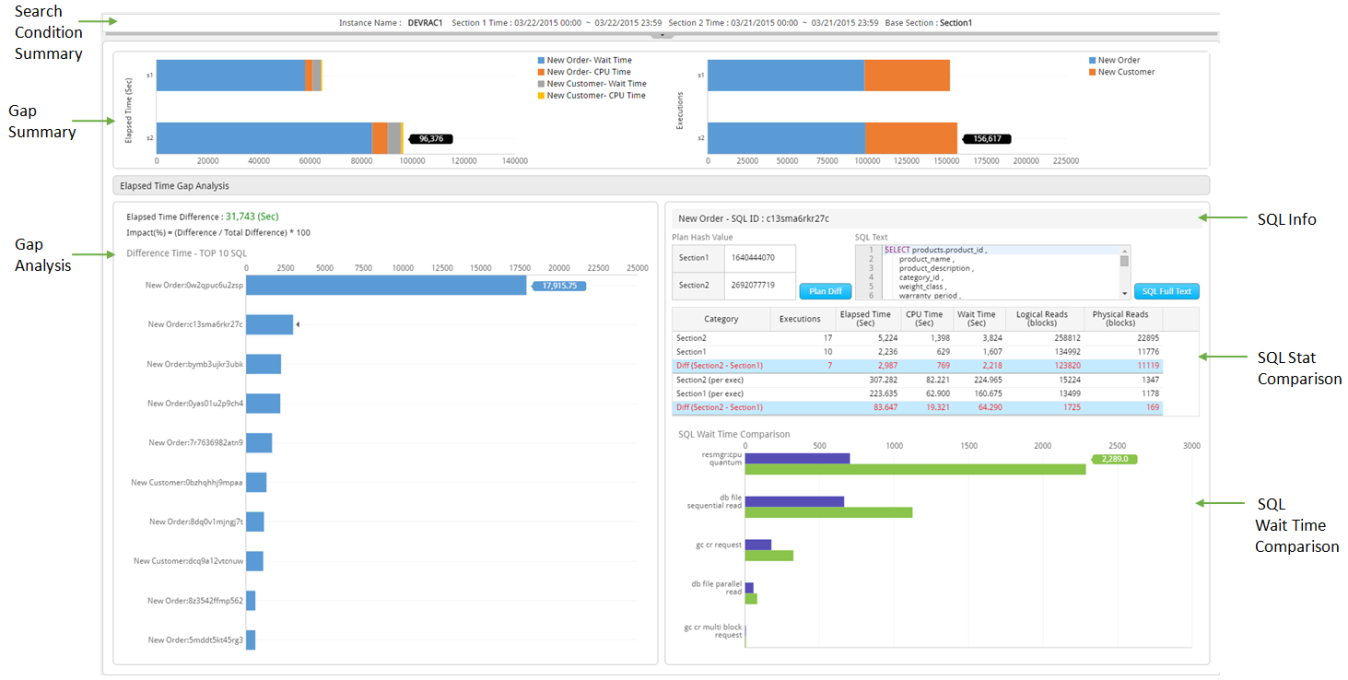
SUB) Search Condition Summary
Provides the summary information of the search conditions entered in Search Condition.
Note. If you want to see the previous state of the Search Condition, click on the ![]() button.
button.
SUB) Gap Summary
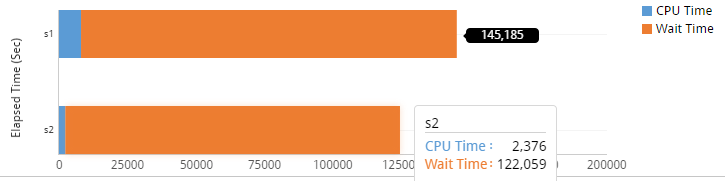
Provides summary information of comparing two sections based on the module execution time and the execution count of the SQLs executed in the corresponding module.
- Elapsed Time(Sec): Provides the CPU Time and Wait Time information by each Module
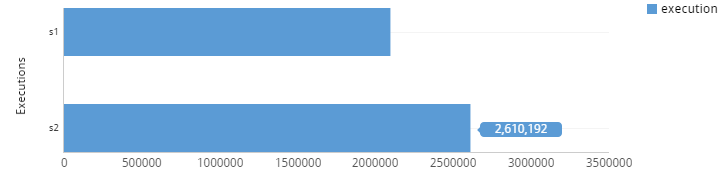
- Executions: Provides SQL Execution Count by each Module
Elapsed Time(Sec) Comparison Window
Executions Comparison Window
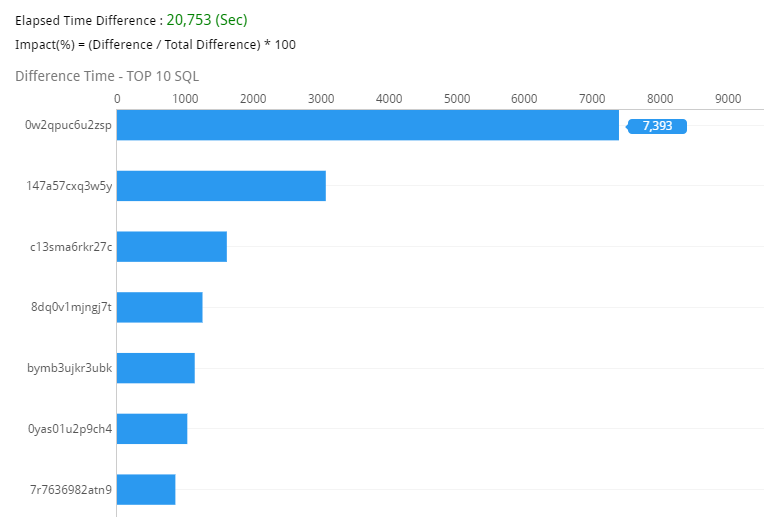
SUB) Gap Analysis
- Provides the difference between the two sections’ total Elapsed Time.
- Provides the Top-10 SQL ID, whose Elapsed Time difference is high compared to the Base
Gap Analysis Window
| Item | Description |
| Elapsed Time Difference | Provides the total Elapsed Time difference between the two sections.
|
| Difference Time – TOP 10 SQL | Provides the Top-10 SQL ID whose Elapsed Time difference is high compared to the Base section.
|
| Impact(%) = (Difference / Total Difference) *100 | The ratio of individual SQL’s Elapsed Time difference out of the total Elapsed Time difference. |
| Graph Y Axis | Module Name: Oracle SQL ID |
| Graph X Axis | Elapsed Time (Sec) |
| Bar Graph | Individual SQL’s Elapsed Time Difference (Sec) |
SUB) SQL Info
Provides information of the SQL selected (bar graph click) in the Gap Analysis.
SQL Info Window
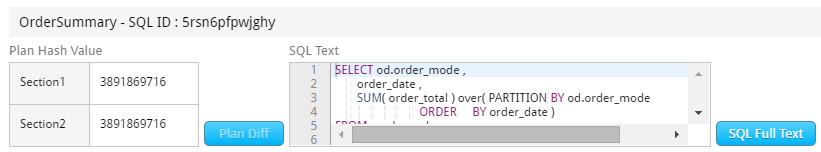
| Item | Description |
| Plan Hash Value | Provides the Plan Hash Value by each section.
|
| SQL Text | Provides the SQL statement. |
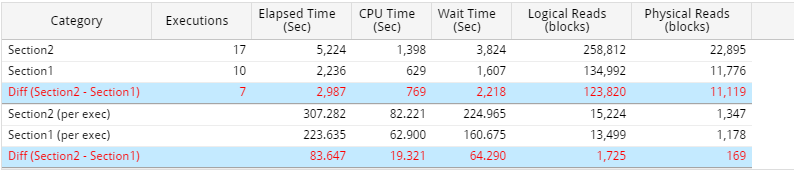
SUB) SQL Stat Comparison
Compares the main performance information of the SQL selected (bar graph click) in the Gap Analysis.
SQL Stat Comparison Window
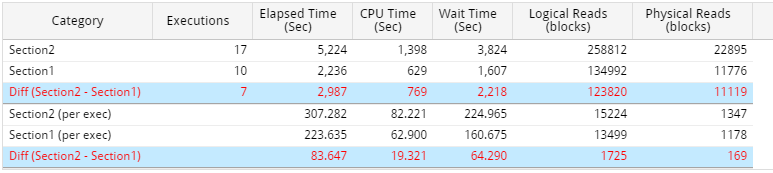
SQL Stat Comparison Grid Column
| Column Name | Description |
| Category | Section1: Base section’s SQL execution information (Sum)
Section2: The comparison section’s SQL execution information (Sum) Diff (Section2 –Section1): Sum Value Difference Section1(per exec): Base section’s SQL execution information (Average per execution) Section2(per exec): The comparison section’s SQL execution information (Average per execution) Diff (Section2 –Section1): Average per 1 execution Difference |
| Executions | Corresponding SQL’s Execution Count |
| Elapsed Time (Sec) | Corresponding SQL’s Elapsed Time |
| CPU Time (Sec) | Corresponding SQL’s CPU Time |
| Wait Time (Sec) | Corresponding SQL’s Wait Time |
| Logical Reads (blocks) | Corresponding SQL’s Logical IO |
| Physical Reads (blocks) | Corresponding SQL’s Physical IO |
SQL Stat Comparison Grid Mouse Right-Click Menu
The mouse right-click menu is as follows. For more information, please reference “Appendix. Grid Mouse Right-Click Menu UI”.
| Item | Description |
| Export Excel | Downloads the grid content on an excel file. |
| Copy(To Clipboard) | Makes a copy of the grid content. |
| Show/ Hide Columns | Selects the columns to be displayed on the grid. |
| Filter On | Enables the Filtering function. |
| Multiple Sort On | Sorts based on 2 or more column values. |
| Save Image | Saves the grid content as an image. |
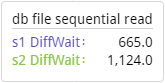
SUB) SQL Wait Time Comparison
Compares the wait time per 1 execution of the SQL selected (bar graph click) in the Gap Analysis.
SQL Wait Time Comparison Window
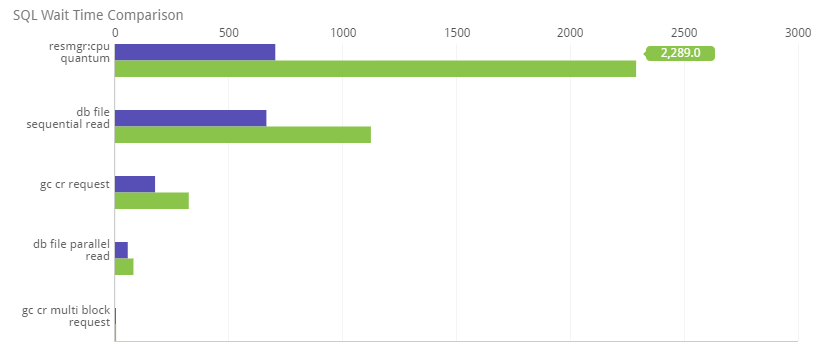
| Item | Description |
| Y Axis | Wait Event Name |
| X Axis | Wait Time (Sec) |
| Bar Graph | Wait Time of corresponding wait event by each section (Average per 1 time)
|
Program Comparison
SUB) Overview
In the event of a particular program’s performance degradation, it provides the function through which you can compare with the previous execution history.
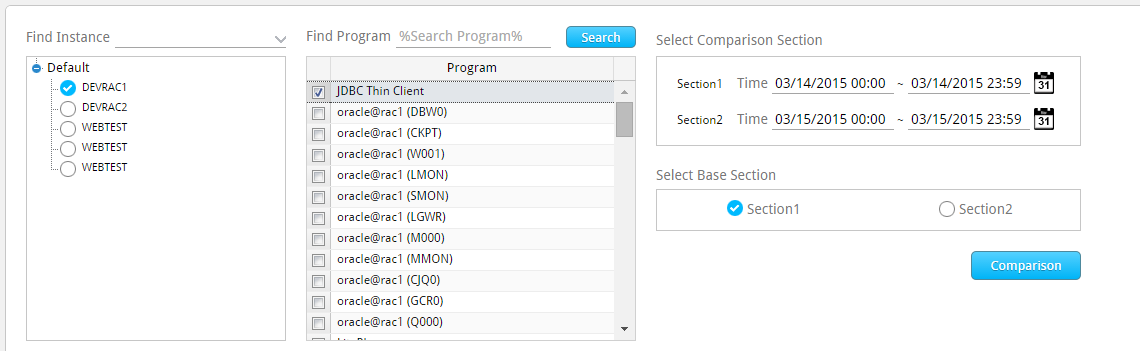
SUB) Search Condition
The Search Condition window configuration is as follows.
| Search Condition | Description |
| |
Enter or select the target instance for analysis. For selection convenience, the autocomplete function is available. When you click on the drop-down menu, a list of all the instances will appear. |
 |
Indicates the instance selected in Find Instance. You can also directly selecte the target analysis instance from the corresponding screen. |
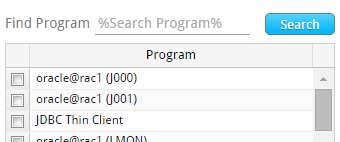 |
Used for program search. When you click on the “Search” button without entering the program name in the Find Program, then the whole list of program names will be output at the bottom.
The Find Program input rules are as follows.
|
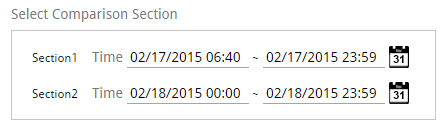 |
Set the comparison sections. |
 |
Set the standard section.
|
SUB) Window Configuration
The window configuration is as follows.
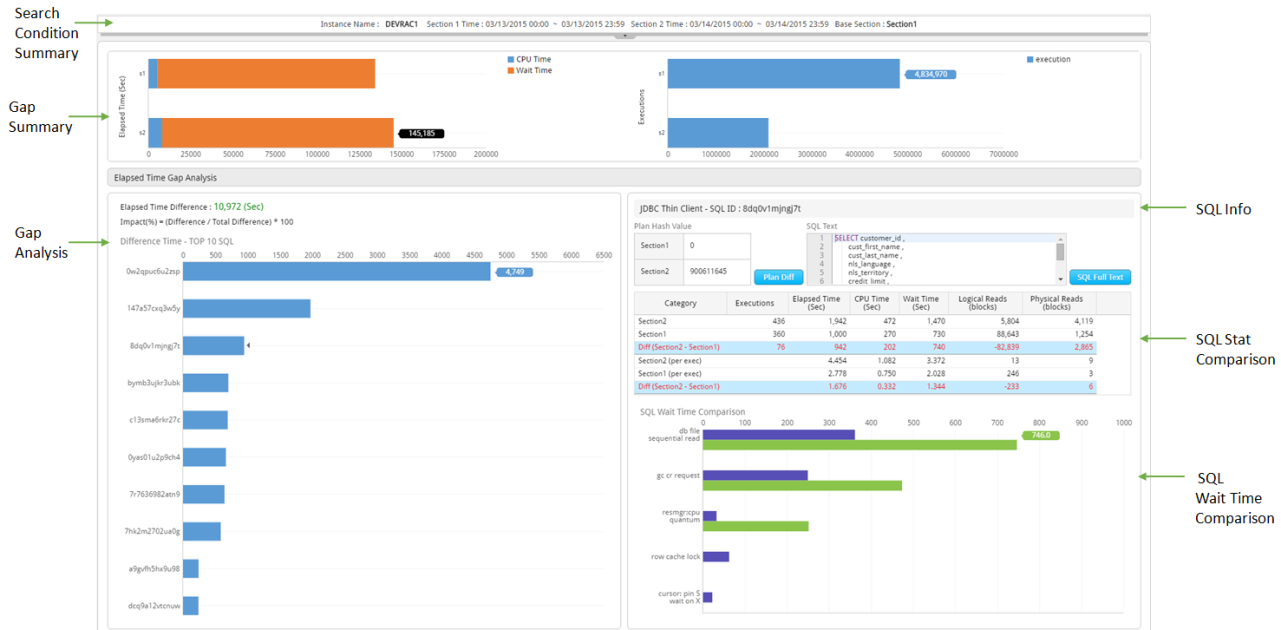
SUB) Search Condition Summary
Provides the summary information of the search conditions entered in Search Condition.
Note. If you want to see the previous state of the Search Condition, click on the ![]() button.
button.
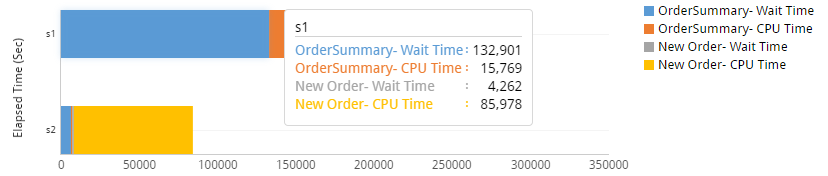
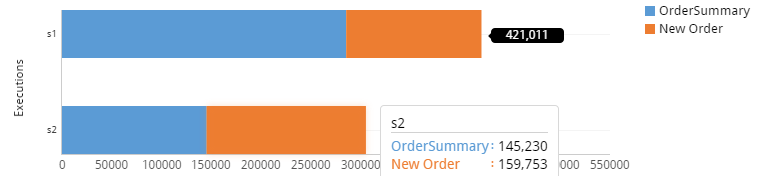
SUB) Gap Summary
Provides summary information of comparing two sections based on the program execution time and the execution count of the SQLs executed in the corresponding program.
- Elapsed Time(Sec): Provides the CPU Time and Wait Time information by each Program
- Executions: Provides SQL Execution Count by each Program
Elapsed Time(Sec) Comparison Window
Executions Comparison Window
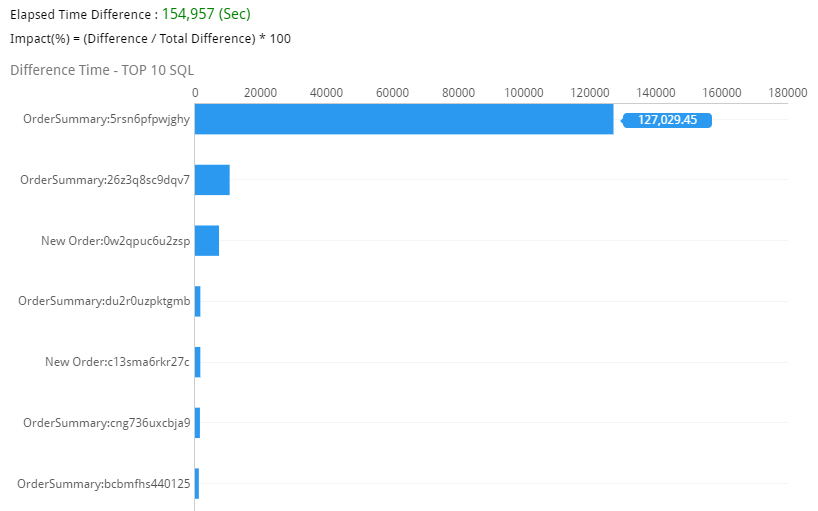
SUB) Gap Analysis
- Provides the difference between the two sections’ total Elapsed Time.
- Provides the Top-10 SQL ID, whose Elapsed Time difference is high compared to the Base
Gap Analysis Window
| Item | Description |
| Elapsed Time Difference | Provides the total Elapsed Time difference between the two sections.
|
| Difference Time – TOP 10 SQL | Provides the Top-10 SQL ID whose Elapsed Time difference is high compared to the Base section.
|
| Impact(%) = (Difference / Total Difference) *100 | The ratio of individual SQL’s Elapsed Time difference out of the total Elapsed Time difference. |
| Graph Y Axis | Module Name: Oracle SQL ID |
| Graph X Axis | Elapsed Time (Sec) |
| Bar Graph | Individual SQL’s Elapsed Time Difference (Sec) |
SUB) SQL Info
Provides information of the SQL selected (bar graph click) in the Gap Analysis.
SQL Info Window
| Item | Description |
| Plan Hash Value | Provides the Plan Hash Value by each section.
|
| SQL Text | Provides the SQL statement. |
SUB) SQL Stat Comparison
Compares the main performance information of the SQL selected (bar graph click) in the Gap Analysis. .
SQL Stat Comparison Window
SQL Stat Comparison Grid Column
| Column Name | Description |
| Category | Section1: Base section’s SQL execution information (Sum)
Section2: The comparison section’s SQL execution information (Sum) Diff (Section2 –Section1): Sum Value Difference Section1(per exec): Base section’s SQL execution information (Average per execution) Section2(per exec): The comparison section’s SQL execution information (Average per execution) Diff (Section2 –Section1): Average per 1 execution Difference |
| Executions | Corresponding SQL’s Execution Count |
| Elapsed Time (Sec) | Corresponding SQL’s Elapsed Time |
| CPU Time (Sec) | Corresponding SQL’s CPU Time |
| Wait Time (Sec) | Corresponding SQL’s Wait Time |
| Logical Reads (blocks) | Corresponding SQL’s Logical IO |
| Physical Reads (blocks) | Corresponding SQL’s Physical IO |
SQL Stat Comparison Grid Mouse Right-Click Menu
The mouse right-click menu is as follows. For more information, please reference “Appendix. Grid Mouse Right-Click Menu UI”.
| Item | Description |
| Export Excel | Downloads the grid content on an excel file. |
| Copy(To Clipboard) | Makes a copy of the grid content. |
| Show/ Hide Columns | Selects the columns to be displayed on the grid. |
| Filter On | Enables the Filtering function. |
| Multiple Sort On | Sorts based on 2 or more column values. |
| Save Image | Saves the grid content as an image. |
SUB) SQL Wait Time Comparison
Compares the wait time per 1 execution of the SQL selected (bar graph click) in the Gap Analysis.
SQL Wait Time Comparison Window
| Item | Description |
| Y Axis | Wait Event Name |
| X Axis | Wait Time (Sec) |
| Bar Graph | Wait Time of corresponding wait event by each section (Average per 1 time)
|
Peak Time Comparison
SUB) Overview
In the event of a poorly performing section is generated, it provides a function through which you can compare with the previous dates’ corresponding time.
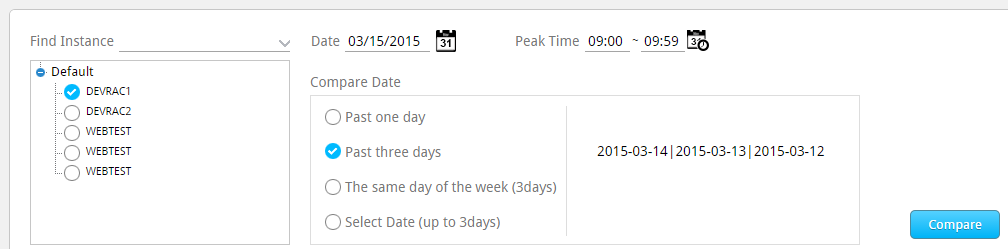
SUB) Search Condition
The Search Condition window configuration is as follows.
| Search Condition | Description |
| |
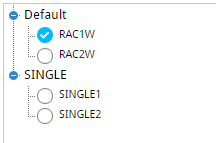
Enter or select the target instance for analysis. For selection convenience, the autocomplete function is available. When you click on the drop-down menu, a list of all the instances will appear. |
|
Indicates the instance selected in Find Instance. You can also directly selecte the target analysis instance from the corresponding screen. |
| |
Set the analysis target Peak date. |
| |
Set the time period within the analysis target Peak date. |
|
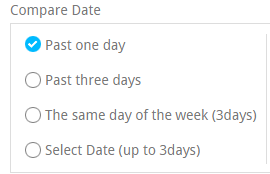
Set the comparison date.
|
SUB) Window Configuration
The window configuration is as follows.
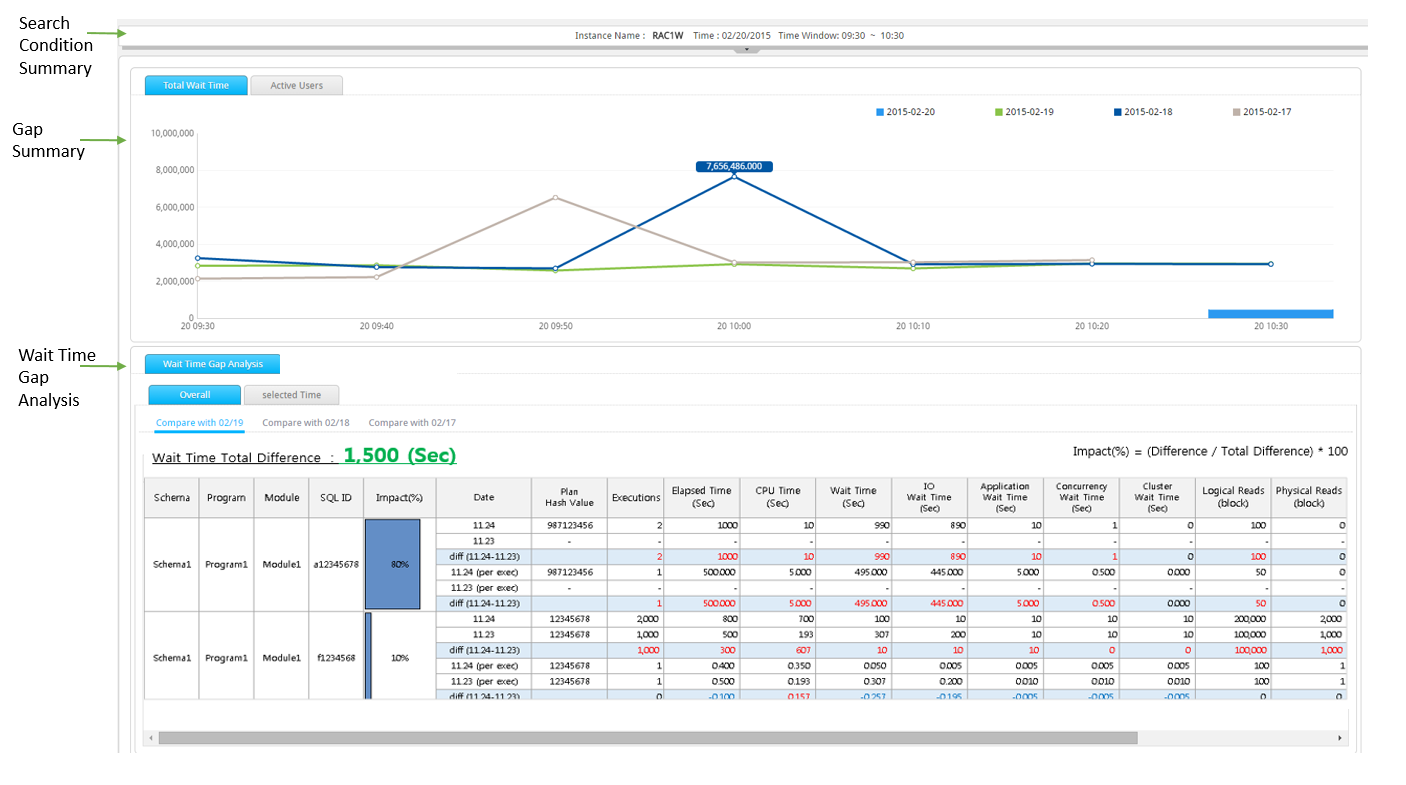
SUB) Search Condition Summary
Provides the summary information of the search conditions entered in Search Condition.
Note. If you want to see the previous state of the Search Condition, click on the ![]() button.
button.
SUB) Gap Summary
Provides the hourly comparison information of the Wait Time and Active User Session indicators.
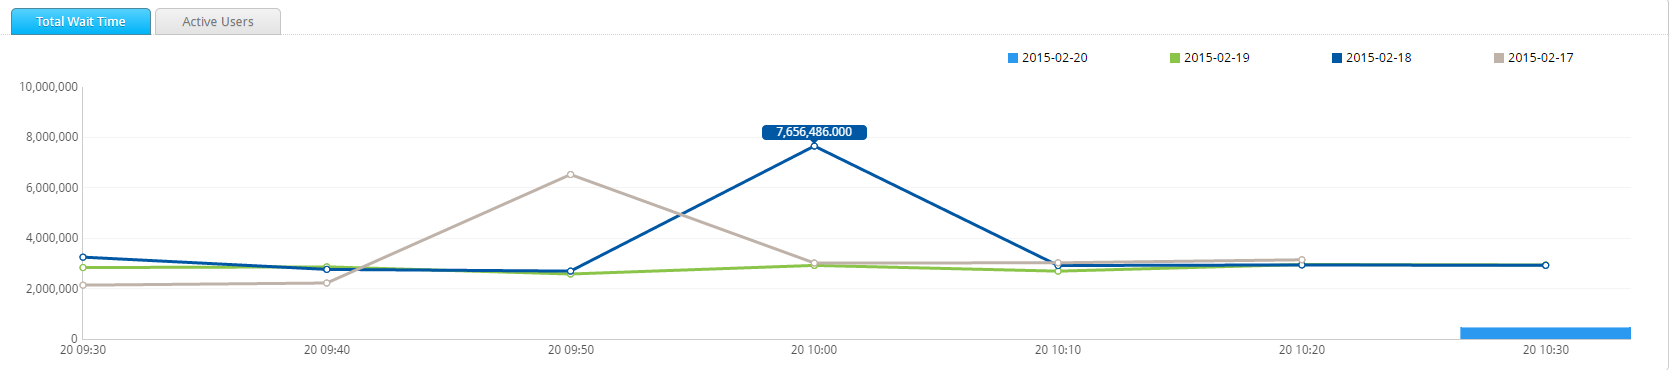
- Total Wait Time Tab: Compares the Hourly Total Wait Time of the Peak Date and the comparison date(s).
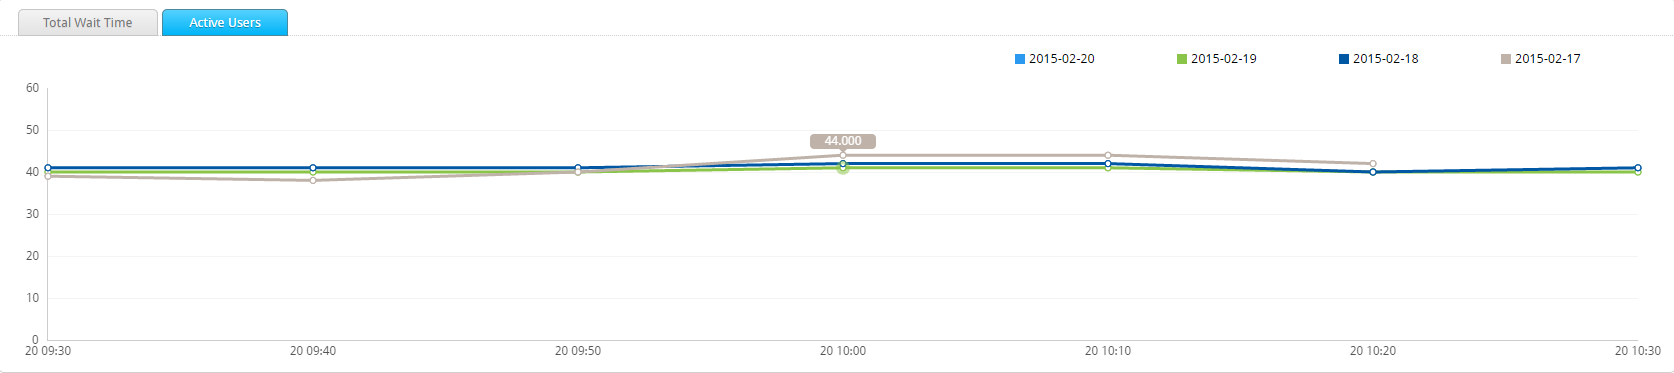
- Active User Session Tab: Compares the Hourly Average Active User Sessions Values of the Peak Date and the comparison date(s).
Total Wait Tab Window
Active User Session Tab Window
SUB) Wait Time Gap Analysis
- Provides a function through which you can analyze a particular time section’s Wait Time Gap of the Peak Date and the comparison date.
Overall Tab Window
Compares and analyzes the entire section’s Wait Time Gap for the Peak Date and the comparison date.
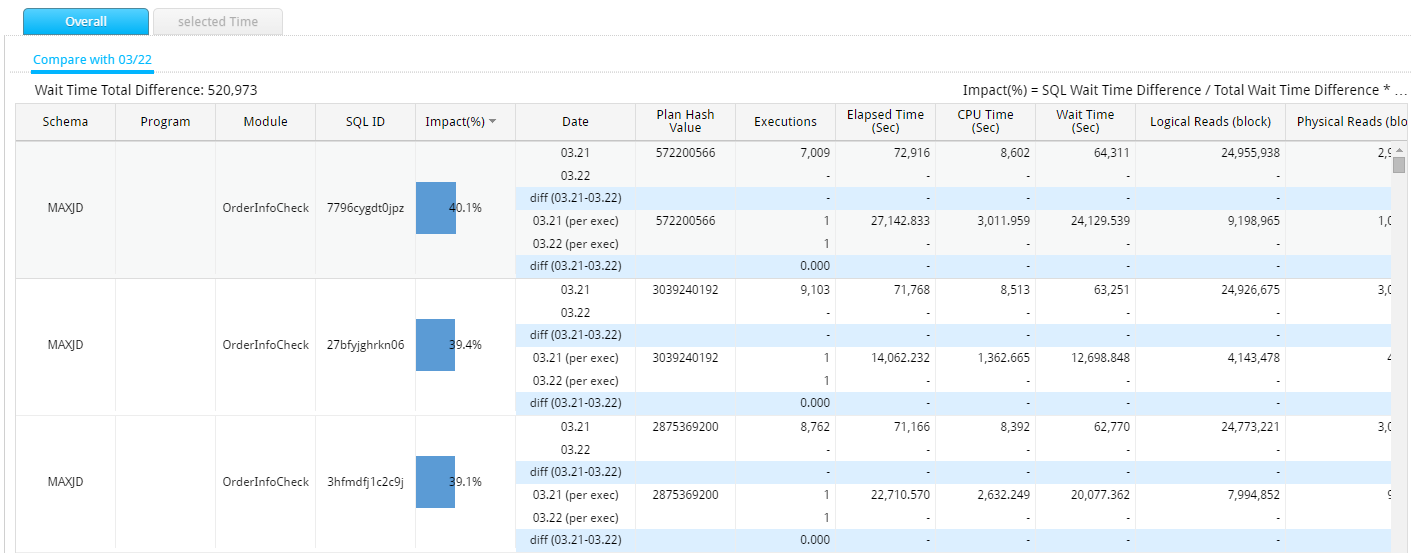
Note. When there are 2 or more comparison dates, then it is compared in the order of most recent date.
Selected Time Tab Window
Compare and analyzes the hourly Wait Time Gap of the Peak Date and the comparison date.
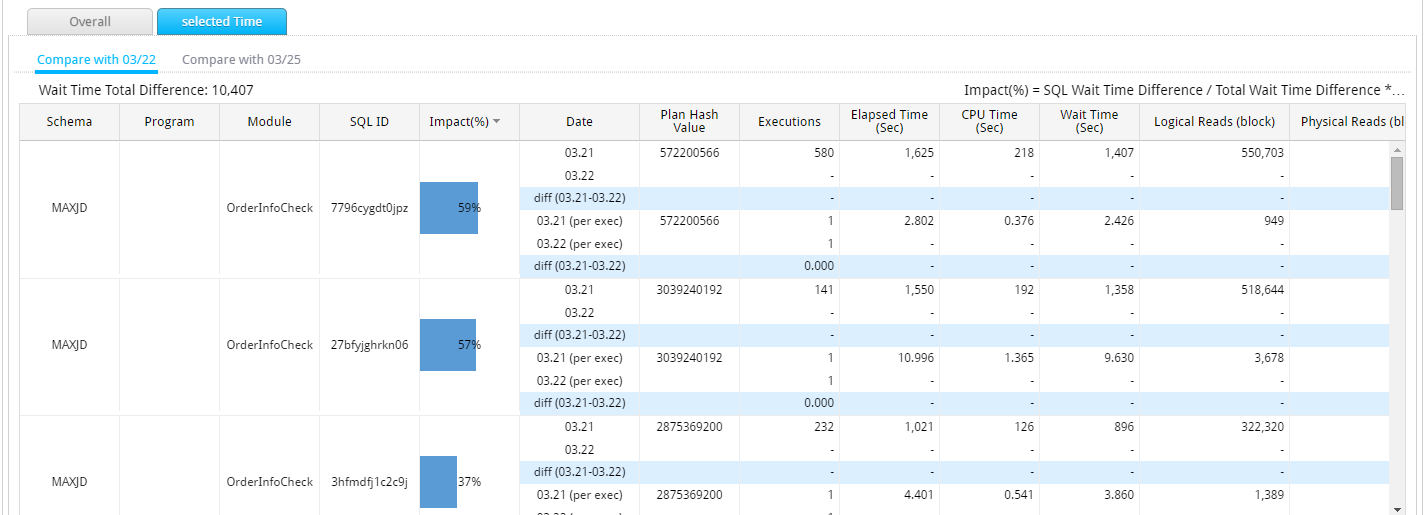
Note. When you first click on the Selected Time Tab, it automatically compares the the time window at which the Wait Time is the highest within the Peak Date.
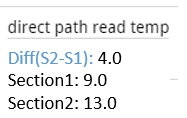
Wait Time Total Difference
Provides the difference in the Wait Time.
Note1. Peak Date’s Wait Time (Sec) – Comparison Date’s Wait Time (Sec)
Note2. The Total Tab provides the difference between the entire sections, and the Selected Time Tab provides the difference between each selected time window.
Grid Column (Common)
| Column Name | Description |
| Schema | Schema Name |
| Program | Program Name |
| Module | Module Name |
| SQL ID | Oracle SQL ID |
| Impact (%) |
|
| Date | Date |
| Plan Hash Value | SQL Plan hash |
| Executions | Corresponding SQL’s Execution Count (Sum) |
| Elapsed Time (Sec) | Corresponding SQL’s Elapsed Time (Sum) |
| CPU Time (Sec) | Corresponding SQL’s CPU Time (Sum) |
| Wait Time (Sec) | Corresponding SQL’s Wait Time (Sum) |
| User IO Wait Time (Sec) | The time waited on User IO Wait Class when corresponding SQL is executed, (Sum) |
| Application Wait Time (Sec) | The time waited on Application Wait Class when corresponding SQL is executed. (Sum) |
| Concurrency Wait Time (Sec) | The time waited on Concurrency Wait Class when corresponding SQL is executed. (Sum) |
| Cluster Wait Time (Sec) | The time waited on Cluster Wait Class when corresponding SQL is executed. (Sum) |
| Logical Reads (blocks) | Corresponding SQL’s Logical IO (Sum) |
| Physical Reads (blocks) | Corresponding SQL’s Physical IO (Sum) |