
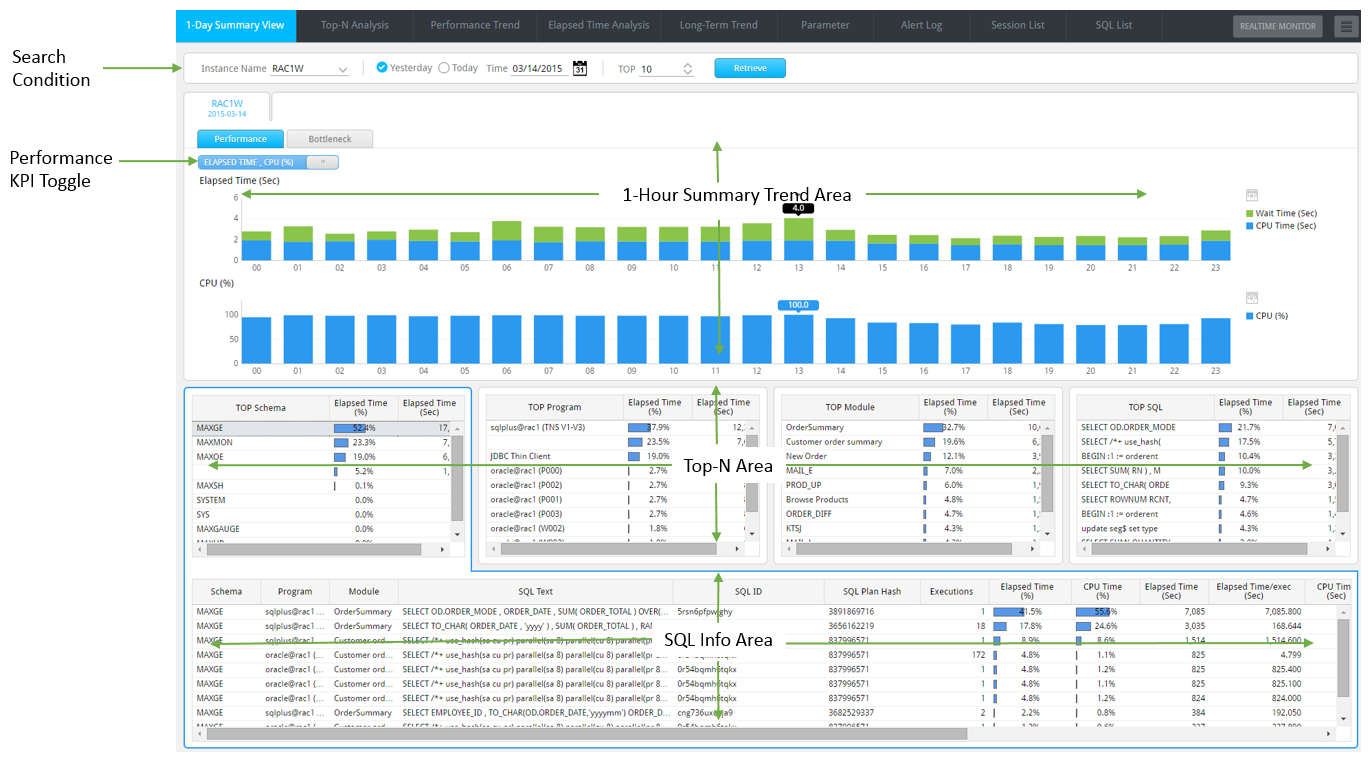
1-Day Summary View
SUB) Overview
This window provides the average hourly trends graph of main performance indicators and wait classes which help to easily identify the peak times. Also, you can check the Top-N data in the corresponding time period and the executing SQLs by wait events with a single mouse click.
SUB) Overview
Provides a function for the analysis of a long-term performance and Top-N trends. The main functions are as follows.
- Statistics Tab: Provides daily performance trends of performance indicators and wait events.
- Class Tab: Provides daily performance trends of Wait Class, Latch Wait Time, and Enqueue Wait Time.
- Top Analysis Tab: Provides daily performance trends of Top-N (Schema, Program, Module, and SQL).
- 1-SQL: Provides daily performance trends of individual SQL.
Note1. Latch Wait Time: A performance indicator whose value is the total sum of wait times of all the wait events which start with “latch:”.
Note2. Enqueue Wait Time: A performance indicator whose value is the total sum of wait times of all the wait events which start with “enq:”.
SUB) Window Configuration
The window configuration is as follows.
| Tab Name | Description |
| Performance Tab | Provides hourly performance trends of main performance indicators and the Top-N information of different times. |
| Bottleneck Tab | Provides hourly performance trends of wait classes and the execution SQL information by wait events. |
SUB) Statistics Tab Explanation
Window Configuration
The window configuration is as follows.
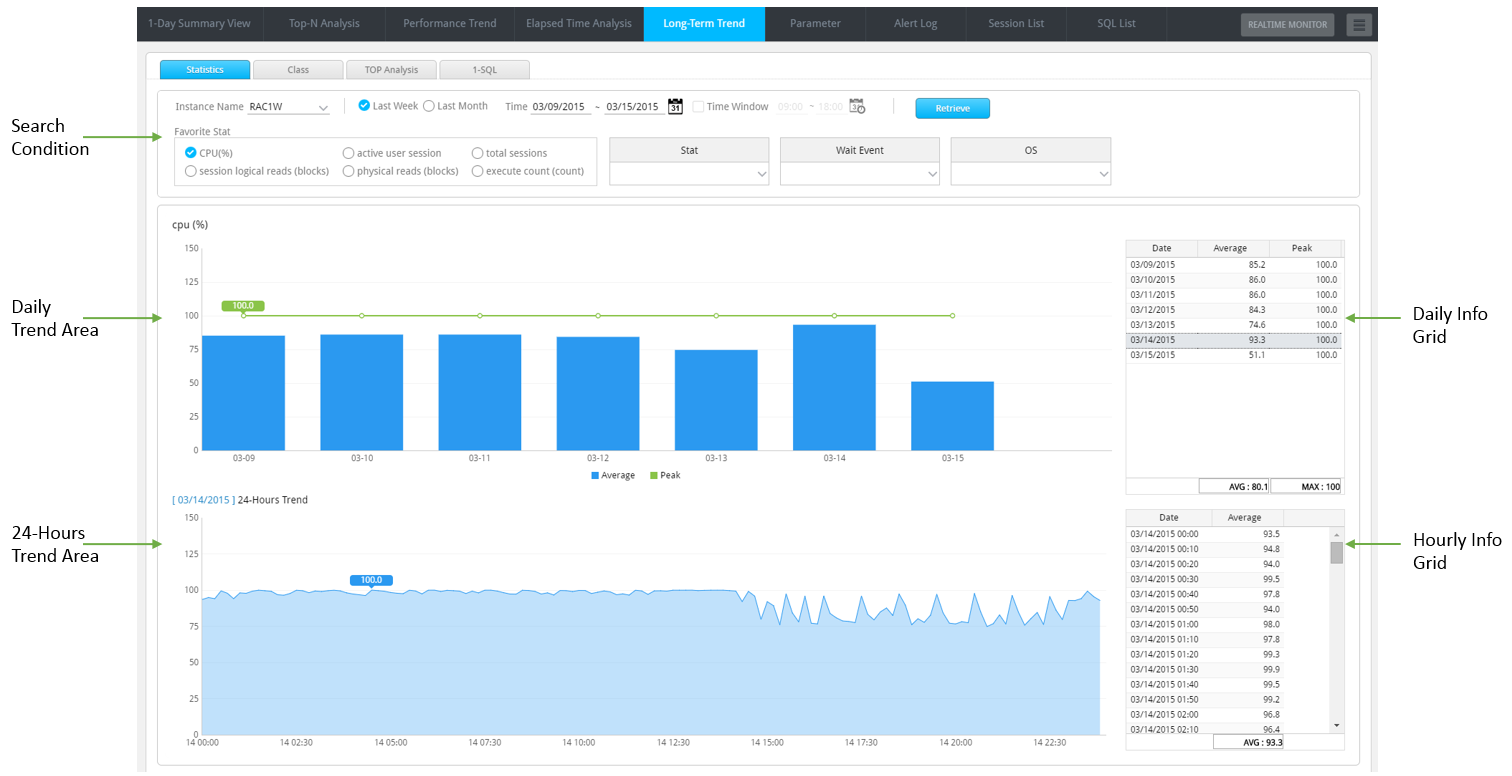
SUB) Search Condition
| Search Condition | Description |
| |
Selects the target instance for analysis. For searching convenience, autocomplete function is available. |
| |
Sets the analysis date for yesterday. (Default Value) |
| |
Sets the analysis date for today. |
| |
You can either enter the analysis date, or select the date from the calendar UI. |
| |
Select the number of Top-N data to be output in the Top-N Area.
|
SUB) Performance Tab Explanation
The content provided in the Performance Tab is as follows.
Performance KPI Toggle Button
Select the performance indicators to be displayed in the 1-Hour Summary Trend Area.
| Toggle Item | Description |
| |
Provides the average data of Elapsed Time and OS CPU (%) by each time period. (Default Value)
|
| |
Provides the average data of Logical IO and Physical IO by each time period.
|
Note. The Trend Data uses the system level’s performance indicator values.
1-Hour Summary Trend Area
Provides the hourly performance trends of the selected main performance indicators by using the Performance KPI Toggle button.
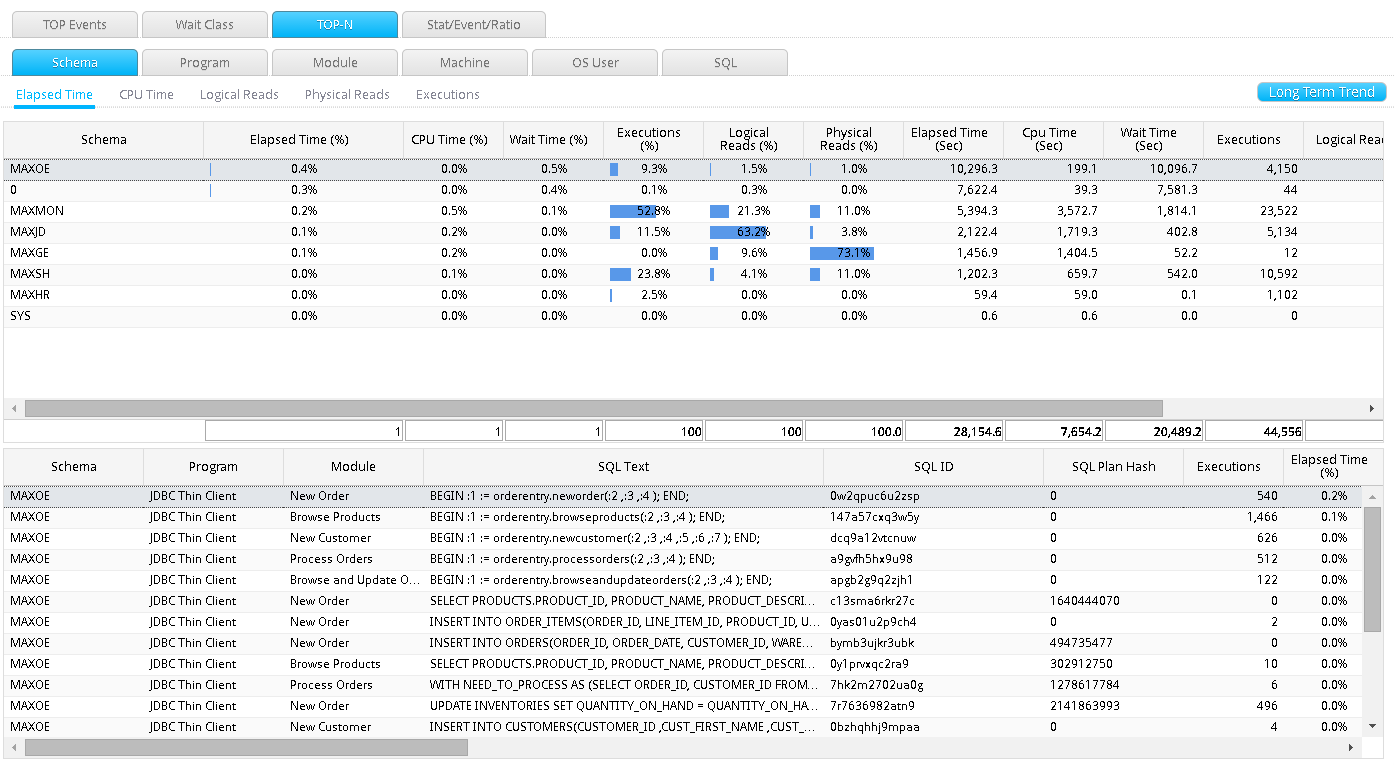
Top-N Area
Provides the Top-N (Schema, Program, Module, and SQL) information of the time selected in the 1-Hour Summary Trend Area. When you open the initial screen, the time at which the Elapsed Time is the highest is automatically selected.
| Operation | Top-N Content |
| Click Elapsed Time (Sec) Indicator Bar | Provides Top-N Information based on Elapsed Time |
| Click CPU(%)Indicator Bar | Provides Top-N Information based on CPU Time |
| Click Logical Reads (blocks) Indicator Bar | Provides Top-N Information based on Logical IO |
| Click Physical Reads (blocks) Indicator Bar | Provides Top-N Information based on Physical IO |
Note. The Top-N Data uses the SQL level’s performance indicator values.
Top-N Grid Column
| Column Name | Description |
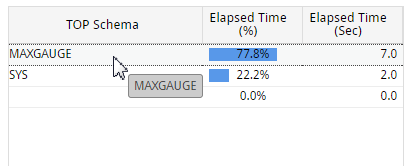
| TOP Schema | Schema Name |
| TOP Program | Program Name |
| TOP Module | Module Name |
| TOP SQL | SQL Text |
| Elapsed Time (%) | The ratio of corresponding item’s Elapsed Time out of the total Elapsed Time of all the SQLs executed during one hour. |
| Elapsed Time (Sec) | The sum of Elapsed Time executed by the corresponding item during one hour. (Sec) |
| CPU Time (%) | The ratio of corresponding item’s CPU Time out of the total CPU Time of all the SQLs executed during one hour. |
| CPU Time (Sec) | The sum of CPU Time used by the corresponding item during one hour. (Sec) |
| Logical Reads (%) | The ratio of corresponding item’s Logical IO out of the total Logical IO of all the SQLs executed during one hour. |
| Logical Reads (blocks) | The sum of Logical IO used by the corresponding item during one hour. (block) |
| Physical Reads (%) | The ratio of corresponding item’s Physical IO out of the total Physical IO of all the SQLs executed during one hour. |
| Physical Reads (blocks) | The sum of Physical IO used by the corresponding item during one hour. (block) |
Top-N Grid UI
When you click the record in the Top-N Grid, the SQL information related to the corresponding item will be displayed in the SQL Info Area.
Note. The basis of grouping of Top SQLs is SQL ID and hence, when you click the corresponding item, the SQL information by Schema/Program/Module/SQL Plan Hash is output in the SQL Info Area.
Top-N Grid Mouse Right-Click Menu
The mouse right-click menu is as follows. For more information, please reference “Appendix. Grid Mouse Right-Click Menu UI”.
| Item | Description |
| Long-Term Trend | Connects to the Long-Term Trend Window for the corresponding Top-N item.
|
| Export Excel | Downloads the grid content on an excel file. |
| Copy(To Clipboard) | Makes a copy of the grid content. |
| Show/ Hide Columns | Selects the columns to be displayed on the grid. |
| Filter On | Enables the Filtering function. |
| Multiple Sort On | Sorts based on 2 or more column values. |
| Save Image | Saves the grid content as an image. |
Note. When connecting to the Long-Term Trend, the analysis period is the last 7 days from the date of analysis.
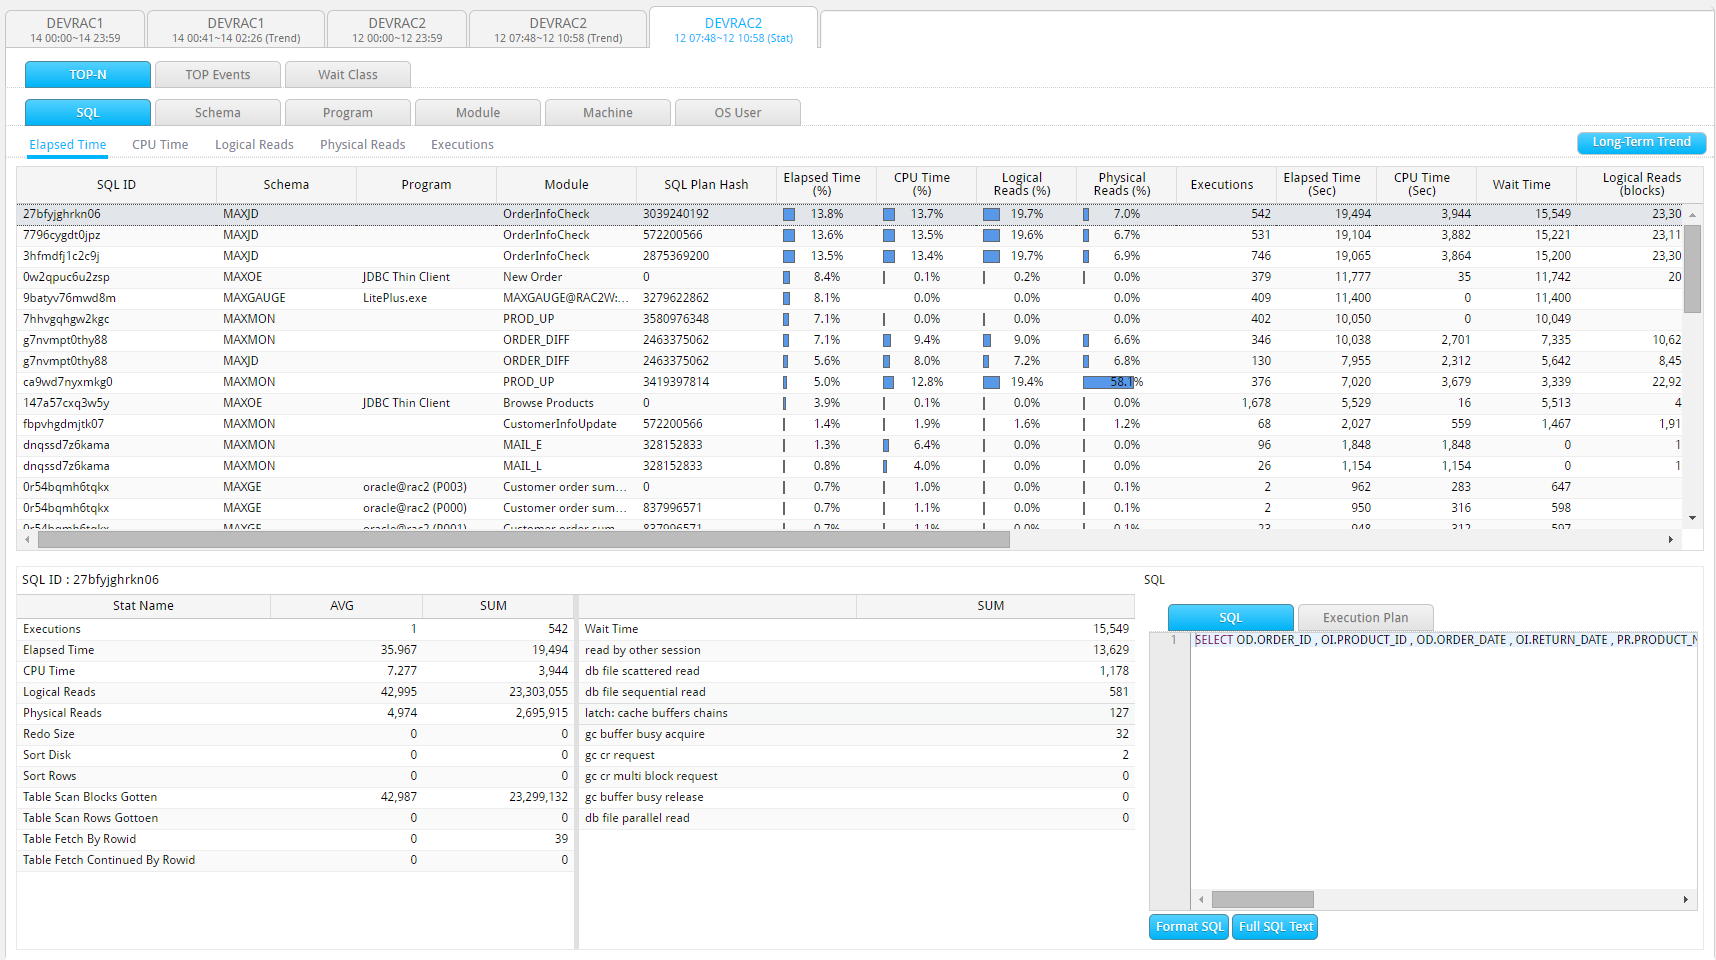
SQL info Grid Column
Provides the SQL information related to the items selected in the Top-N Area.
| Column Name | Description |
| Schema | Schema Name |
| Program | Program Name |
| Module | Module Name |
| Action | Action Name |
| SQL Text | SQL statement |
| SQL ID | Oracle SQL ID |
| SQL Plan Hash | SQL Plan hash |
| Executions | Number of Executions (Sum) |
| Elapsed Time (%) | The ratio of corresponding SQL’s Elapsed Time out of the total Elapsed Time of SQLs executed in the selected Top-N items. |
| CPU Time (%) | The ratio of corresponding SQL’s CPU Time out of the total CPU Time of all the SQLs executed in the selected Top-N items. |
| Elapsed Time (Sec) | The corresponding SQL’s Elapsed Time (Sum) |
| Elapsed Time/exec (Sec) | The corresponding SQL’s Elapsed Time (Average Per Execution) |
| CPU Time (Sec) | The corresponding SQL’s CPU Time (Sum) |
| CPU Time/exec (Sec) | The corresponding SQL’s CPU Time (Average Per Execution) |
| Logical Reads (blocks) | The corresponding SQL’s Memory IO (Sum) |
| Logical Reads/exec (blocks) | The corresponding SQL’s Logical IO (Average Per Execution) |
| Physical Reads (blocks) | The corresponding SQL’s Physical IO (Sum) |
| Physical Reads/exec (blocks) | The corresponding SQL’s Physical IO (Average Per Execution) |
SQL Info Grid Mouse Right-Click Menu
The mouse right-click menu is as follows. For more information, please reference “Appendix. Grid Mouse Right-Click Menu UI”.
| Item | Description |
| SQL Detail | Provides the details of SQL execution history.
|
| Full SQL Text | Provides SQL Full Text. |
| Long-Term Trend | Connects to Long-Term Trend window for the corresponding SQL.
|
| Export Excel | Downloads the grid content on an excel file. |
| Copy(To Clipboard) | Makes a copy of the grid content. |
| Show/ Hide Columns | Selects the columns to be displayed on the grid. |
| Filter On | Enables the Filtering function. |
| Multiple Sort On | Sorts based on 2 or more column values. |
| Save Image | Saves the grid content as an image. |
Note. When connecting to the Long-Term Trend, the analysis period is the last 7 days from the date of analysis.
SUB) Bottleneck Tab Explanation
The Bottleneck Tab’s window configuration is as follows.
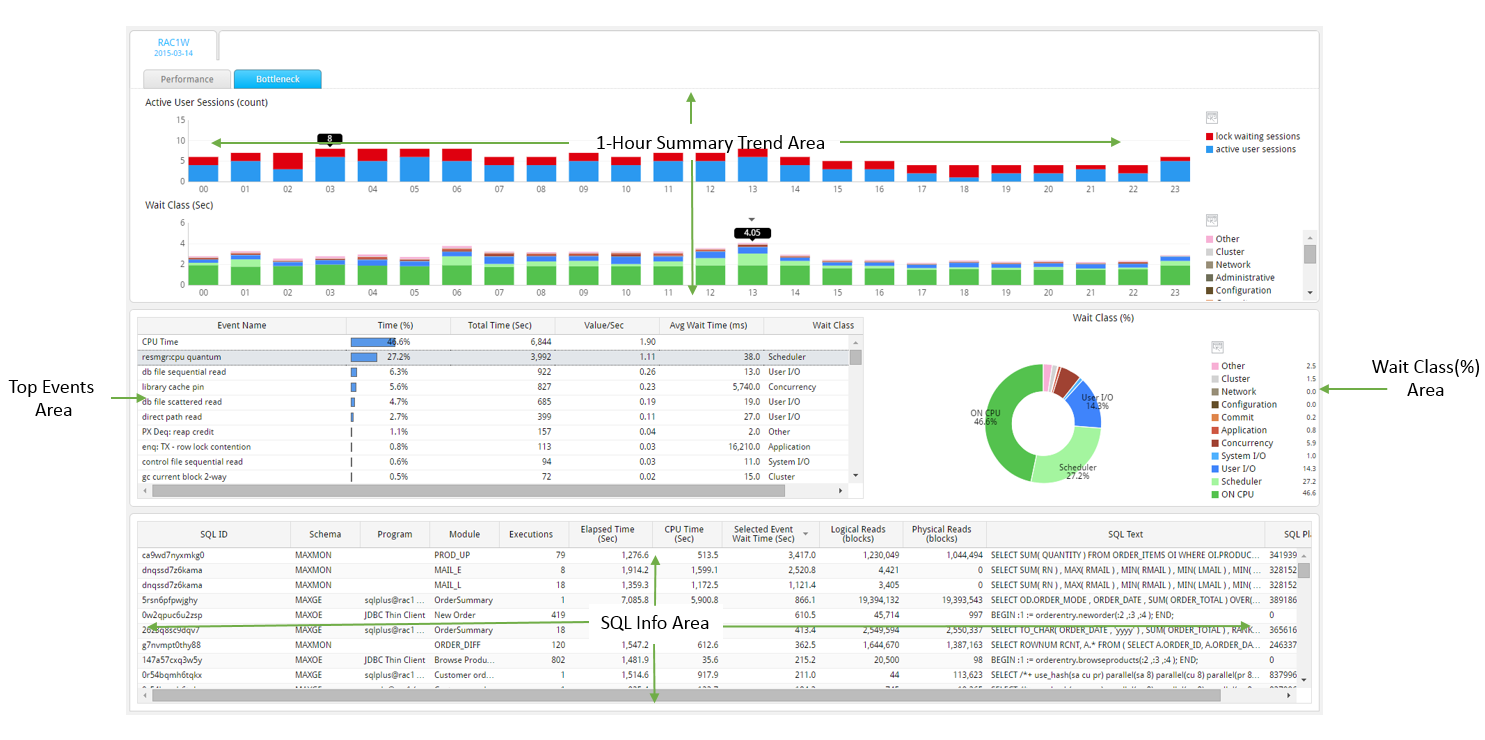
1-Hour Summary Trend Area
The following items are available.
| Indicator Name | Description |
| Active User Session (count) | Provides the hourly average value of Active User Sessions: (Active User Sessions – Lock Waiting Sessions).
Lock Waiting Sessions: Provides the hourly average value of Lock Waiting Sessions. |
| Wait Class (Sec) |
|
Note. The original definition of active user session is the number of active sessions, excluding the oracle background sessions. However, in 1-Hour Summary Trend Area, the Active User Session refers to the number of active user sessions excluding the lock waiting sessions
Provides the Top Events information of the time selected in the 1-Hour Summary Trend Area. When you open the initial screen, the time at which the Active User Session value is the highest is automatically selected.
Top Events Grid Column
| Column Name | Description |
| Event Name | Wait Event Name |
| Wait Time/Sec | Average Wait Time Per Second
|
| Wait Time Avg (ms) | Average Wait Time (Millisecond)
|
| Wait Time (%) | The ratio of corresponding wait event’s wait time out of the total wait time generated during 1 hour. |
| Wait Class | Wait Class Name |
Top Events Grid Mouse Right-Click Menu
The mouse right-click menu is as follows. For more information, please reference “Appendix. Grid Mouse Right-Click Menu UI”.
| Item | Description |
| Long-Term Trend | Connects to Long-Term Trend window for the corresponding wait event.
|
| Export Excel | Downloads the grid content on an excel file. |
| Copy(To Clipboard) | Makes a copy of the grid content. |
| Show/ Hide Columns | Selects the columns to be displayed on the grid. |
| Filter On | Enables the Filtering function. |
| Multiple Sort On | Sorts based on 2 or more column values. |
| Save Image | Saves the grid content as an image. |
Wait Class(%) Area
Provides the wait time and ratio (%) of the time selected in the 1-Hour Summary Trend Area.
SQL Info Area
Provides the SQL information which applies to the items selected in the Top Event Area. In other words, you can check the SQLs which waited on the corresponding wait event.
Note. For items whose Event Name column value is “CPU Time”, the SQL information is not provided.
SQL Info Area Grid Column
| Column Name | Description |
| Schema | Schema Name |
| Program | Program Name |
| Module | Module Name |
| Executions | The number of Executions (Sum) |
| Elapsed Time (Sec) | The corresponding SQL’s Elapsed Time (Sum) |
| CPU Time (Sec) | The corresponding SQL’s CPU Time (Sum) |
| Selected Event Wait Time (Sec) | The time waited for the wait event selected in the Top Wait Area. (Sum) |
| Logical Reads (blocks) | The corresponding SQL’s Memory IO (Sum) |
| Physical Reads (blocks) | The corresponding SQL’s Physical IO (Sum) |
| SQL Text | SQL statement |
| SQL ID | Oracle SQL ID |
| SQL Plan Hash | SQL Plan hash |
SQL Info Area Mouse Right-Click Menu
The mouse right-click menu is as follows. For more information, please reference “Appendix. Grid Mouse Right-Click Menu UI”.
| Item | Description |
| SQL Detail | Provides the details of SQL execution history.
|
| Full SQL Text | Provides SQL Full Text. |
| Long-Term Trend | Connects to Long-Term Trend window for the corresponding SQL.
|
| Export Excel | Downloads the grid content on an excel file. |
| Copy(To Clipboard) | Makes a copy of the grid content. |
| Show/ Hide Columns | Selects the columns to be displayed on the grid. |
| Filter On | Enables the Filtering function. |
| Multiple Sort On | Sorts based on 2 or more column values. |
| Save Image | Saves the grid content as an image. |
Note. When connecting to the Long-Term Trend, the analysis period is the last 7 days from the date of analysis.
SUB) OS User Tab Explanation
The OS User Tab provides the SQL performance information grouped according to the OS User Name. When you click on the OS User Name in the Top-N Area, the information of SQL executed in the corresponding OS User will be displayed in the SQL Info Area.
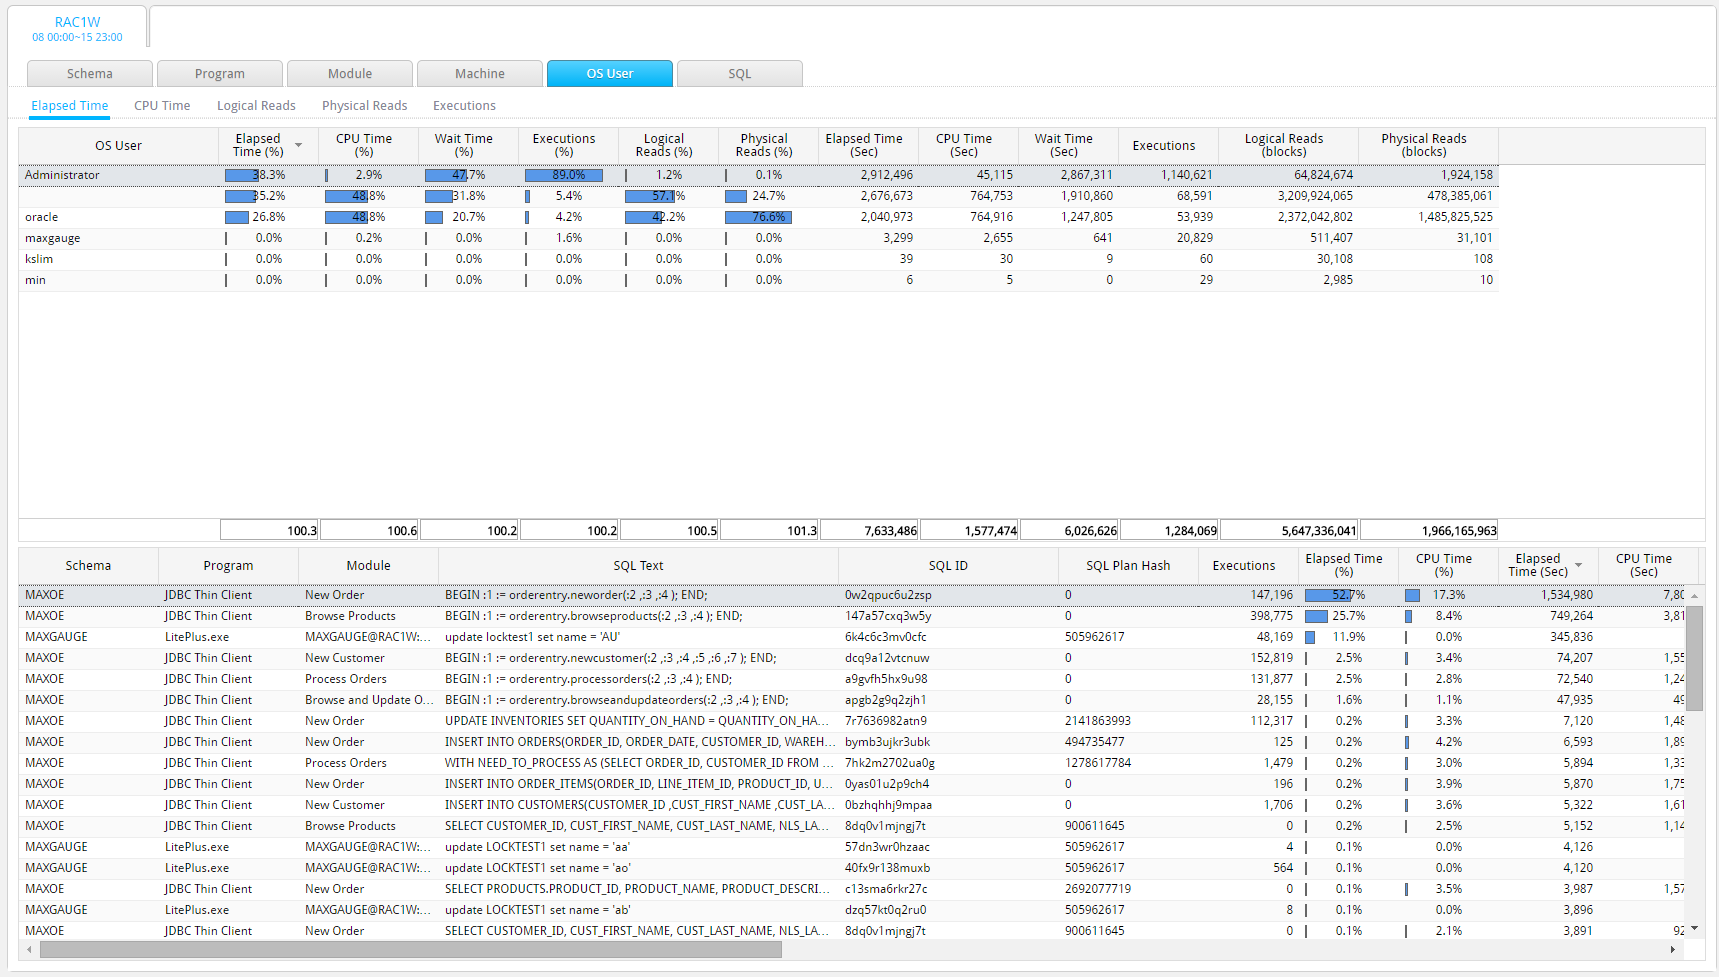
Long-Term Trend Connection
Does not support Long-Term Trend connection.
Top-N Area Grid Column
Except the OS User Column, the other remaining columns are the same as the Schema Tab.
Top-N Grid Mouse Right-Click Menu
Out of all the items in the Schema Tab, the “Long-Term Trend” item is excluded in this tab.
SQL info Grid Column
Same as the Schema Tab.
SQL Info Grid Mouse Right-Click Menu
Same as the Schema Tab.
SUB) SQL Tab Explanation
The SQL Tab provides the SQL performance information grouped according to the Oracle SQL ID.
Long-Term Trend Connection
Except the fact that you are connecting to Oracle SQL ID instead of Schema, it operates in the same way as the Schema Tab.
Top-N Grid Column
Top-N Area is not available in this tab; only the SQL Info Area is provided.
SQL info Grid Column
Same as the Schema Tab.
SQL Info Grid Mouse Right-Click Menu
Same as the Schema Tab.
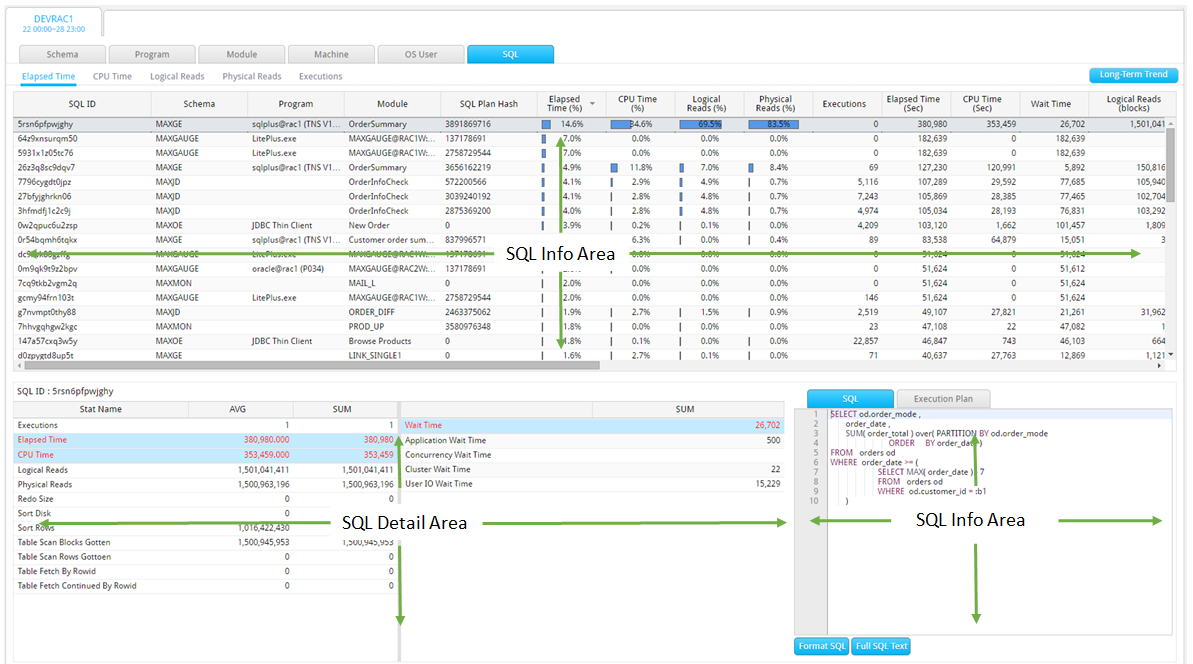
SQL Detail Area
Provides individual SQL information. Provides workload information (SUM, Average Per 1 Execution) and the elapsed time information (elapsed time and wait time by wait class) of the SQL clicked on in the SQL Info Grid.
SQL Info
Provides the corresponding SQL Text and the Exeuction Plan information.
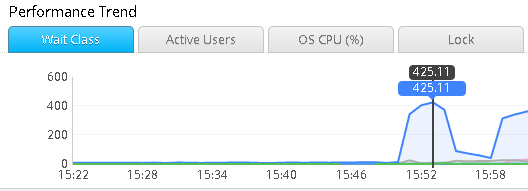
Performance Trend
SUB) Overview
Provides a function for a detailed error analysis. The main functions are as follows.
- A function for the analysis of trends of performance indicators, wait events, and wait classes provided by the Oracle.
- A function for the analysis of Active Sessions taken once per second
- A function for the analysis of Active Sessions’ 1 minute statistics
- A function for the analysis of Top O/S processes taken every minute
- A function for the analysis of Lock Tree
- A function for a the analysis of PQ Tree
- A function for a the analysis of Peak Period Statistics
SUB) Initial Window Configuration
The window configuration is as follows.
SUB) Search Condition
| Search Condition | Description |
| |
Selects the target instance for analysis. For searching convenience, autocomplete function is available. |
| |
Sets the analysis date for yesterday. (Default Value) |
| |
Sets the analysis date for today. |
| |
You can either enter the analysis date, or select the date from the calendar UI.
|
|
|
Set the unit for the graph in the Performance Trend Area.
|
Note. The purpose of Performance Trend window is to closely analyze the peak period once the peak time within the analysis period has been confirmed. Therefore, it is desirable to set the unit (minute) to 10. If the unit (minute) is set to 1, then it may allow you to check the trends by every 1 minute, however, the browsing speed will be much slower than when it is set to 10 minute.
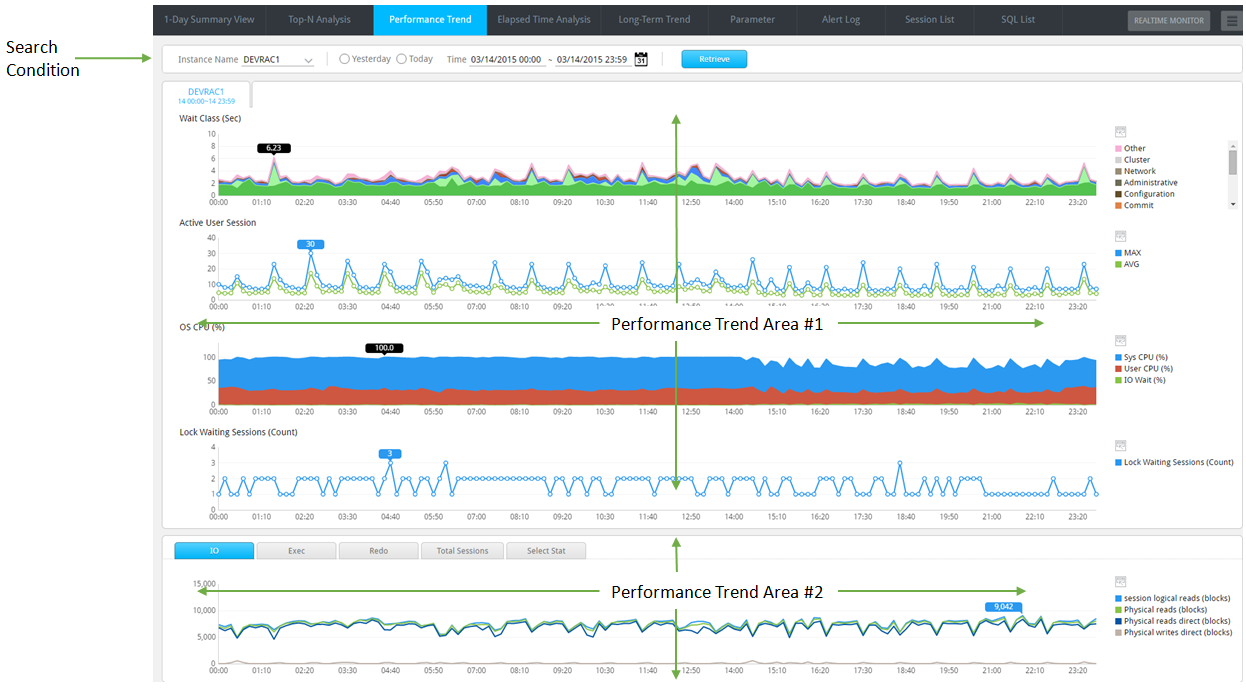
SUB) Performance Trend Area #1
Provides performance trends of the following 4 performance indicators.
| Indicator Name | Description |
| Wait Class (Sec) |
|
| Active User Session (count) | Provides the AVG/MAX value of the Active user session performance indicators.
|
| OS CPU (%) | Provides the trends of User CPU (%), Sys CPU (%), and IO Wait (%). |
| Lock Waiting Sessions (Count) | Provides the trends of the number of Lock Wait Sessions. |
SUB) Performance Trend Area #2
Provides 5 tabs.
IO Tab
The IO Tab window is as follows.
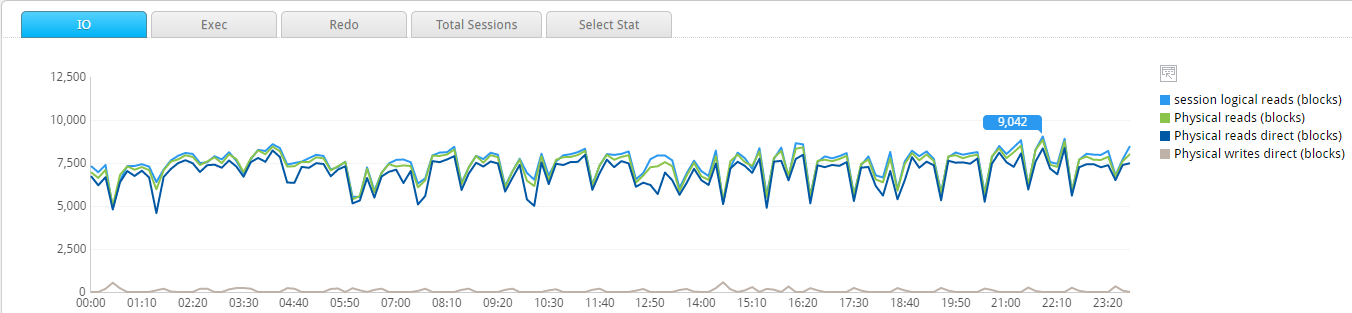
The IO Tab provides the trends of 4 performance indicators.
- session logical reads
- physical reads
- physical reads direct
- physical write direct
Exec Tab
The Exec Tab window is as follows.
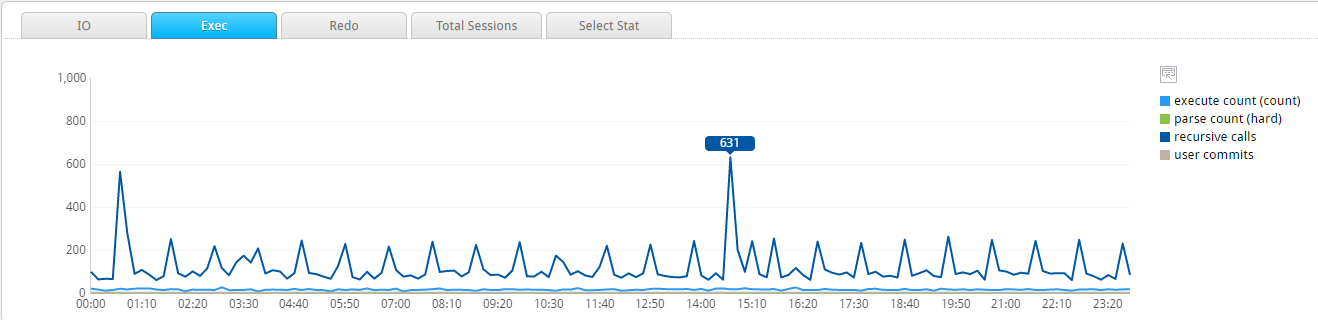
The Exec Tab provides the trends of 4 performance indicators.
- execute count
- parse count (hard)
- recursive calls
- user commits
Redo Tab
The Redo Tab window is as follows.
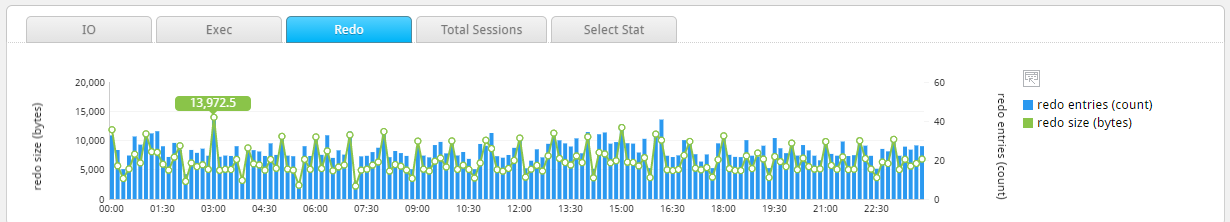
The Redo Tab provides the trends of 2 performance indicators.
- redo entries (count)
- redo size (bytes)
Note. For more information about the performance indicators provided by the IO / Exec / Redo Tab, please reference the oracle manual. http://docs.oracle.com/cd/E11882_01/server.112/e40402/stats002.htm#i375475
Total Sessions Tab
The Total Sessions Tab window is as follows.
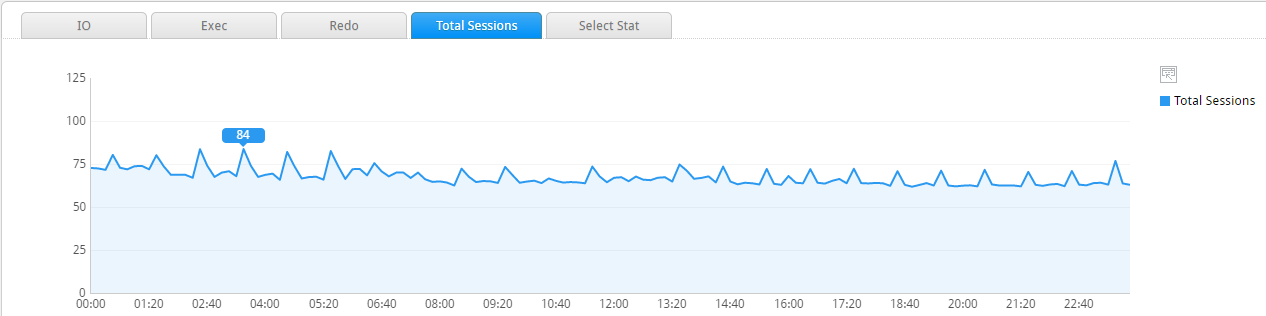
Note. The Total Sessions is a performance indicator provided by MaxGauge and it refers to the total number of sessions logged into the instance.
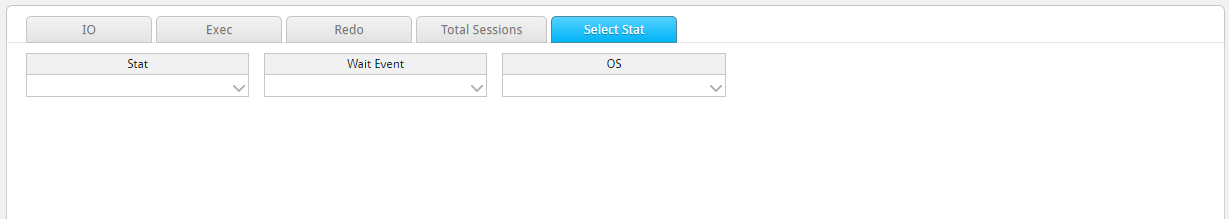
Select Stat Tab
Provides the function which allows the user to choose the desired indicator among the Oracle performance indicators, wait events, and OS Stats.
SUB) Detailed Analysis Connection Method
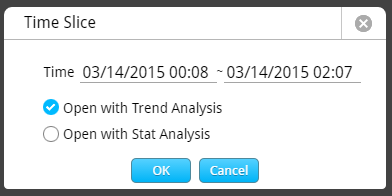
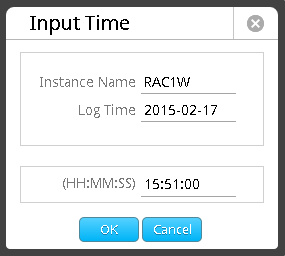
- Select the peak period in the Performance Trend Area(#1, #2) by draggin the mouse over the target area.
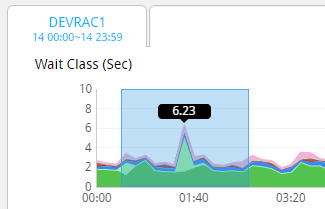
- You can reset the analysis period in the Time Slice window as shown below or click the “OK” button.
SUB) Detailed Analysis Initial Window
The detailed analysis initial window is as follows.
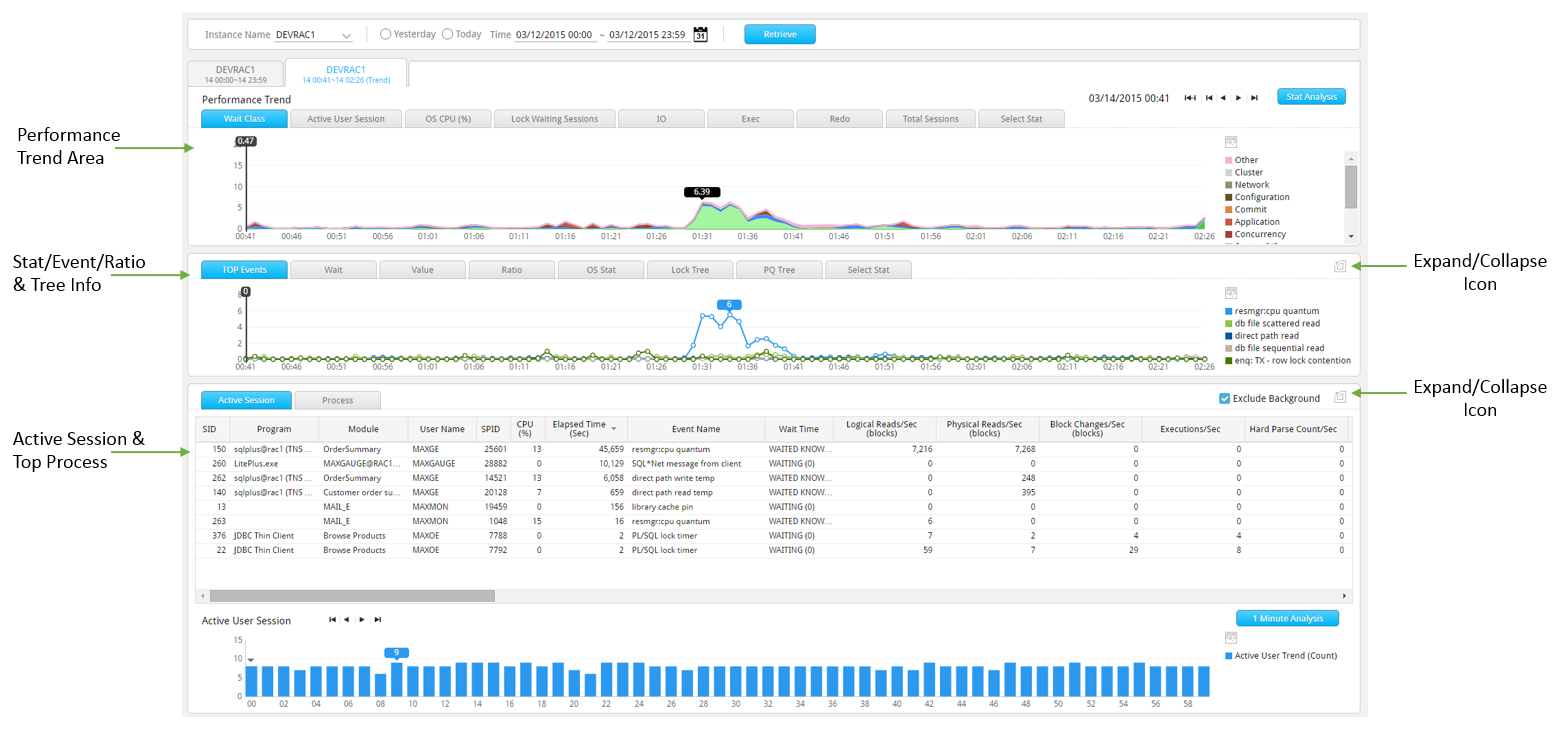
SUB) Performance Trend Area
Provides the trends of performance indicators provided in the initial window’s Performance Trend Area #1 and #2.
Note. Provides graphs in 1 minute unit.
SUB) Stat/Event/Ratio & Tree Info
Provides various performance informantion through the following 8 Tabs.
Top Events Tab
The Top Events Tab window is as follows.
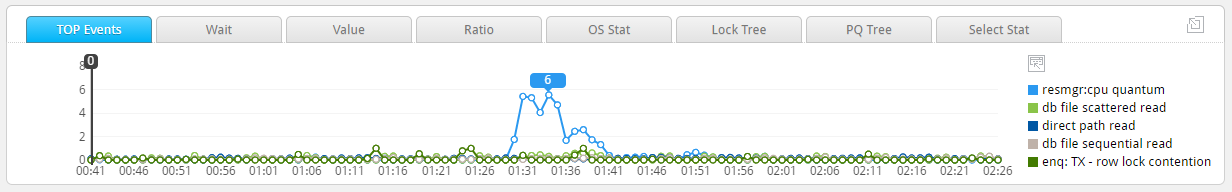
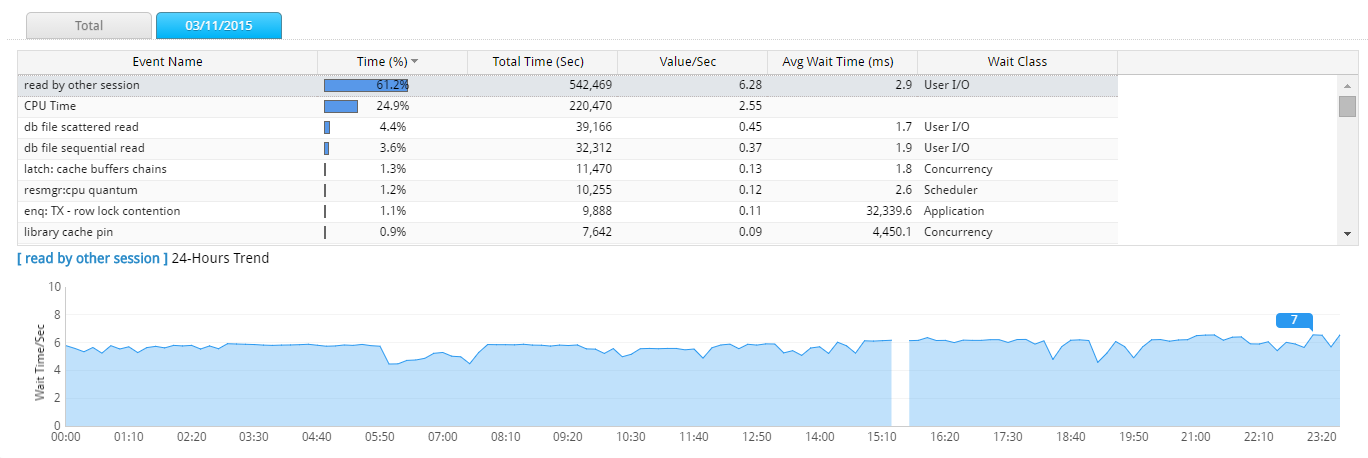
Provides the trends graph of the Top-5 wait events based on the wait time, out of all the wait events generated within the analysis period.
Note. The corresponding graph helps to easily identify the order in which the Top-5 wait events were generated.
Wait Tab
The Wait Tab window is as follows.
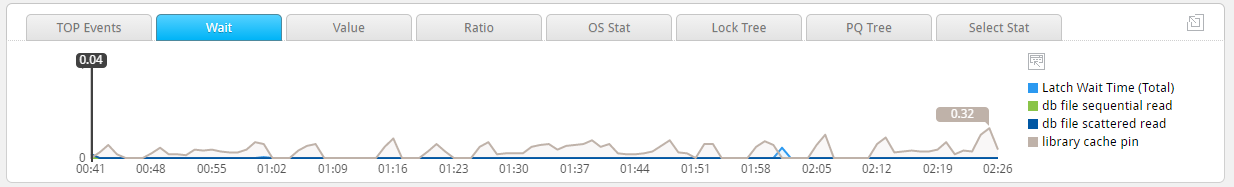
The Wait Tab provides the trends of 4 wait events.
- Latch Wait Time
- db file sequential read
- db file scattered read
- library cache pin
Note1. The Latch Wait Time is an indicator provided by MaxGauge and it refers to the sum of wait time of all the wait events starting with a “latch”.
Note2. For more information about the remaining 3 wait events, please reference the oracle manual. https://docs.oracle.com/cd/B28359_01/server.111/b28320/waitevents003.htm#BGGIBDJI
Value Tab
The Value Tab window is as follows.
Value Tab Grid Column
| Column Name | Description |
| Stat Name | Performance Indicator Name |
| Value/Sec | The average generated value per second
|
| Delta | The generated value in 1 minute
|
| Event Name | Wait Event Name |
| Wait Time/Sec | The average wait time per second |
| Wait Time Delta (Sec) | The wait time in minute |
| Waits/Sec | The average number of waits generated per second |
| Waits Delta (Sec) | The number of waits generated in 1 minute |
| Timeouts/Sec | The average number of timeouts generated per second |
| Timeouts Delta (Sec) | The number of timeouts generated in 1 minute |
Value Tab Grid Mouse Right-Click Menu
The mouse right-click menu is as follows. For more information, please reference “Appendix. Grid Mouse Right-Click Menu UI”.
| Item | Description |
| Export Excel | Downloads the grid content on an excel file. |
| Copy(To Clipboard) | Makes a copy of the grid content. |
| Show/ Hide Columns | Selects the columns to be displayed on the grid. |
| Filter On | Enables the Filtering function. |
| Multiple Sort On | Sorts based on 2 or more column values. |
| Save Image | Saves the grid content as an image. |
Ratio Tab
The Ratio Tab window is as follows.
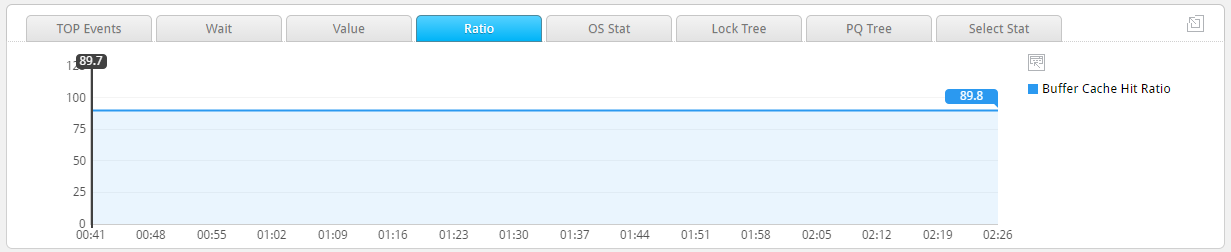
The Ratio Tab provides the trends of Buffer Cache Hit Ratio.
OS Stat Tab
The OS Stat Tab window is as follows.
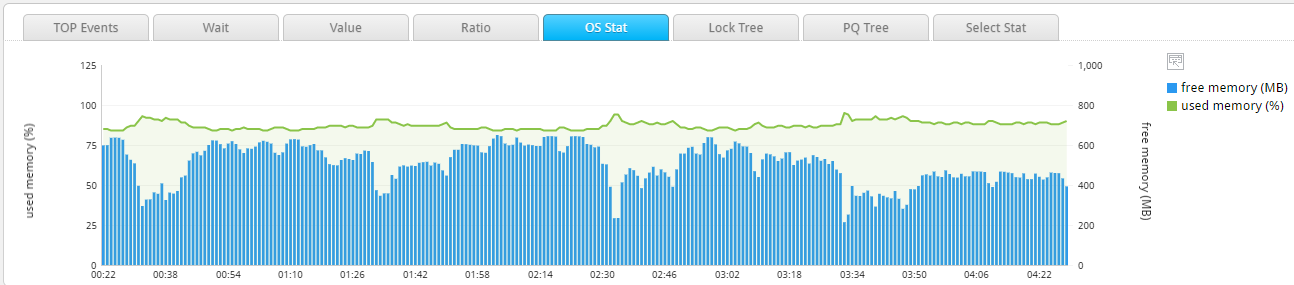
The OS Stat Tab provides information related to memory.
- Free Memory (MB)
- Used Memory (%)
Lock Tree Tab
The Lock Tree Tab window is as follows.
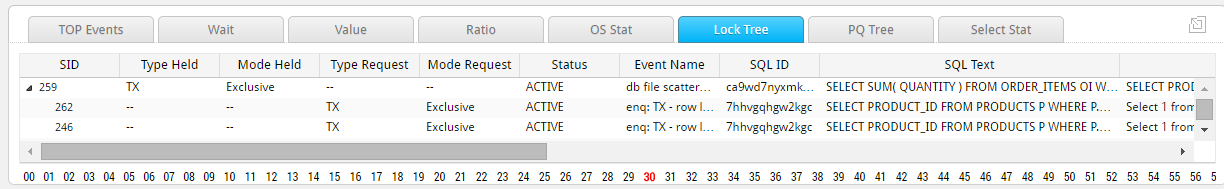
The Lock Tree displays the relationship between the lock holder session and the waiter session in a tree structure. Through the Lock Tree, you can easily analyze not only the lock waits generated in a single instance, but also the lock waits generated in the RAC environment as well.
Note. In order to analyze the global lock in a RAC environment, you must first set up the RAC Group. For information about setting up the RAC Group, please reference “MaxGauge Configuration Manual”.
Lock Tree Grid Column
| Column Name | Description |
| SID | Session identifier |
| Instance Name | Instance Name
|
| Type Held | Lock held type of the session holding the Lock |
| Mode Held | Lock held mode of the session holding |
| Type Requested | Lock held type of the session requesting the Lock |
| Mode Requested | Lock held mode of the session requesting the Lock |
| Status | Session Status |
| Event Name | Name of the wait event currently waiting |
| SQL ID | Oracle SQL ID |
| SQL Text | SQL statement |
| Prev SQL Text | Previous SQL statement |
| Elapsed Time (Sec) | Time elapsed from the start of SQL execution until now |
| Client Identifier | Client Identifier |
| Program | Program Name |
| Module | Module Name
|
| Action | Action Name
|
| Schema | Schema Name |
| Machine | Machine Name |
| OS User | OS User Name |
| Logon Time | Session Login Time |
| Serial | Session Serial Number |
Lock Tree Grid Mouse Right-Click Menu
The mouse right-click menu is as follows. For more information, please reference “Appendix. Grid Mouse Right-Click Menu UI”.
| Item | Description |
| Session Detail | Provides the details of session history.
For more information, please reference “Chapter 7. Session Detail Window” section. |
| Session List | Connects to the Session List Window by using the corresponding session’s Instance Name, SID. |
| Long-Term Trend | Connects to Long-Term Trend window for the corresponding SQL.
|
| SQL Detail | Provides the details of SQL execution history.
|
| Full SQL Text | Provides SQL Full Text. |
| Prev SQL Text | Provides the Previous SQL Full Text. |
| Export Excel | Downloads the grid content on an excel file. |
| Copy(To Clipboard) | Makes a copy of the grid content. |
| Show/ Hide Columns | Selects the columns to be displayed on the grid. |
| Expand All | Shows the expanded entire tree structure. (Parent and Child Output) |
| Collapse All | Shows the collapsed tree structure. (Only Parent Output) |
| Row Expand | Only expands the corresponding row in the Collapsed All state. |
| Row Collapse | Only collapses the corresponding row in the Expand All state. |
| Save Image | Saves the grid content as an image. |
Note. When connecting to the Long-Term Trend, the analysis period is the last 7 days from the date of analysis.
Lock Tree Time Shift
Move to the desired time point by using the Time Bar which is marked by every second, located at the bottom of the screen.
| Color | Description |
| Red | Time Selected |
| Black | Time in which the Lock Wait Sessions exist. |
| Grey | Time in which the Lock Wait Sessions do not exist. |
PQ Tree Tab
The PQ Tree Tab is as follows.
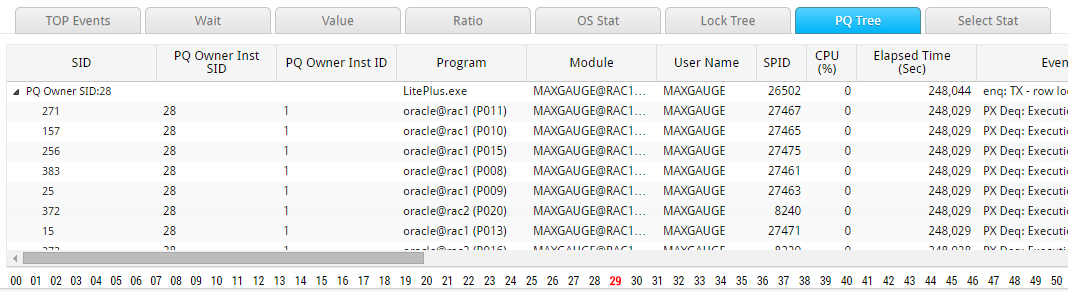
The PQ Tree displays the relationship between the coordinator session and the slave sessions in a tree structure. Through this, you can easily analyze the parallel query’s execution history and performance issues.
PQ Tree Grid Column
| Column Name | Description |
| SID | Session identifier |
| PQ Owner Inst ID | PQ coordinator session’s Instance ID |
| Program | Program |
| Module | Module Name
|
| User Name | Oracle User Name |
| SPID | Server Process ID |
| CPU (%) | CPU Usage (%) |
| Elapsed Time (Sec) | Time elapsed from the start of SQL execution until now |
| Event Name | The name of event name currently waiting |
| Logical Reads/Sec (blocks) | Memory I/O Blocks Count (Value/sec) |
| Physical Reads/Sec (blocks) | Disk I/O Blocks Count (Value/sec) |
| Block Changes/Sec (blocks) | Changed Blocks Count (Value/sec) |
| Executions/Sec | SQL Text Execution Count (Value/sec) |
| Hard Parse Count/Sec | Hard parsing Count (Values/sec) |
| Parse Count Total/Sec | Parsing Count (Value/sec) |
| Open Cursors | Number of cursors currently open (Current value) |
| Undo Blocks | Number of Undo Blocks used during the transaction. (Value/Sec) |
| Undo Records | Number of Undo Record generated during the transaction (Value/Sec) |
| Undo Seg.ID | Undo Segment ID being used by the transaction |
| PGA (MB) | Size of PGA currently in use |
| Machine | Machine Name |
| Process MEM (MB) | Process’ Physical Memory Size |
| SQL Text | SQL Text currently being executed |
| Prev SQL Text | Previous SQL Text |
| SQL ID | Oracle SQL ID |
| Prev SQL ID | Oracle Previous SQL ID |
| Status | Session Status |
| P1 | Indicates the P1 value of the wait event. |
| P2 | Indicates the P2 value of the wait event. |
| P3 | Indicates the P3 value of the wait event. |
| Wait SEQ | Indicates the value equivalent to V$SESSION_WAIT.SEQ# column. |
| Wait Time | Indicates the value equivalent to V$SESSION_WAIT.WAIT_TIME column. |
| Seconds In Wait | Indicates the value equivalent to V$SESSION_WAIT.SECONDS_IN_WAIT column. |
| Action | Action Name |
| Client Identifier | Client Identifier |
| Client Info | Displays the information that it has been set as DBMS_APPLICATION_INFO.SET_CLIENT_INFO procedure. |
| Row Wait File | Indicates the value equivalent to V$SESSION.ROW_WAIT_FILE#. |
| Row Wait Obj | Indicates the value equivalent to V$SESSION.ROW_WAIT_OBJ#. |
| Row Wait Block | Indicates the value equivalent to V$SESSION.ROW_WAIT_BLOCK#. |
| SQL Plan Hash | Plan hash Value |
| Command Type | SQL Type (SELECT, INSERT, DELETE, UPDATE, CREATE, and etc.) |
| Schema | Schema Name |
| Logon Time | Session Login Time |
| Session Type | Session Type (USER, BACKGROUND, and etc.) |
| Logical Reads (Sigma) | Memory I/O Blocks Count (Cumulative Value) |
| Physical Reads (Sigma) | Disk I/O Blocks Count (Cumulative Value) |
| Block Changes (Sigma) | Changed Blocks Count (Cumulative Value) |
| Executions (Sigma) | SQL Text Execution Count (Cumulative Value) |
| Hard Parse Count (Sigma) | Hard parsing Count (Cumulative Value) |
| Parse Count Total (Sigma) | Parsing Count (Cumulative Value) |
| SQL Address | SQL Text Address Value |
| OS User | OS User Name |
| Serial | Session Serial Number |
| CPID | Client Process ID |
PQ Tree Grid Mouse Right-Click Menu
The mouse right-click menu is as follows. For more information, please reference “Appendix. Grid Mouse Right-Click Menu UI”.
| Item | Description |
| Session Detail | Provides the details of session history.
For more information, please reference “Chapter 7. Session Detail Window” section. |
| Session List | Connects to the Session List Window by using the corresponding session’s Instance Name, SID. |
| Long-Term Trend | Connects to Long-Term Trend window for the corresponding SQL.
|
| SQL Detail | Provides the details of SQL execution history.
|
| Full SQL Text | Provides SQL Full Text. |
| Prev SQL Text | Provides the Previous SQL Full Text. |
| Export Excel | Downloads the grid content on an excel file. |
| Copy(To Clipboard) | Makes a copy of the grid content. |
| Show/ Hide Columns | Selects the columns to be displayed on the grid. |
| Expand All | Shows the expanded entire tree structure. (Parent and Child Output) |
| Collapse All | Shows the collapsed tree structure. (Only Parent Output) |
| Row Expand | Only expands the corresponding row in the Collapsed All state. |
| Row Collapse | Only collapses the corresponding row in the Expand All state. |
| Save Image | Saves the grid content as an image. |
Note. When connecting to the Long-Term Trend, the analysis period is the last 7 days from the date of analysis.
PQ Tree Time Shift
Move to the desired time point by using the Time Bar which is marked by every second, located at the bottom of the screen.
![]()
| Color | Description |
| Red | Time Selected |
| Black | Time in which the PQ Slave Sessions exist. |
| Grey | Time in which the PQ Slave Sessions do not exist. |
SUB) Active Session & Top Process
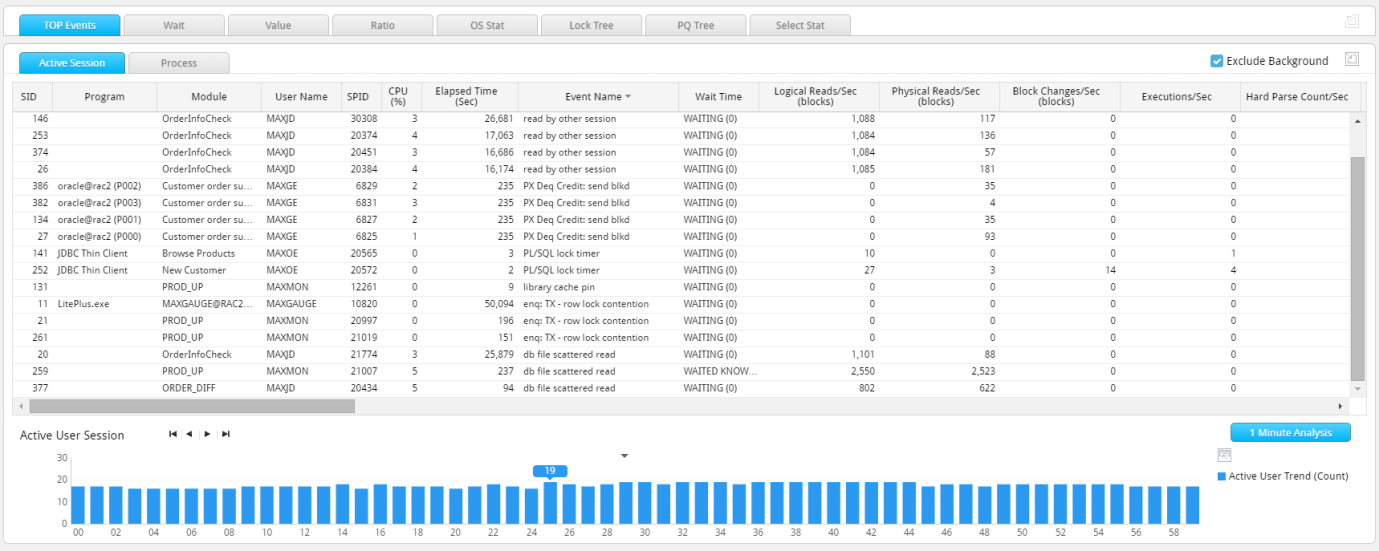
Provides the active session information taken once per second and the Top-N process information taken for every minute.
Active Session Tab
The Active Session Tab window is as follows.
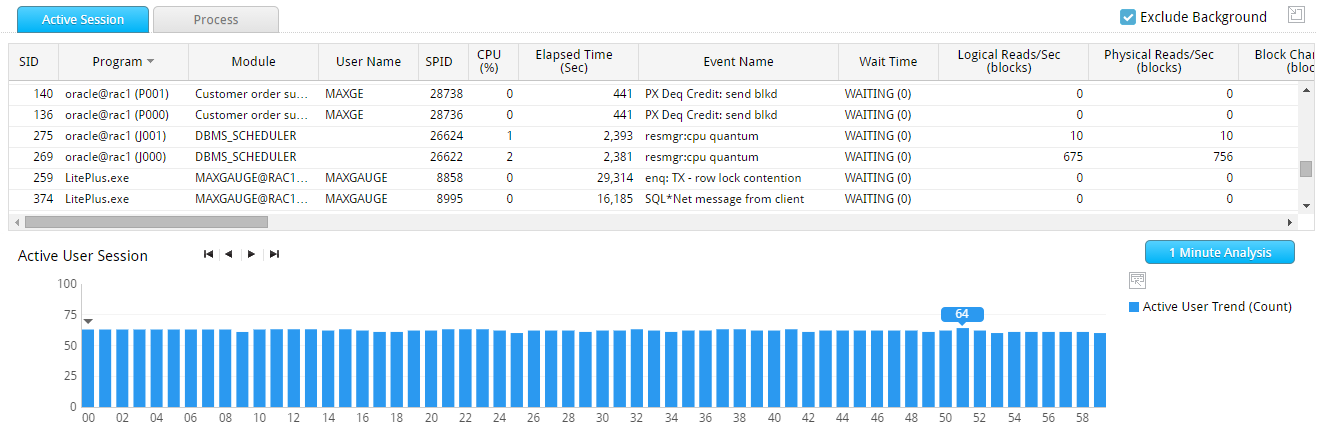
Active User Session Trend (Count)
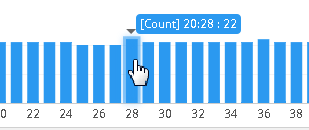
Provides the trends of Active User Session indicator by every second in a bar graph. By clicking on the bar graph or using the time navigation, you can check the session information of the desired target “second” time point which you want to analyze.
Active Session Grid Column
Provides the active session information taken once per second.
| Column Name | Description |
| SID | Session identifier |
| Program | Program |
| Module | Module Name
|
| User Name | Oracle User Name |
| SPID | Server Process ID |
| CPU (%) | CPU Usage (%) |
| Elapsed Time (Sec) | Time elapsed from the start of SQL execution until now |
| Event Name | The name of event name currently waiting |
| Logical Reads/Sec (blocks) | Memory I/O Blocks Count (Value/sec) |
| Physical Reads/Sec (blocks) | Disk I/O Blocks Count (Value/sec) |
| Block Changes/Sec (blocks) | Changed Blocks Count (Value/sec) |
| Executions/Sec | SQL Text Execution Count (Value/sec) |
| Hard Parse Count/Sec | Hard parsing Count (Value/sec) |
| Parse Count Total/Sec | Parsing Count (Value/sec) |
| Open Cursors | Number of cursors currently open (Current value) |
| Undo Blocks | Number of Undo Blocks used during the transaction. (Value/Sec) |
| Undo Records | Number of Undo Record generated during the transaction (Value/Sec) |
| Undo Seg.ID | Undo Segment ID being used by the transaction |
| PGA (MB) | Size of PGA currently in use |
| Machine | Machine Name |
| Process MEM (MB) | Process’ Physical Memory Size |
| SQL Text | SQL Text currently being executed |
| Prev SQL Text | Previous SQL Text |
| SQL ID | Oracle SQL ID |
| Prev SQL ID | Oracle Previous SQL ID |
| Status | Session Status |
| P1 | Indicates the P1 value of the wait event. |
| P2 | Indicates the P2 value of the wait event. |
| P3 | Indicates the P3 value of the wait event. |
| Wait SEQ | Indicates the value equivalent to V$SESSION_WAIT.SEQ# column. |
| Wait Time | Indicates the value equivalent to V$SESSION_WAIT.WAIT_TIME column. |
| Seconds In Wait | Indicates the value equivalent to V$SESSION_WAIT.SECONDS_IN_WAIT column. |
| Action | Action Name |
| Client Identifier | Client Identifier |
| Client Info | Displays the information that it has been set as DBMS_APPLICATION_INFO.SET_CLIENT_INFO procedure. |
| PQ Owner Inst ID | PQ coordinator session’s Instance ID |
| PQ Onwer Inst SID | PQ coordinator SID |
| Row Wait File | Indicates the value equivalent to V$SESSION.ROW_WAIT_FILE#. |
| Row Wait Obj | Indicates the value equivalent to V$SESSION.ROW_WAIT_OBJ#. |
| Row Wait Block | Indicates the value equivalent to V$SESSION.ROW_WAIT_BLOCK#. |
| SQL Plan Hash | Plan hash Value |
| Command Type | SQL Type (SELECT, INSERT, DELETE, UPDATE, CREATE, and etc.) |
| Schema | Schema Name |
| Logon Time | Session Login Time |
| Session Type | Session Type (USER, BACKGROUND, and etc.) |
| Logical Reads (Sigma) | Number of Memory I/O Blocks (Cumulative Value) |
| Physical Reads (Sigma) | Number of Disk I/O Blocks (Cumulative Value) |
| Block Changes (Sigma) | Number of Changed Blocks (Cumulative Value) |
| Executions (Sigma) | SQL Text Execution Count (Cumulative Value) |
| Hard Parse Count (Sigma) | Hard parsing Count (Cumulative Value) |
| Parse Count Total (Sigma) | Parsing Count (Cumulative Value) |
| SQL Address | SQL Text Address Value |
| OS User | OS User Name |
| Serial | Session Serial Number |
| CPID | Client Process ID |
Active Session Grid Mouse Right-Click Menu
The mouse right-click menu is as follows. For more information, please reference “Appendix. Grid Mouse Right-Click Menu UI”.
| Item | Description |
| Session Detail | Provides the details of session history.
For more information, please reference “Chapter 7. Session Detail Window” section. |
| Session List | Connects to the Session List Window by using the corresponding session’s Instance Name, SID. |
| Long-Term Trend | Connects to Long-Term Trend window for the corresponding SQL.
|
| SQL Detail | Provides the details of SQL execution history.
|
| Full SQL Text | Provides SQL Full Text. |
| Prev SQL Text | Provides the Previous SQL Full Text. |
| Export Excel | Downloads the grid content on an excel file. |
| Copy(To Clipboard) | Makes a copy of the grid content. |
| Show/ Hide Columns | Selects the columns to be displayed on the grid. |
| Filter On | Enables the Filtering function. |
| Multiple Sort On | Sorts based on 2 or more column values. |
| Save Image | Saves the grid content as an image. |
Note. When connecting to the Long-Term Trend, the analysis period is the last 7 days from the date of analysis.
Process Tab
The Process Tab window is as follows.
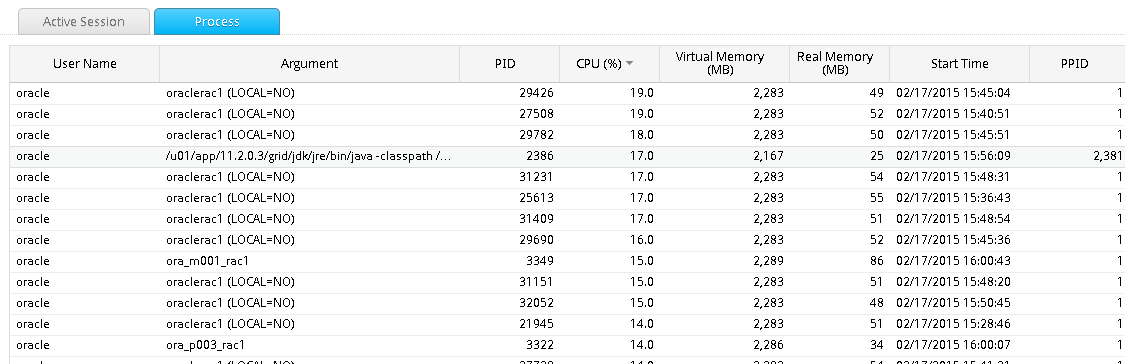
Process Grid Column
Provides a list of Top-20 processes based on CPU Usage and Memory Size, every 1 minute.
| Column Name | Description |
| User Name | OS User Name |
| Argument | OS Process Name and Argument |
| PID | Process ID |
| CPU (%) | CPU Usage |
| Virtual Memory (MB) | Virtual Memory Usage Size |
| Real Memory (MB) | Physical Memory Usage Size |
| Start Time | Process Start Time |
| PPID | Parent Process ID |
Note. Once the Top-20 processes have been retrieved based on 2 criteria, any duplicates are deleted and hence, the total number of processes may be less than 40.
Process Grid Mouse Right-Click Menu
The mouse right-click menu is as follows. For more information, please reference “Appendix. Grid Mouse Right-Click Menu UI”.
| Item | Description |
| Export Excel | Downloads the grid content on an excel file. |
| Copy(To Clipboard) | Makes a copy of the grid content. |
| Show/ Hide Columns | Selects the columns to be displayed on the grid. |
| Filter On | Enables the Filtering function. |
| Multiple Sort On | Sorts based on 2 or more column values. |
| Save Image | Saves the grid content as an image. |
SUB) Analysis Time Shift Method
Provides time shift by minute and by second.
Shift by Minute Method
Use the Time Navigation located at the top of the Performance Trend Area.
| Item | Description |
| |
Enter the time which you want to analyze.
|
| Shifts to the start time of the analysis period. | |
| |
Shifts to previous 1 minute from the current time. |
| |
Shifts to 1 minute after from the current time. |
| |
Shifts to the end time of the analysis period. |
Double-Click on Trends Graph in the Performance Trend Area and Stat/Event/Ratio & Tree Info Area
When you double-click on the desired time, it shifts to the corresponding time point.
Note. When you execute a shift by minute, the Active Session & Process Area, Lock Tree, and PQ Tree provide the session information at 0 second of the corresponding minute.
Shift by Second Method
Use the time navigation in the Active User Session Trend (Count).
| Item | Description |
| |
Shifts to 0 second. |
| |
Shifts to previous 1 second from the current time. |
| |
Shifts to 1 second after from the current time. |
| |
Shifts to 59 second time point. |
Use the bar in the Active User Session Trend (Count).
Click on the desired time point bar which you want to analyze.
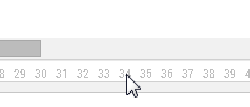
Use the 60 Seconds Time Frame in the Lock Tree and PQ Tree.
Click on the desired time point “second” which you want to analyze.
Note. When you execute a shift by second, the Active Session & Process Area, Lock Tree, and PQ Tree provide the session information of the corresponding second.
SUB) Window Expand/Collapse Function
Provides the Expand/Collapse function for Stat/Event/Ratio & Tree Info Area and Active Session & Top Process Area, in case there are many sessions within the Lock Tree, PQ Tree or the Active Sessoin Grid.
| Item | Description |
| |
Collapses the area. |
| |
Restores collapsed area to the original state. |
For example, if you want to see the large view of the Active Session Grid, click on the collapse icon next to the Stat/Event/Ratio & Tree Info Area. After you click the icon, the screen will appear as follows.
SUB) Stat Analysis
Stat Analysis provides the function for stat analysis of the analysis period. When you click on the ![]() Button on the Detailed Analysis Initial Window, it connects to the corresponding window and the following information is provided.
Button on the Detailed Analysis Initial Window, it connects to the corresponding window and the following information is provided.
- Top Events Tab: Top Events generated within the analysis period and the related SQLs.
- Wait Class Tab: Wait Class generated within the analysis period and the related SQLs
- TOP-N Tab: Top-N within the analysis period and the related SQLs
Top-N Tab
The Top-N Tab screen is as follows.
TheTop-N Tab is equivalent to Top-N Analysis except for the differences noted below. For more information on Top-N Tab, please reference “Chapter 2. Top-N Analysis” section.
| Item | Top-N Tab | Top-N Analysis |
| Top-N Analysis Data | SQL Summary for every 10 minute. | Top-N SQL Summary for every hour. |
| Analysis Target Period | Peak Period | Long Term Period |
| Tab Order | SQL, Schema, Program, Module, Machine, OS User, SQL | Schema, Program, Module, Machine, OS User, SQL |
| Individual SQL Wait Time Information on SQL Tab | Provides Wait Time by Wait Events. | Provides Wait Time by Wait Class. |
| Long-Term Trend Connection | Long-Term connection for the last 7 days from the time of analysis. (Maximum 7 days) | Long-Term Connection for the analysis period (Minimum 7 days) |
Top Events Tab
The Top Events Tab window is as follows.
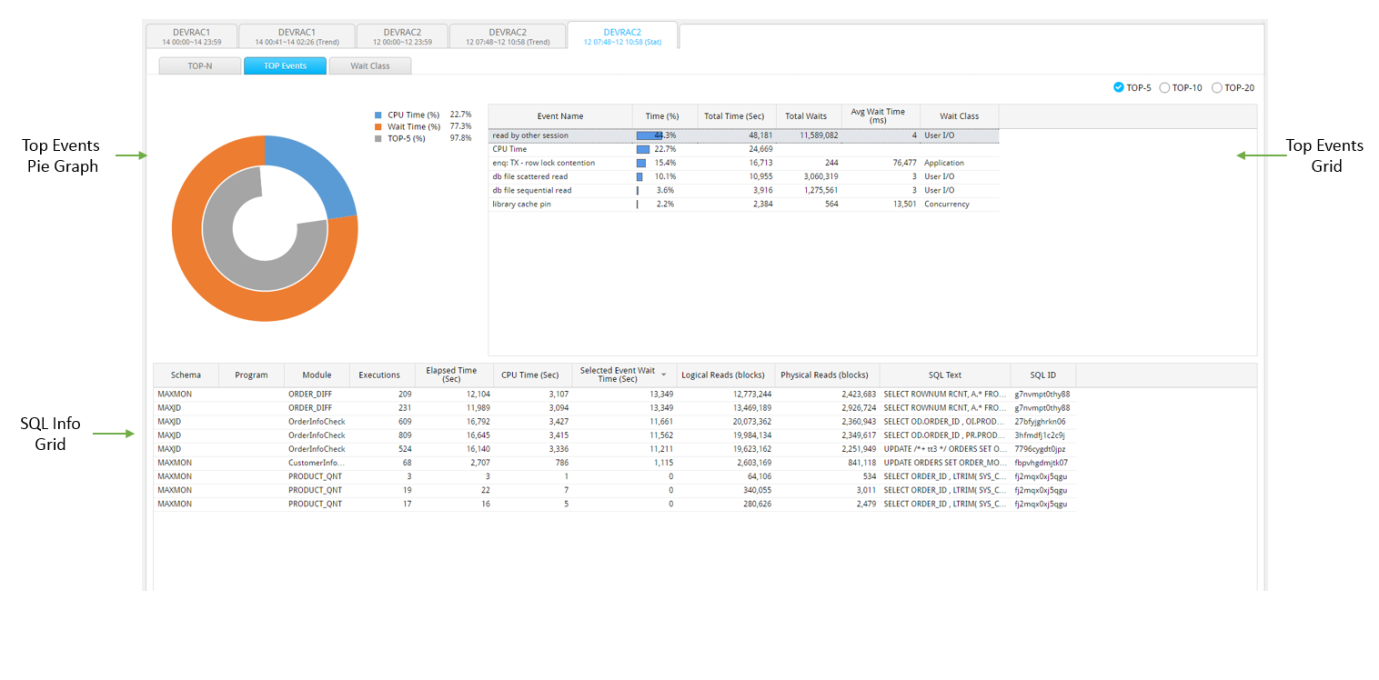
Top Events Pie Graph
Provides the CPU Time (%), Wait Time (%), and Top-N (%) information within the analysis period.
| Item | Description |
| CPU Time (%) | Provides the ratio of CPU Time out of the total Elapsed Time. |
| Wait Time (%) | Provides the ratio of Wait Time out of the total Elapsed Time. |
| Top-N (%) | Provides the ratio of Top-N Wait Time out of the total Wait Time. |
Note1. Total Elapsed Time = CPU Time + Wait Time
Note2. CPU Time = The Sum of CPU Used by this session performance indicator / 100 (Sec)
Note3. Wait Time = The Sum of wait time of wait events, excluding Idle events
Note4. At the top of Top-N, you can select Top-5, Top-10, or Top-20.
Top Events Grid Column
Provides the Top-Event and CPU Time information.
| Column Name | Description |
| Event Name | Wait Event Name (or CPU Time) |
| Total Waits | The number of waits by the corresponding wait event (Sum) |
| Total Time (Sec) |
|
| Value/Sec | Total Time / analysis period (Sec) |
| Avg Wait Time (ms) | Total Time / Total Waits |
| Time (%) | The ratio of the corresponding wait event (or CPU Time) out of the total Elapsed Time. |
| Wait Class | Wait Class Name |
Top Events Grid Mouse Right-Click Menu
The mouse right-click menu is as follows. For more information, please reference “Appendix. Grid Mouse Right-Click Menu UI”.
| Item | Description |
| Export Excel | Downloads the grid content on an excel file. |
| Copy(To Clipboard) | Makes a copy of the grid content. |
| Show/ Hide Columns | Selects the columns to be displayed on the grid. |
| Filter On | Enables the Filtering function. |
| Multiple Sort On | Sorts based on 2 or more column values. |
| Save Image | Saves the grid content as an image. |
Note. When connecting to the Long-Term Trend, the analysis period is the last 7 days from the date of analysis.
SQL Info Grid Column
The SQL Info Grid provides the SQL information related to the wait events (or CPU Time) selected in the Top Events Grid.
| Column Name | Description |
| Schema | Schema Name |
| Program | Program Name |
| Module | Module Name |
| Executions | The number of executions (Sum) |
| Elapsed Time (Sec) | The corresponding SQL’s Elapsed Time (Sum) |
| CPU Time (Sec) | The corresponding SQL’s CPU Time (Sum) |
| Selected Event Wait Time (Sec) | The time waited on the wait event selected in Top Event Grid (Sum) |
| Logical Reads (blocks) | The corresponding SQL’s Memory IO (Sum) |
| Physical Reads (blocks) | The corresponding SQL’s Physical IO (Sum) |
| SQL Text | SQL statement |
| SQL ID | Oracle SQL ID |
| SQL Plan Hash | SQL Plan hash |
SQL Info Grid Mouse Right-Click Menu
The mouse right-click menu is as follows. For more information, please reference “Appendix. Grid Mouse Right-Click Menu UI”.
| Item | Description |
| Long-Term Trend | Connects to the Long-Term Trend Window for the corresponding SQL.
|
| SQL Detail | Provides the details of SQL execution history.
|
| Full SQL Text | Provides SQL Full Text. |
| Export Excel | Downloads the grid content on an excel file. |
| Copy(To Clipboard) | Makes a copy of the grid content. |
| Show/ Hide Columns | Selects the columns to be displayed on the grid. |
| Filter On | Enables the Filtering function. |
| Multiple Sort On | Sorts based on 2 or more column values. |
| Save Image | Saves the grid content as an image. |
Note. When connecting to the Long-Term Trend, the analysis period is the last 7 days from the date of analysis.
Wait Class Tab
The Wait Class Tab window is as follows.
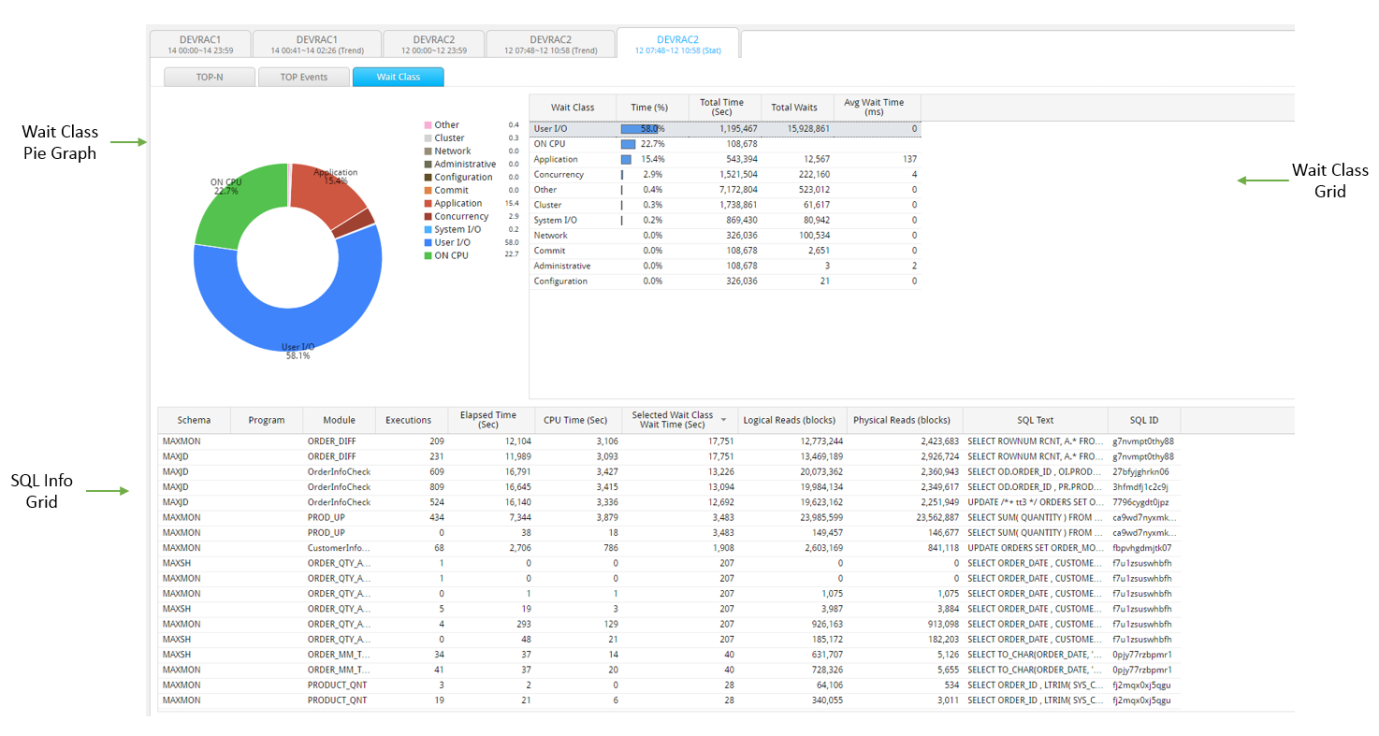
Wait Class Pie Graph
Provides the wait time (%) by wait classes within the analysis period and the CPU Time information.
| Item | Description |
| CPU Time (%) | The ratio of CPU Time out of the total Elapsed Time. |
| Wait Time by Wait Classes (%) | The ratio of Wait Time by Wait Classes out of the total Elapsed Time. |
Wait Class Grid Column
Provides the Wait Class and CPU Time information.
| Column Name | Description |
| Wait Class | Wait Class Name |
| Total Waits | The number of waits by the corresponding wait class (Sum) |
| Total Time (Sec) |
|
| Value/Sec | Total Time / Analysis Period (Sec) |
| Avg Wait Time (ms) | Total Time / Total Waits |
| Time (%) | The ratio of corresponding wait class (or CPU Time) out of the total Elapsed Time. |
Wait Class Grid Mouse Right-Click Menu
The mouse right-click menu is as follows. For more information, please reference “Appendix. Grid Mouse Right-Click Menu UI”.
| Item | Description |
| Export Excel | Downloads the grid content on an excel file. |
| Copy(To Clipboard) | Makes a copy of the grid content. |
| Show/ Hide Columns | Selects the columns to be displayed on the grid. |
| Filter On | Enables the Filtering function. |
| Multiple Sort On | Sorts based on 2 or more column values. |
| Save Image | Saves the grid content as an image. |
Note. When connecting to the Long-Term Trend, the analysis period is the last 7 days from the date of analysis.
SQL Info Grid Column
The SQL Info Grid provides the wait class (or CPU Time) selected in the Wait Class Grid and the related SQL information.
| Column Name | Description |
| Schema | Schema Name |
| Program | Program Name |
| Module | Module Name |
| Executions | Number of Executions (Sum) |
| Elapsed Time (Sec) | The corresponding SQL’s Elapsed Time (Sum) |
| CPU Time (Sec) | The corresponding SQL’s CPU Time (Sum) |
| Selected Event Wait Time (Sec) | The time waited on the Wait Class selected in the Wait Class Grid (Sum) |
| Logical Reads (blocks) | The corresponding SQL’s Memory IO (Sum) |
| Physical Reads (blocks) | The corresponding SQL’s Physical IO (Sum) |
| SQL Text | SQL statement |
| SQL ID | Oracle SQL ID |
| SQL Plan Hash | SQL Plan hash |
SQL Info Grid Mouse Right-Click Menu
The mouse right-click menu is as follows. For more information, please reference “Appendix. Grid Mouse Right-Click Menu UI”.
| Item | Description |
| Long-Term Trend | Connects to the Long-Term Trend Window for the corresponding SQL.
|
| SQL Detail | Provides the details of SQL execution history.
|
| Export Excel | Downloads the grid content on an excel file. |
| Copy(To Clipboard) | Makes a copy of the grid content. |
| Show/ Hide Columns | Selects the columns to be displayed on the grid. |
| Filter On | Enables the Filtering function. |
| Multiple Sort On | Sorts based on 2 or more column values. |
| Save Image | Saves the grid content as an image. |
Note. When connecting to the Long-Term Trend, the analysis period is the last 7 days from the date of analysis.
Top-N Tab
The Top-N Tab window is as follows.
Except for the differences noted below, the Top-N Tab is the same as theTop-N Analysis. For more information about Top-N Tab, please reference “Chapter 2. Top-N Analysis” section.
| Item | Top-N Tab | Top-N Analysis |
| Top-N Analysis Data | SQL Summary for Every 10 Minute | Hourly Top-N SQL Summary |
| Analysis Target Period | Peak Period | Long Term |
| Long-Term Trend Connection | Long-Term Connection for the last 7 days from the time of analysis (Maximum 7 days) | Long-Term Connection for the analysis period (Minimum 7 days) |
SUB) 1 Minute Analysis
1 Minute Analysis provides the information of active sessions execution history taken once per second, grouped into every 1 minute. When you click the ![]() button, it connects to the corresponding window and the following information is provided.
button, it connects to the corresponding window and the following information is provided.
- Wait Class Pie Graph : Provides the Wait Time by Oracle Wait Classes generated in 1 minute and CPU Time
- Wait Event Grid : Provides information by Wait Events generated in 1 minute
- Active Session Trend (Wait Class) : Provides Trends of Number of Sessions by Wait Classes ( and ON CPU) taken once per second.
- Active Session Trend (Wait Events) : Provides Trends of Number of Sessions by Wait Events (and ON CPU) take once per second.
- Active Session Grid : Provides the active sessions information taken once per second and Sum of each SQL.
1 Minute Analysis window is as follows.
Wait Class Pie Graph
Provides the wait time (%) by wait classes generated in 1 minute and CPU Time information.
| Item | Description |
| CPU Time (%) | Provides the ratio of CPU Time out of the total Elapsed Time. |
| Wait Time by Wait Classes (%) | Provides the ratio of Wait Time by Wait Classes out of the total Elapsed Time. |
Wait Events Grid Column
Provides the Wait Events and CPU Time information.
| Column Name | Description |
| Event Name | Wait Event Name (or CPU Time) |
| Total Waits | The number of waits by the corresponding wait event (Sum) |
| Total Time (Sec) |
|
| Value/Sec | Total Time / Analysis Period (Sec) |
| Avg Wait Time (ms) | Total Time / Total Waits |
| Time (%) | The ratio of corresponding wait event (or CPU Time) out of the total Elapsed Time. |
| Wait Class | Wait Class Name |
Wait Events Grid Mouse Right-Click Menu
The mouse right-click menu is as follows. For more information, please reference “Appendix. Grid Mouse Right-Click Menu UI”.
| Item | Description |
| Long-Term Trend | Connects to the Long-Term Trend Window for the corresponding wait event.
|
| Export Excel | Downloads the grid content on an excel file. |
| Copy(To Clipboard) | Makes a copy of the grid content. |
| Show/ Hide Columns | Selects the columns to be displayed on the grid. |
| Filter On | Enables the Filtering function. |
| Multiple Sort On | Sorts based on 2 or more column values. |
| Save Image | Saves the grid content as an image. |
Active Session Trend (Wait Class)
Provides the trends of number of sessions by wait classes (and ON CPU) taken once per second.
Active Session Trend (Wait Events)
Provides the trends of number of sessions by wait events (and ON CPU) taken once per second.
Active Session Grid Column
Provides the active session information taken once per second.
| Column Name | Description |
| SID | Session identifier |
| Program | Program |
| Module | Module Name
|
| User Name | Oracle User Name |
| SPID | Server Process ID |
| CPU (%) | CPU Usage (%) |
| Elapsed Time (Sec) | Time elapsed from the start of SQL execution until now |
| Event Name | The name of event name currently waiting |
| Logical Reads/Sec (blocks) | Memory I/O Blocks Count (Value/sec) |
| Physical Reads/Sec (blocks) | Disk I/O Blocks Count (Value/sec) |
| Block Changes/Sec (blocks) | Changed Blocks Count (Value/sec) |
| Executions/Sec | SQL Text Execution Count (Value/sec) |
| Hard Parse Count/Sec | Hard parsing Count (Values/sec) |
| Parse Count Total/Sec | Parsing Count (Value/sec) |
| Open Cursors | Number of cursors currently open (Current value) |
| Undo Blocks | Number of Undo Blocks used during the transaction. (Value/Sec) |
| Undo Records | Number of Undo Record generated during the transaction (Value/Sec) |
| Undo Seg.ID | Undo Segment ID being used by the transaction |
| PGA (MB) | Size of PGA currently in use |
| Machine | Machine Name |
| Process MEM (MB) | Process’ Physical Memory Size |
| SQL Text | SQL Text currently being executed |
| Prev SQL Text | Previous SQL Text |
| SQL ID | Oracle SQL ID |
| Prev SQL ID | Oracle Previous SQL ID |
| Status | Session Status |
| P1 | Indicates the P1 value of the wait event. |
| P2 | Indicates the P2 value of the wait event. |
| P3 | Indicates the P3 value of the wait event. |
| Wait SEQ | Indicates the value equivalent to V$SESSION_WAIT.SEQ# column. |
| Wait Time | Indicates the value equivalent to V$SESSION_WAIT.WAIT_TIME column. |
| Seconds In Wait | Indicates the value equivalent to V$SESSION_WAIT.SECONDS_IN_WAIT column. |
| Action | Action Name |
| Client Identifier | Client Identifier |
| Client Info | Displays the information that it has been set as DBMS_APPLICATION_INFO.SET_CLIENT_INFO procedure. |
| PQ Owner Inst ID | PQ coordinator session’s Instance ID |
| PQ Owner Inst SID | PQ coordinator SID |
| Row Wait File | Indicates the value equivalent to V$SESSION.ROW_WAIT_FILE#. |
| Row Wait Obj | Indicates the value equivalent to V$SESSION.ROW_WAIT_OBJ#. |
| Row Wait Block | Indicates the value equivalent to V$SESSION.ROW_WAIT_BLOCK#. |
| SQL Plan Hash | Plan hash Value |
| Command Type | SQL Type (SELECT, INSERT, DELETE, UPDATE, CREATE, and etc.) |
| Schema | Schema Name |
| Logon Time | Session Login Time |
| Session Type | Session Type (USER, BACKGROUND, and etc.) |
| Logical Reads (Sigma) | Memory I/O Blocks Count (Cumulative Value) |
| Physical Reads (Sigma) | Disk I/O Blocks Count (Cumulative Value) |
| Block Changes (Sigma) | Changed Blocks Count (Cumulative Value) |
| Executions (Sigma) | SQL Text Execution Count (Cumulative Value) |
| Hard Parse Count (Sigma) | Hard parsing Count (Cumulative Value) |
| Parse Count Total (Sigma) | Parsing Count (Cumulative Value) |
| SQL Address | SQL Text Address Value |
| OS User | OS User Name |
| Serial | Session Serial Number |
| CPID | Client Process ID |
Active Session Grid Mouse Right-Click Menu
The mouse right-click menu is as follows. For more information, please reference “Appendix. Grid Mouse Right-Click Menu UI”.
| Item | Description |
| Session Detail | Provides the details of session history.
For more information, please reference “Chapter 7. Session Detail Window” section. |
| Session List | Connects to the Session List Window by using the corresponding session’s Instance Name, SID. |
| SQL Detail | Provides the details of SQL execution history.
|
| Full SQL Text | Provides SQL Full Text. |
| Prev SQL Text | Provides the Previous SQL Full Text. |
| Long-Term Trend | Connects to Long-Term Trend window for the corresponding SQL.
|
| Export Excel | Downloads the grid content on an excel file. |
| Copy(To Clipboard) | Makes a copy of the grid content. |
| Show/ Hide Columns | Selects the columns to be displayed on the grid. |
| Filter On | Enables the Filtering function. |
| Multiple Sort On | Sorts based on 2 or more column values. |
| Save Image | Saves the grid content as an image. |
Note. When connecting to the Long-Term Trend, the analysis period is the last 7 days from the date of analysis.
After the SUM Button Click, Active Session Grid Column
The SUM button provides the active session information taken once per second, grouped into the following columns.
- User Name
- Program
- Module
- SQL ID
- SQL Plan Hash
| Column Name | Description |
| Program | Program |
| Module | Module Name
|
| User Name | Oracle User Name |
| (MAX) CPU (%) | (MAX) CPU Usage (%) |
| (MAX) Elapsed Time (Sec) | (MAX) Time elapsed from the start of SQL execution until now |
| (SUM) Logical Reads/Sec (blocks) | (SUM) Memory I/O Blocks Count (Value/sec) |
| (SUM) Physical Reads/Sec (blocks) | (SUM) Disk I/O Blocks Count (Value/sec) |
| (SUM) Block Changes/Sec (blocks) | (SUM) Changed Blocks Count (Value/sec) |
| (SUM) Executions/Sec | (SUM) SQL Text Execution Count (Value/sec) |
| (SUM) Hard Parse Count/Sec | (SUM) Hard parsing Count (Values/sec) |
| (SUM) Parse Count Total/Sec | (SUM) Parsing Count (Value/sec) |
| (MAX) Opened Cursors Current | (MAX) Number of cursors currently open (Current value) |
| (MAX) Undo Blocks | (MAX) Number of Undo Blocks used during the transaction. (Value/Sec) |
| (MAX) Undo Records | (MAX) Number of Undo Record generated during the transaction (Value/Sec) |
| (MAX) PGA (MB) | (MAX) PGA’s Current Size |
| (MAX) Process MEM (MB) | (MAX) Process’ Physical Memory Size |
| SQL Text | SQL Text currently being executed |
| SQL ID | Oracle SQL ID |
| SQL Plan Hash | Plan Hash Value |
After the SUM Button Click, Active Session Grid Mouse Right-Click Menu
The mouse right-click menu is as follows. For more information, please reference “Appendix. Grid Mouse Right-Click Menu UI”.
| Item | Description |
| SQL Detail | Provides the details of SQL execution history.
|
| Full SQL Text | Provides SQL Full Text. |
| Long-Term Trend | Connects to Long-Term Trend window for the corresponding SQL.
|
| Wait List | At the time of corresponding SQL execution, it provides the details of wait events history. |
| Export Excel | Downloads the grid content on an excel file. |
| Copy(To Clipboard) | Makes a copy of the grid content. |
| Show/ Hide Columns | Selects the columns to be displayed on the grid. |
| Filter On | Enables the Filtering function. |
| Multiple Sort On | Sorts based on 2 or more column values. |
| Save Image | Saves the grid content as an image. |
Note. When connecting to the Long-Term Trend, the analysis period is the last 7 days from the date of analysis.
SUB) Class Tab Explanation
Window Configuration
The window configuration is as follows.
Search Condition
| Search Condition | Description |
| |
Selects the target instance for analysis. For selection convenience, the autocomplete function is available. |
| |
Sets the analysis period for the last 1 week. |
| |
Sets the analysis period for the last 1 month. |
| |
You can either enter the analysis date, or select the date from the calendar UI. |
| |
Set the analysis target time period. This can be used to analyze the information of Top-N executed during the operation hours (for example 9~19 hr), or the Top-N executed in the Batch Window.
|
| |
Select an analysis target item.
|
When Wait Class Item is Selected
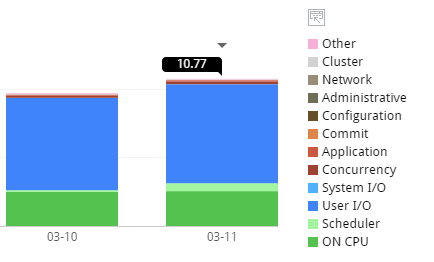
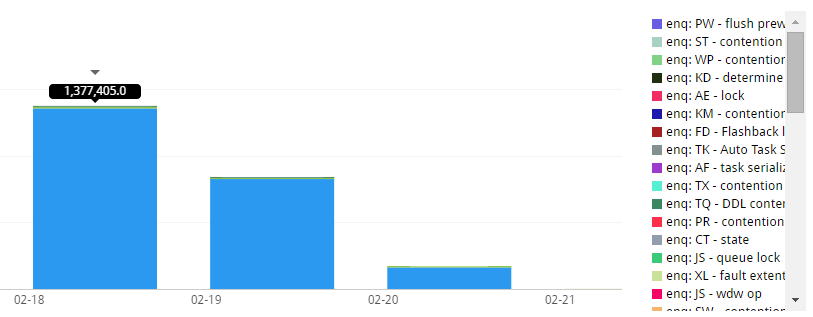
Daily Trend Area
Provides daily trends of the wait time according to each wait class (and CPU).
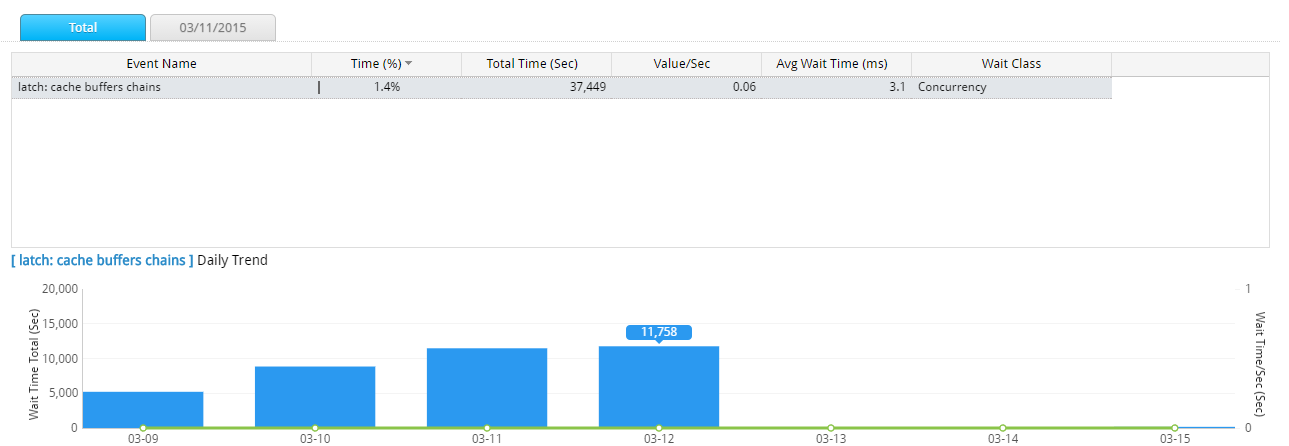
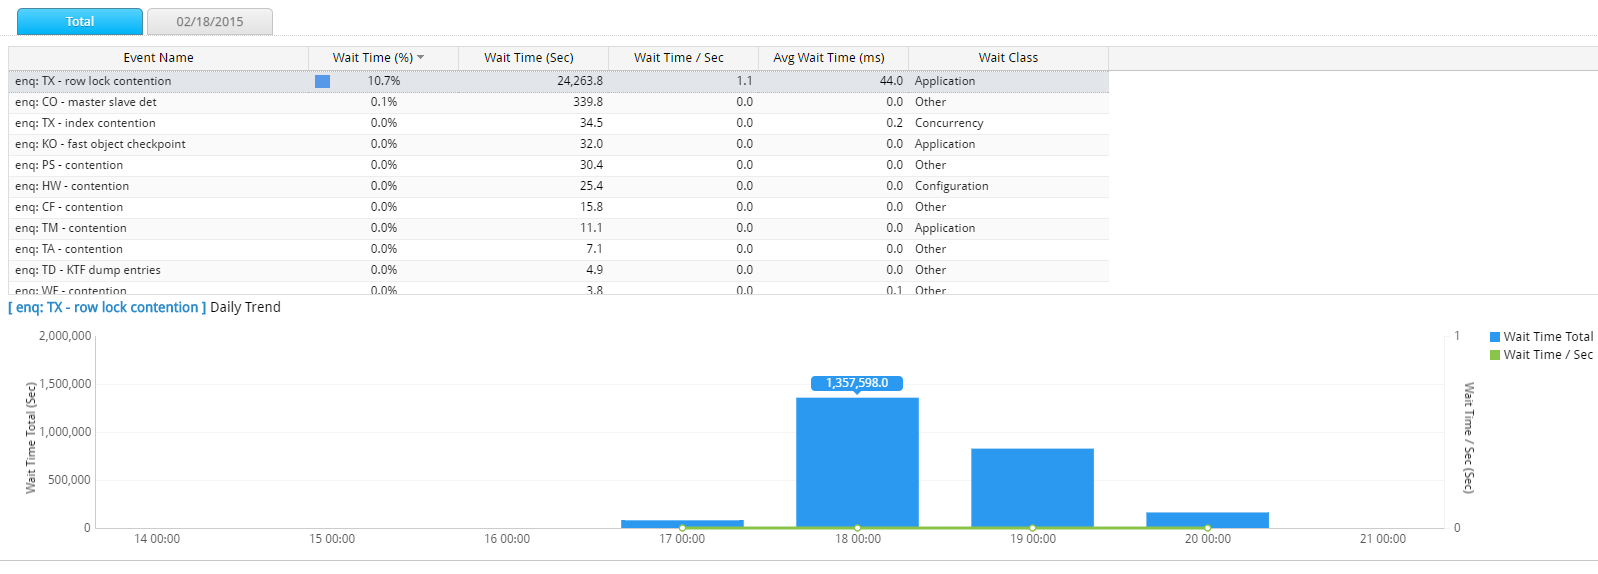
Total Tab
Provides summary information of the analysis period by each wait event and the daily trends graph of each individual item.
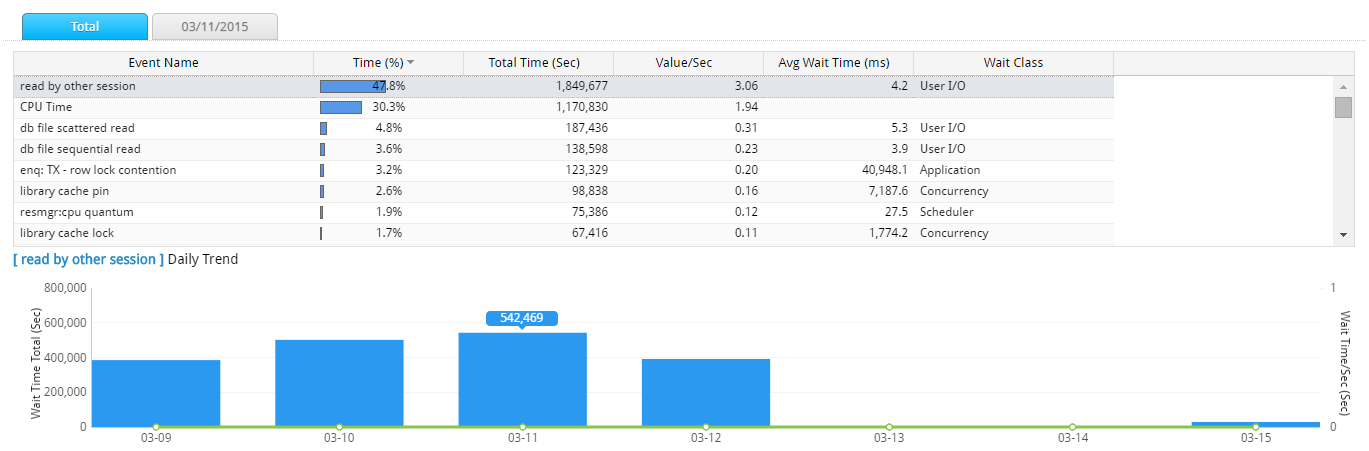
Note1. Immediately following the search, the daily trends graph of the item whose wait time is the highest in the Total Tab Grid will be displayed.
Note2. The daily trends graph diplays the Wait Time Total and the Wait Time/Sec information on a double-axis graph.
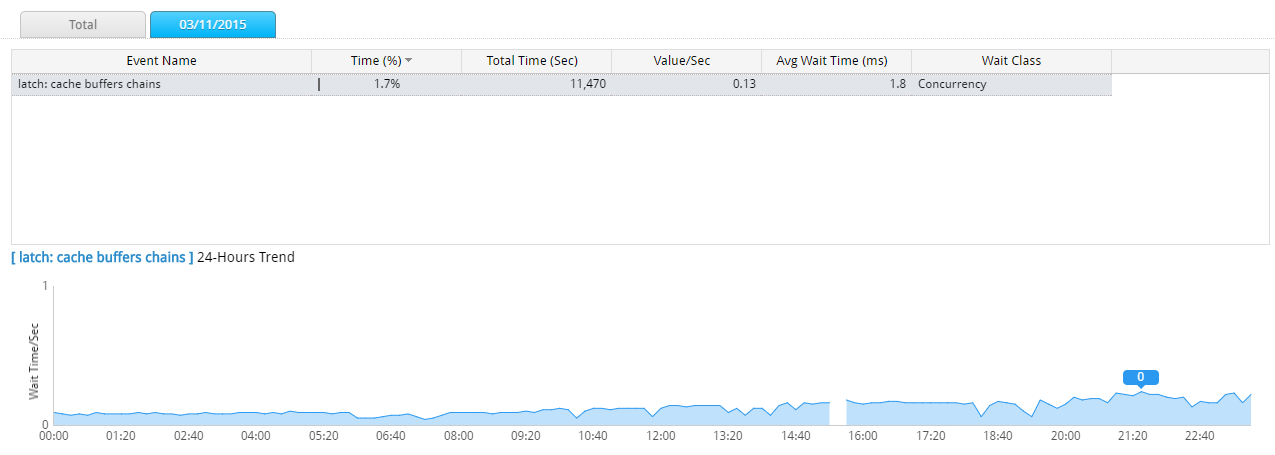
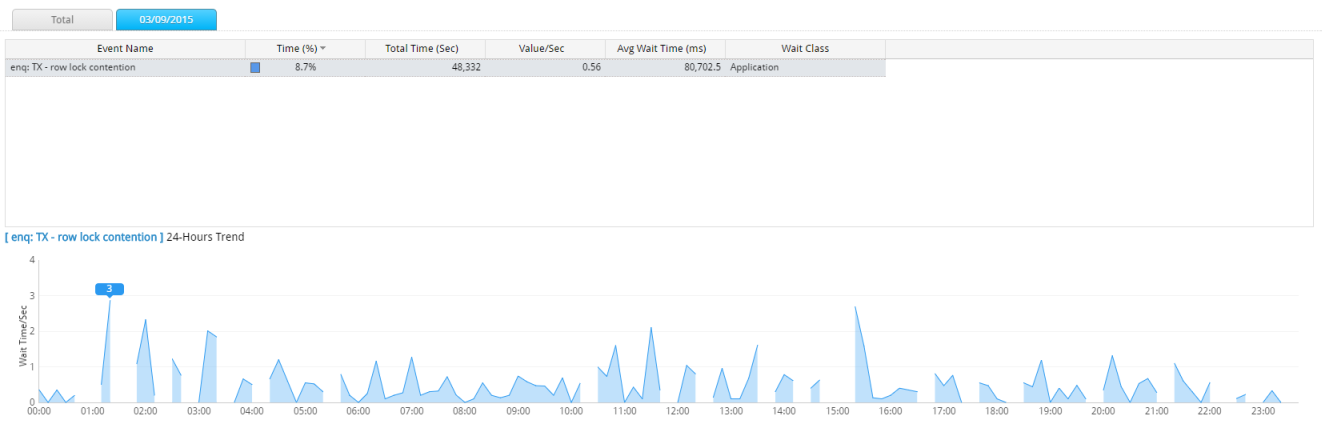
Daily Tab
Provides summary information of a particular date by each wait event and a 24 hour trends graph of each individual item.
Note1. Immediately following the search, a date tab is automatically created for the date whose value is the highest in the Daily Trend Area.
Note2. The 24 hour trends graph displays the Wait Time/Sec information in an area graph.
When Latch Wait Time Item is Selected
Daily Trend Area
Provides daily trends of wait time by each latch.
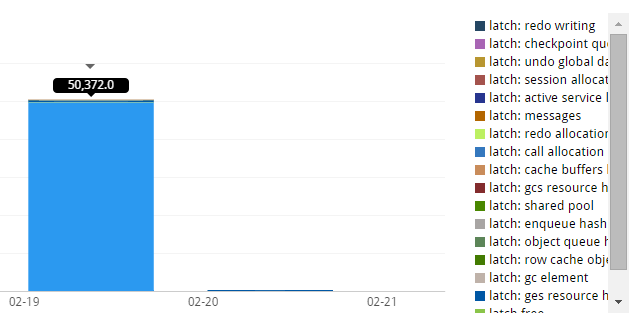
Total Tab
Provides summary information of analysis period by each latch and daily trends graph of each individual item.
Note1. Immeidatley following the search, a daily trends graph of the item whose wait time is the highest in the Total Tab Grid will be displayed.
Note2. The daily trends graph displays the Wait Time Total and the Wait Time/Sec information in a double axis graph.
Daily Tab
Provides summary information of a particular date by each latch and the 24 hour trends graph of each individual item.
Note1. Immediately following the search, a date tab is automatically created for the date whose value is the highest in the Daily Trend Area.
Note2. The 24 hour trends graph displays the Wait Time/Sec information in an area graph.
When Enqueue Wait Time Item is Selected
Daily Trend Area
Provides daily trends of wait time by each Enqueue.
Total Tab
Provides summary information of the analysis period by each enqueue and the daily trends graph of each individual item.
Note1. Immediately following the search, a daily trends graph of the item whose wait time is the highest in the Total Tab Grid will be displayed.
Note2. The daily trends graph displays the Wait Time Total and the Wait Time/Sec information in a double axis graph.
Daily Tab
Provides summary information of a particular date by each enqueue and a 24 hour trends graph of each individual item.
Note1. Immediately following the search, a date tab is automatically created for the date whose value is the highest in the Daily Trend Area.
Note2. The 24 hour trends graph displays the Wait Time/Sec information in an area graph.
Daily Tab Add Method (Common)
When you click on the bar graph in the Daily Trend Area, a Daily Tab of the corresponding date will be added.
Performance Trend Connection Method (Common)
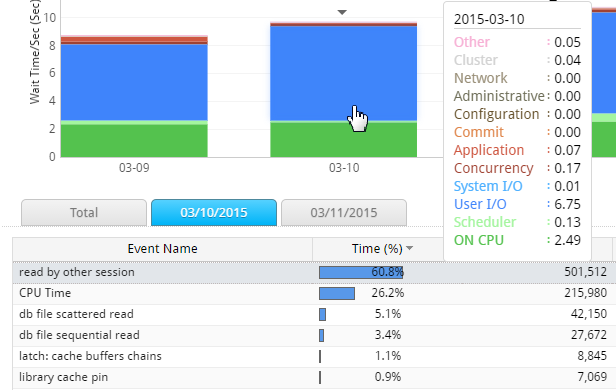
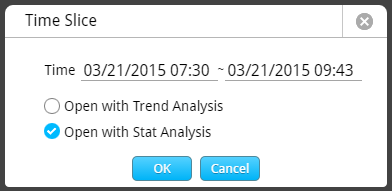
1. Drag the mouse over the desired analysis period from the 24-Hours Trend graph in the Daily Tab.
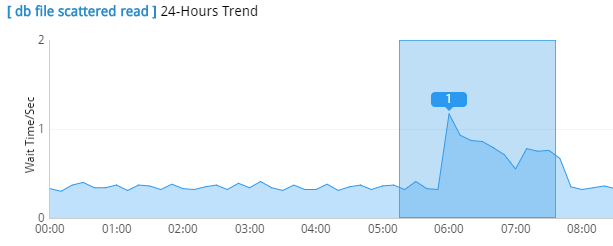
2. Reset the analysis period on the Time Slice Window or click the “OK” button.
Grid Column (Common)
| Column Name | Description |
| Event Name | Wait Event Name (or CPU Time) |
| Total Waits | The number of waits by the corresponding wait event (Sum) |
| Value/Sec | Total Time / Analysis Period (Sec) |
| Avg Wait Time (ms) | Total Time / Total Waits |
| Wait Class | Wait Class Name |
Grid Mouse Right-Click Menu (Common)
The mouse right-click menu is as follows. For more information, please reference “Appendix. Grid mouse right-click menu UI”.
| Item | Description |
| Export Excel | Downloads the grid content on an excel file. |
| Copy(To Clipboard) | Makes a copy of the grid content. |
| Show/ Hide Columns | Selects the columns to be displayed on the grid. |
| Filter On | Enables the Filtering function. |
| Multiple Sort On | Sorts based on 2 or more column values. |
| Save Image | Saves the grid content as an image. |
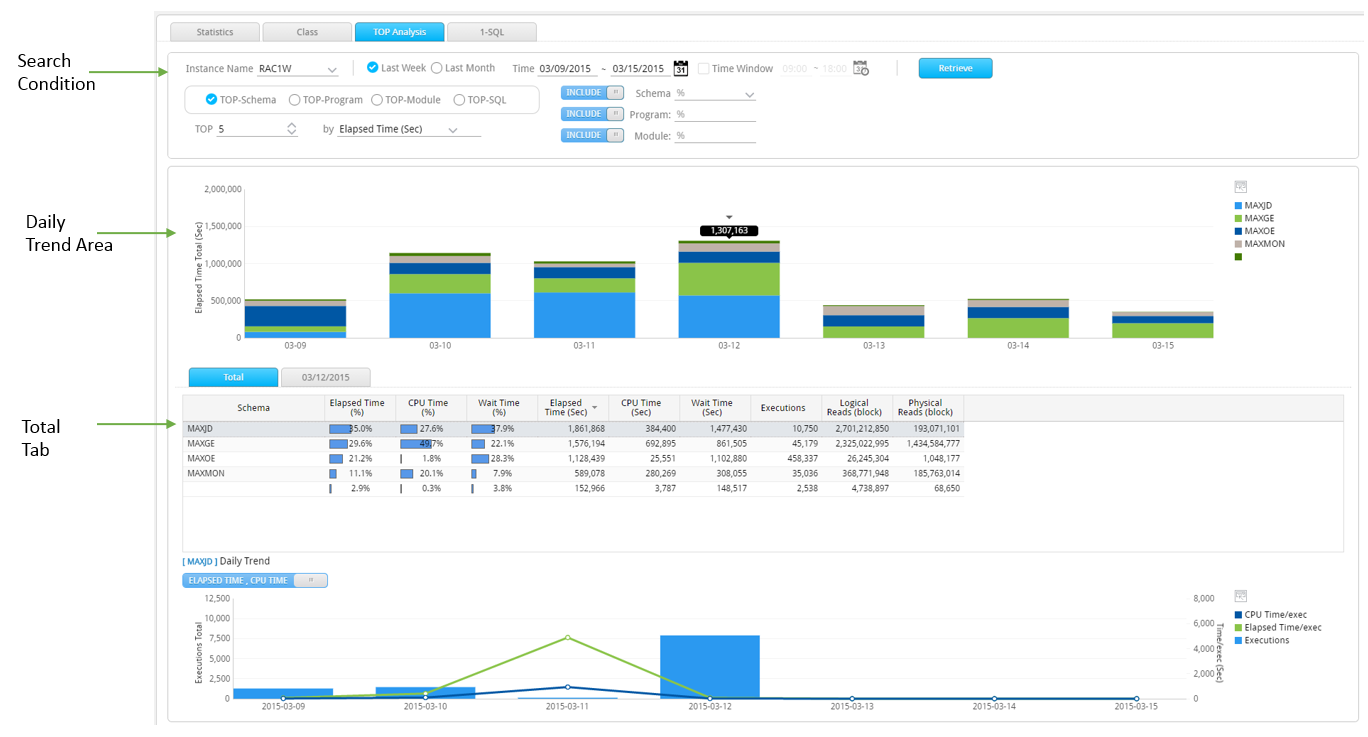
SUB) Top Analysis Tab Explanation
Window Configuration
The window configuration is as follows.
Search Condition
| Search Condition | Description |
| |
Select the target instance for analysis. For selection convenience, the autocomplete function is available. |
| |
Sets the analysis period for the last 1 week. |
| |
Sets the analysis period for the last 1 month. |
| |
You can either enter the analysis date, or select the date from the calendar UI. |
| |
Include / Exclude Toggle Button
|
| |
Select Shema using the Combo box. You can choose 2 or more Schemas by clicking the items in the Combo Box. |
 |
Enter the target Program Name and Module Name for analysis (or for exclusion). The input rules are as follows.
For example, if you want to search the programs whose Program Name is “JDBC Thin Client”, “SQL Plus”, then enter the keywords as “thin,sql”. |
| |
Select the analysis item.
|
| |
Set the number of Top-N.
|
| |
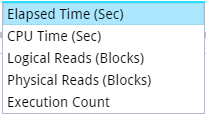
Set the criteria for Top-N output.
Provides the following sorting criteria. |
| |
Set the analysis target time period. This can be used to analyze the information of Top-N executed during the operation hours (for example 9~19 hr), or the Top-N executed in the Batch Window.
|
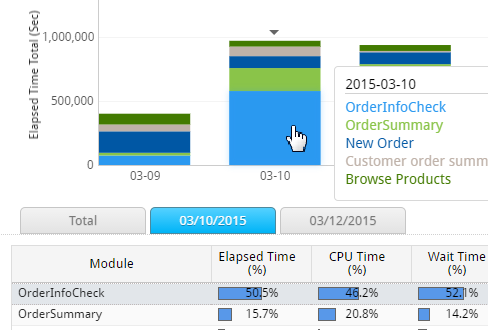
When Top Schema Item is Selected
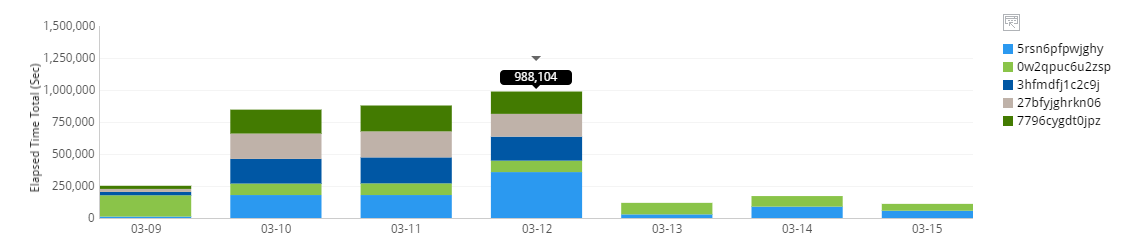
Daily Trend Area
Provides daily performance trends by each Schema.
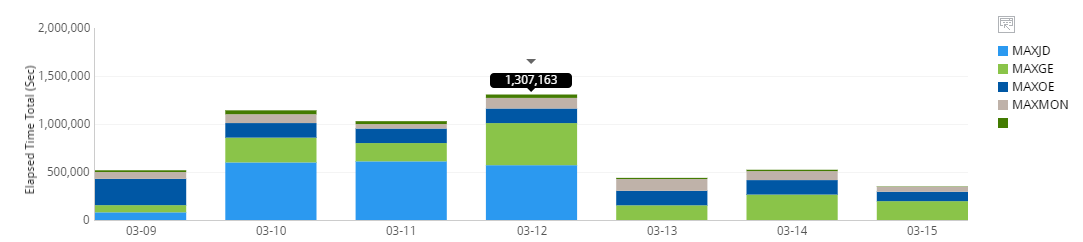
Total Tab
Provides summary information of the analysis period by each schema and a daily trends graph of each individual schema.
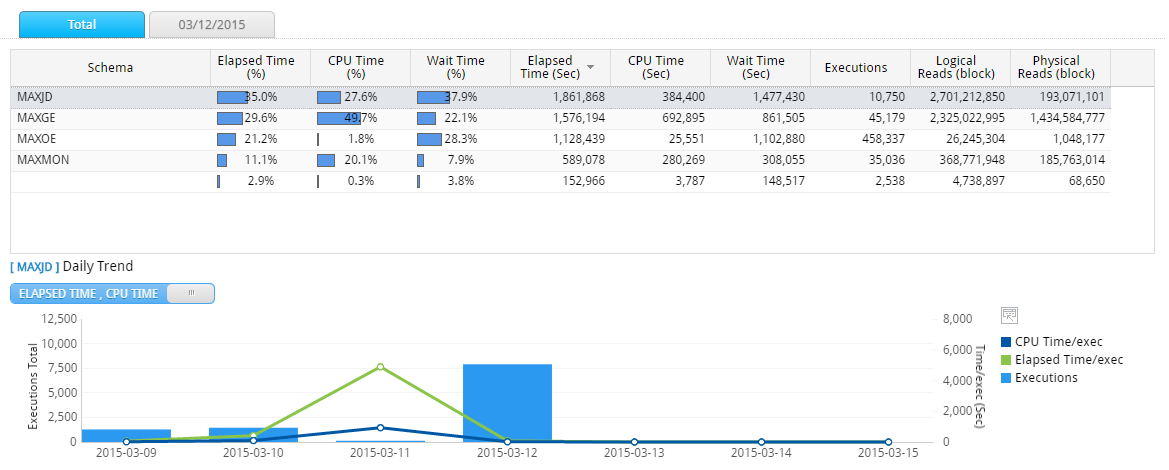
Note. Immediately following the search, a daily trends graph of the Schema whose grouping criteria column’s value is the highest in the Total Tab Grid.
The Daily Trend uses the toggle button to display 2 types of information.
| Toggle Button | Description |
| |
Bar Graph: The daily corresponding Schema’s SQL execution count.Line Graph # 1: Daily Average Elapsed Time
Line Graph #2: Daily Average CPU Time
|
| |
Bar Graph: The daily corresponding Schema’s SQL execution count.Line Graph # 1: Daily Average Logical IO
Line Graph #2: Daily Average Physical IO
|
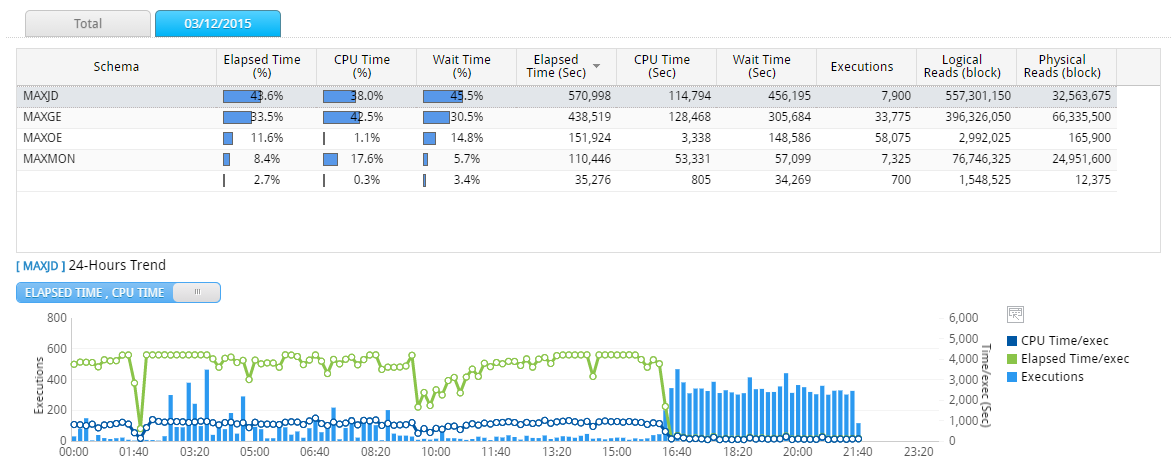
Daily Tab
Provides summary information of a particular date by each schema and a 24 hour trends graph of each individual schema.
Note1. Immediately following the search, a date tab is automatically created for the date whose value is the highest in the Daily Trend Area.
Note2. A 24 hour trends graph displays the hourly information.
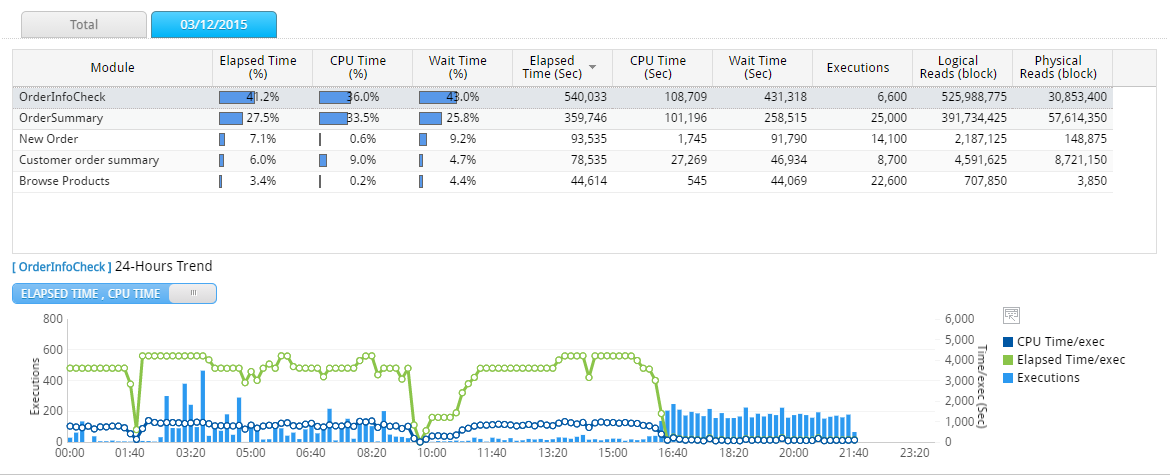
When Top Program Item is Selected
Daily Trend Area
Provides daily performance trends by each Program.
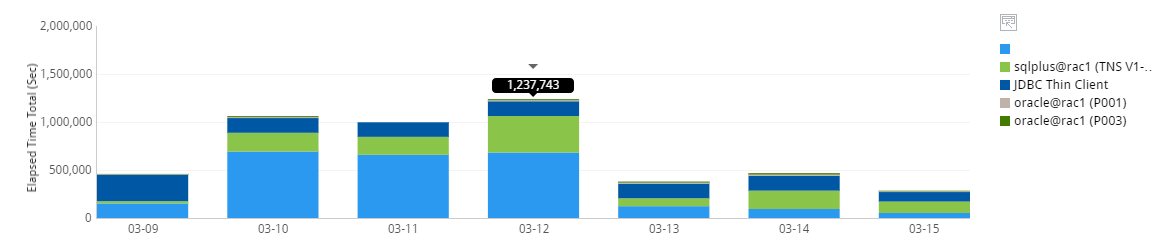
Total Tab
Provides summary information of the analysis period by each program and a daily trends graph of each individual program.
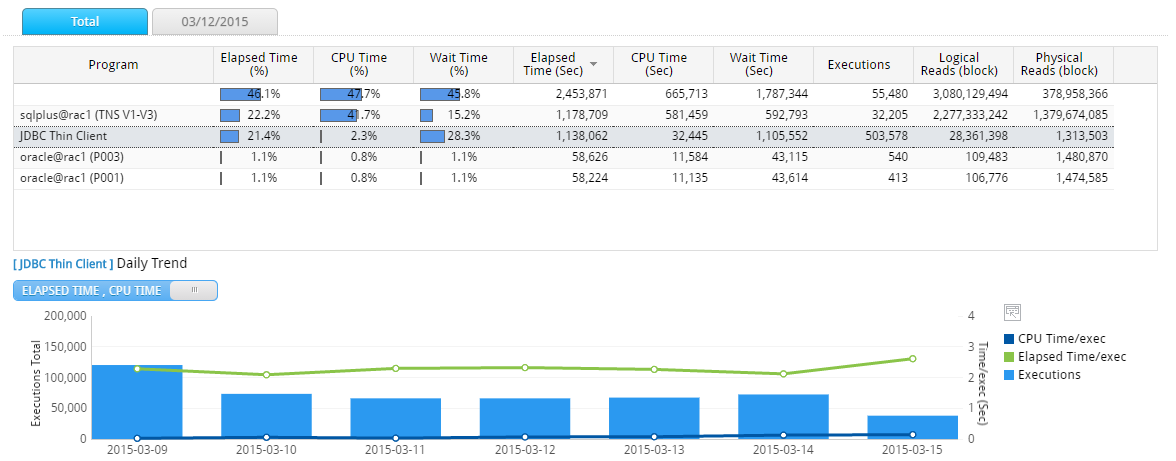
Note. Immediately following the search, a daily trends graph of the Prgram whose grouping criteria value is the highest in the Total Tab Grid will be displayed.
Daily Trend uses the toggle button to display 2 types of information.
| Toggle Button | Description |
| |
Bar Graph: The daily corresponding Program’s SQL execution count.Line Graph # 1: Daily Average Elapsed Time
Line Graph #2: Daily Average CPU Time
|
| |
Bar Graph: The daily corresponding Program’s SQL execution count.Line Graph # 1: Daily Average Logical IO
Line Graph #2: Daily Average Physical IO
|
Daily Tab
Provides summary information of a particular date by each program and a 24 hour trends graph of each individual program.
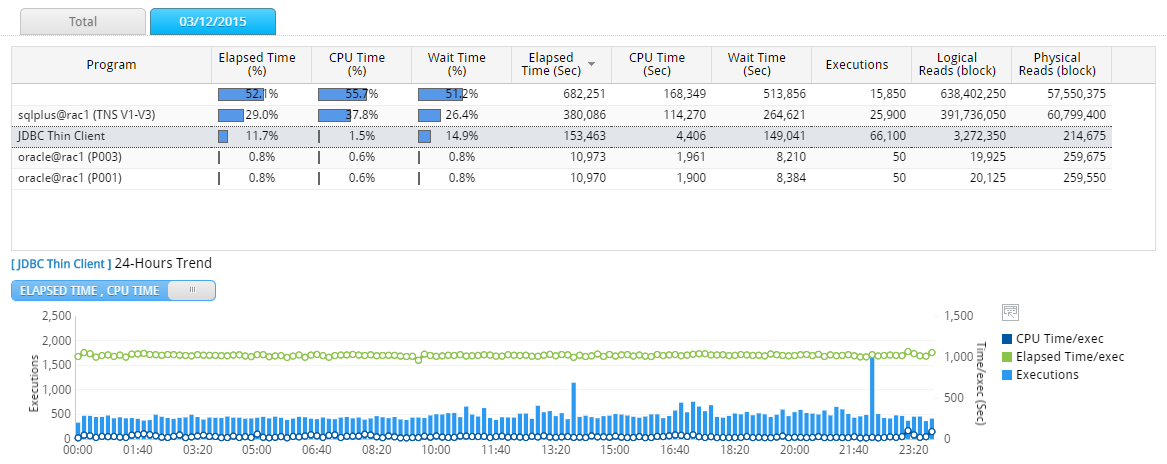
Note1. Immediately following the search, a date tab is automatically created for the date whose value is the highest in the Daily Trend Area.
Note2. The 24 hour trends graph provides the hourly information.
When Top Module Item is Selected
Daily Trend Area
Provides daily performance trends by each Module.
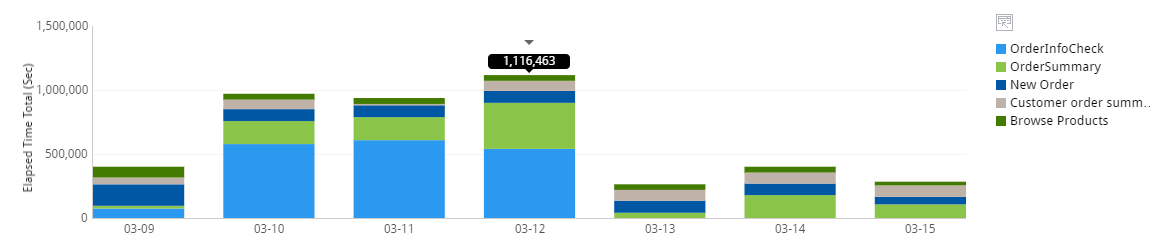
Total Tab
Provides summary information of the analysis period by each module and a daily trends graph of each individual module.
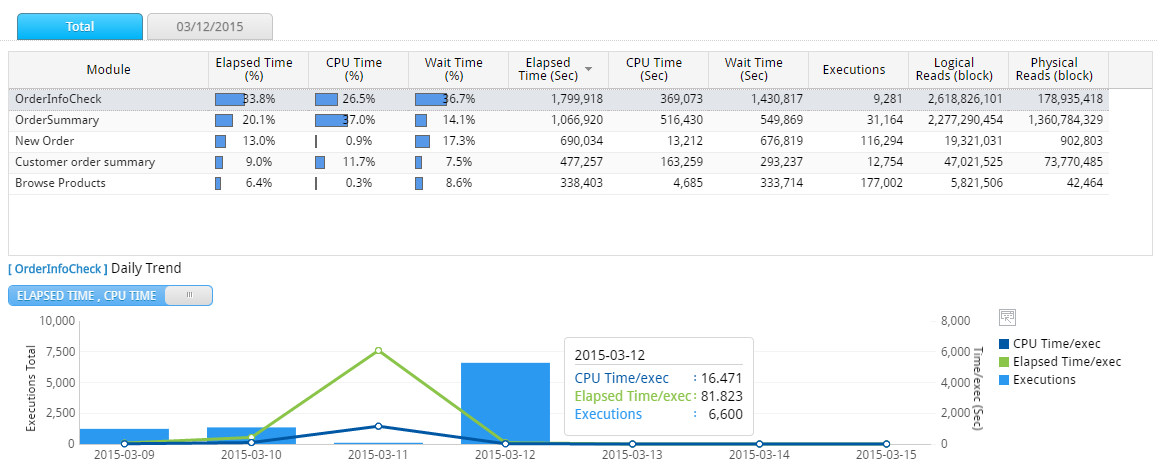
Note. Immediately following the search, a daily trends graph of the module whose grouping criteria column’s value is the highest in the Total Tab Grid will be displayed.
The Daily Trend uses the toggle button to provide 2 types of information.
| Toggle Button | Description |
| |
Bar Graph: The daily corresponding Module’s SQL execution count.Line Graph # 1: Daily Average Elapsed Time
Line Graph #2: Daily Average CPU Time
|
| |
Bar Graph: The daily corresponding Module’s SQL execution count.Line Graph# 1: Daily Average Logical IO
Line Graph #2: Daily Average Physical IO
|
Daily Tab
Provides summary information of a particular date by each module and a 24 hour trends graph of each individual module.
Note1. Immediately following the search, a date tab is automatically created for the date whose value is the highest in the Daily Trend Area.
Note2. The 24 hour trends graph provides the hourly information.
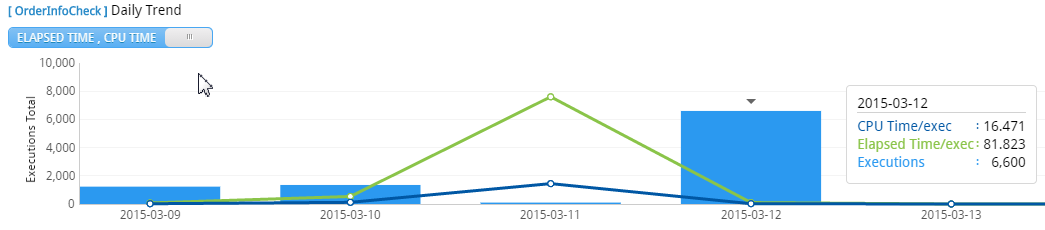
When Top SQL Item is Selected
Daily Trend Area
Provides daily performance trends by each SQL.
Total Tab
Provides summary information of the analysis period by each SQL and a daily trends graph of each individual SQL.
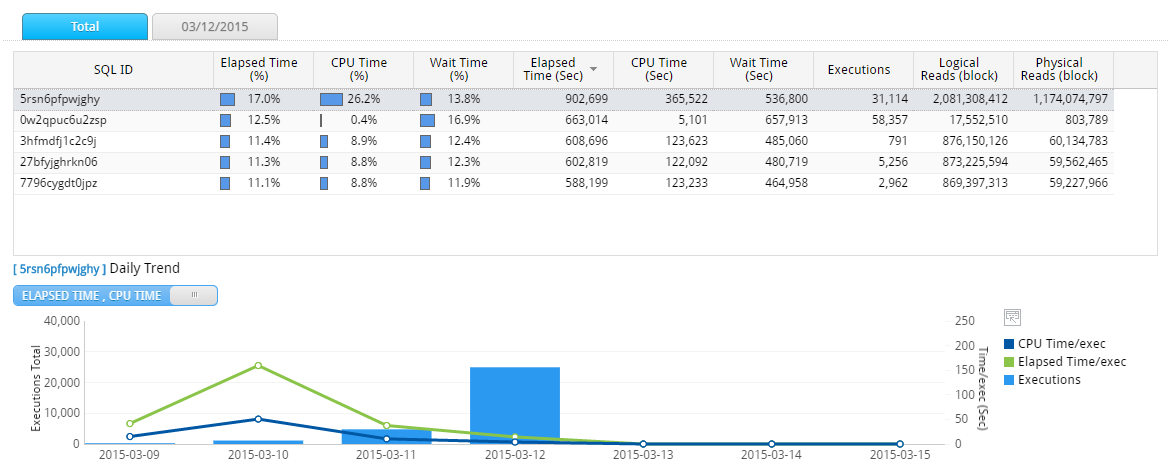
Note. Immediately following the search, a daily trends graph of the SQL whose grouping criteria column’s value is the highest in the Total Tab Grid will be displayed
The Daily Trend uses the toggle button to display 2 types of information.
| Toggle Button | Description |
| |
Bar Graph: The daily corresponding SQL’s SQL execution count.Line Graph # 1: Daily Average Elapsed Time
Line Graph #2: Daily Average CPU Time
|
| |
Bar Graph: The daily corresponding SQL’s SQL execution countLine Graph # 1: Daily Average Logical IO
Line Graph #2: Daily Average Physical IO
|
Daily Tab
Provides summary information of a particular date by each SQL and the 24 hour trends graph of each individual SQL.
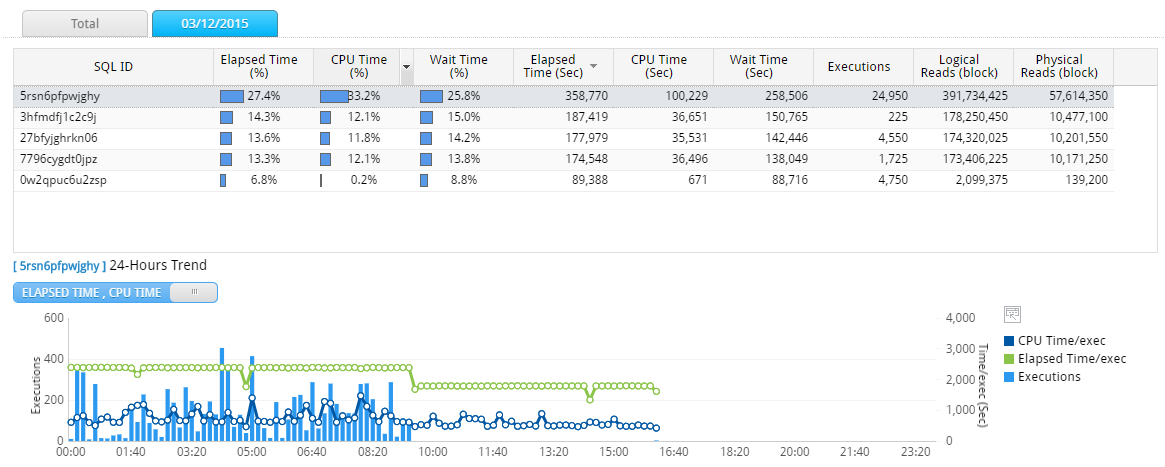
Note1. Immediately following the search, a date tab is automatically created for the date whose value is the highest in the Daily Trend Area.
Note2. The 24 hour trends graph displays the hourly information.
Daily Tab Add Method (Common)
When you click on the bar graph in the Daily Trend Area, the corresponding date’s Daily Tab will be added.
Top-N Analysis Connection Method #1 (Common)
When you click on the bar graph in the Total Tab, it connects to the Top-N Analysis window of the corresponding date and the item selected in the Daily Trend Area Grid.
Top-N Analysis Connection Method #2 (Common)
When you click on the bar graph in the Daily Tab, it connects to the Top-N Analysis window of the corresponding date and the item selected in the Daily Trend Area Grid.
Grid Column (Common)
| Column Name | Description |
| Top-N Criteria Name | Top-N Criteria Name (Schema Name, Program Name, Module Name, or SQL ID) |
| Elapsed Time (%) | The ratio of corresponding item out of the total Elapsed Time. |
| CPU Time (%) | The ratio of corresponding item out of the total CPU Time. |
| Wait Time (%) | The ratio of corresponding item out of the total Wait Time. |
| Elapsed Time (Sec) | The corresponding item’s SQL Elapsed Time (Sum) |
| CPU Time (Sec) | The corresponding item’s CPU Time (Sum) |
| Wait Time (Sec) | The corresponding item’s Wait Time (Sum) |
| Executions | The corresponding item’s SQL Text Execution Count (Sum) |
| Logical Reads (blocks) | The corresponding item’s Logical IO (Sum) |
| Physical Reads (blocks) | The corresponding item’s Physical IO (Sum) |
Grid Mouse Right-Click Menu (Common)
The mouse right-click menu is as follows. For more information, please reference “Appendix. Grid Mouse Right-Click Menu UI”.
| Item | Description |
| SQL Detail | Provides the details of SQL execution history.
|
| Full SQL Text | Provides SQL Full Text. |
| Export Excel | Downloads the grid content on an excel file. |
| Copy(To Clipboard) | Makes a copy of the grid content. |
| Show/ Hide Columns | Selects the columns to be displayed on the grid. |
| Filter On | Enables the Filtering function. |
| Multiple Sort On | Sorts based on 2 or more column values. |
| Save Image | Saves the grid content as an image. |
Parameter
SUB) Overview
Provides the Oracle parameter information. The main functions are as follows.
- Pre-Check Tab: Provides the main parameters among the Oracle parameters.
- Search Result Tab: Provides the parameters which satisfy the search conditions.
- Modification History Tab: Provides the modication history of parameters.
SUB) Search Condition
| Search Condition | Description |
| |
Selects the target instance for analysis. For searching convenience, autocomplete function is available. |
| |
Sets the analysis date for yesterday. (Default Value) |
| |
Sets the analysis date for today. |
| |
You can either enter the analysis date, or select the date from the calendar UI. |
|
|
Enter part of the parameter name. The search rules are as follows.
|
SUB) Active Tab and Tab Content According to Search Conditions
| Search Condition | Active Tab | Tab Content |
| %Search Word%
Search Without Entering |
Pre-Check |
|
| %Search Word%
Enter and Search |
Search Result |
|
SUB) Pre-Check Tab Explanation
Provides parameter information by the 4 Pre-defined categories.
| Category Name | Description |
| Basic Initialization | Provides the basic parameter information |
| Diagnostics & Statistics | Provides the diagnostics related parameter information |
| Optimizer | Provides the Oracle Optimizer related parameter information |
| SGA & PGA | Provides SGA and PGA related parameter information |
Window Configuration
The window configuration is as follows.
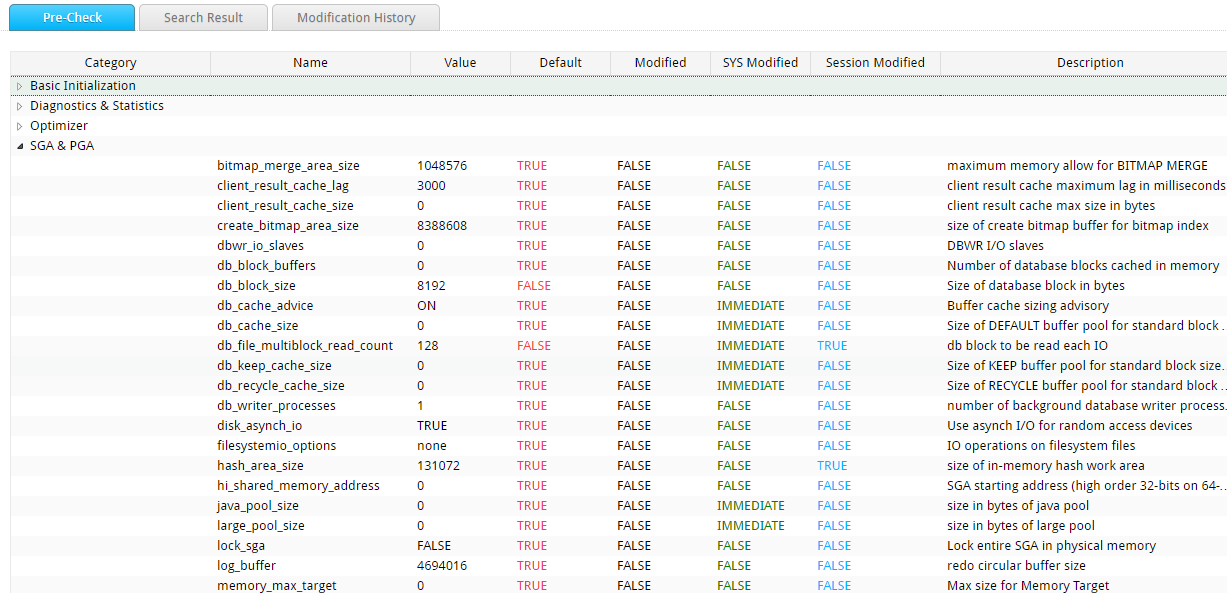
Grid Column
| Column Name | Description |
| Category | Category Name (A column provided in MaxGauge) |
Note. Except for the Category, please reference the Oracle Manual for all other remaining columns. https://docs.oracle.com/cd/B28359_01/server.111/b28320/dynviews_2085.htm#REFRN30176
Grid Mouse Right-Click Menu
The mouse right-click menu is as follows. For more information, please reference “Appendix. Grid Mouse Right-Click Menu UI”.
| Item | Description |
| Export Excel | Downloads the grid content on an excel file. |
| Copy(To Clipboard) | Makes a copy of the grid content. |
| Show/ Hide Columns | Selects the columns to be displayed on the grid. |
| Expand All | Shows the expanded entire tree structure. (Parent and Child Output) |
| Collapse All | Shows the collapsed tree structure. (Only Parent Output) |
| Row Expand | Only expands the corresponding row in the Collapsed All state. |
| Row Collapse | Only collapses the corresponding row in the Expand All state. |
| Save Image | Saves the grid content as an image. |
SUB) Search Result Tab Explanation
Provides the parameter information which applies to the search conditions.
Window Configuration
The window configuration is as follows.
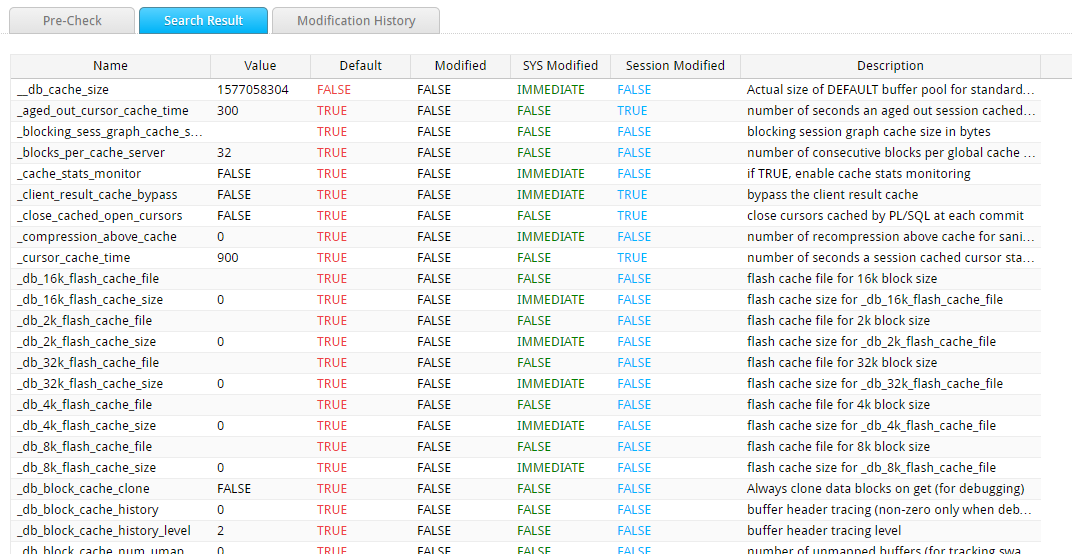
Grid Column
Note. For information about the columns, please reference the Oracle Manual. https://docs.oracle.com/cd/B28359_01/server.111/b28320/dynviews_2085.htm#REFRN30176
Grid Mouse Right-Click Menu
The mouse right-click menu is as follows. For more information, please reference “Appendix. Grid Mouse Right-Click Menu UI”.
| Item | Description |
| Export Excel | Downloads the grid content on an excel file. |
| Copy(To Clipboard) | Makes a copy of the grid content. |
| Show/ Hide Columns | Selects the columns to be displayed on the grid. |
| Filter On | Enables the Filtering function. |
| Multiple Sort On | Sorts based on 2 or more column values. |
| Save Image | Saves the grid content as an image. |
SUB) Modification History Tab Explanation
Provides the parameter modification history by date.
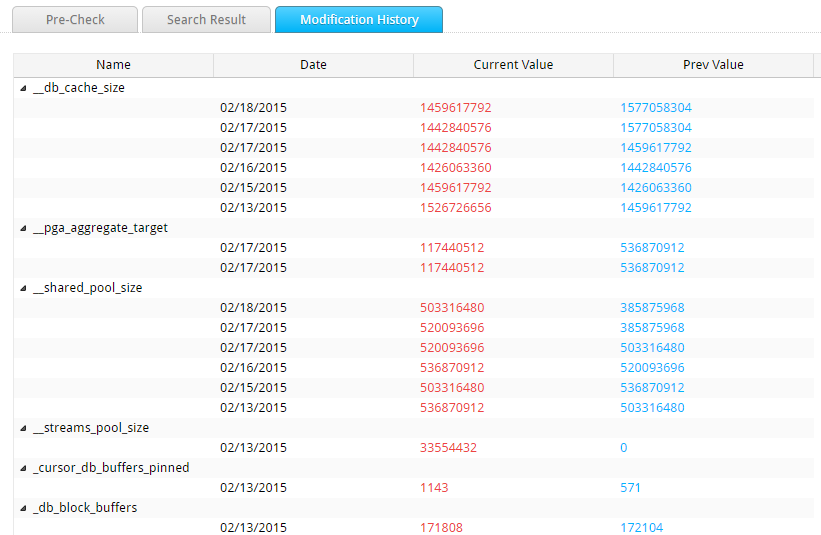
Grid Column
| Column Name | Description |
| Name | Parameter Name |
| Date | Parameter Modified Date |
| Current Value | Post-modification Value |
| Prev Value | Pre-modification Value |
Grid Mouse Right-Click Menu
The mouse right-click menu is as follows. For more information, please reference “Appendix. Grid Mouse Right-Click Menu UI”.
| Item | Description |
| Export Excel | Downloads the grid content on an excel file. |
| Copy(To Clipboard) | Makes a copy of the grid content. |
| Show/ Hide Columns | Selects the columns to be displayed on the grid. |
| Expand All | Shows the expanded entire tree structure. (Parent and Child Output) |
| Collapse All | Shows the collapsed tree structure. (Only Parent Output) |
| Row Expand | Only expands the corresponding row in the Collapsed All state. |
| Row Collapse | Only collapses the corresponding row in the Expand All state. |
| Save Image | Saves the grid content as an image. |
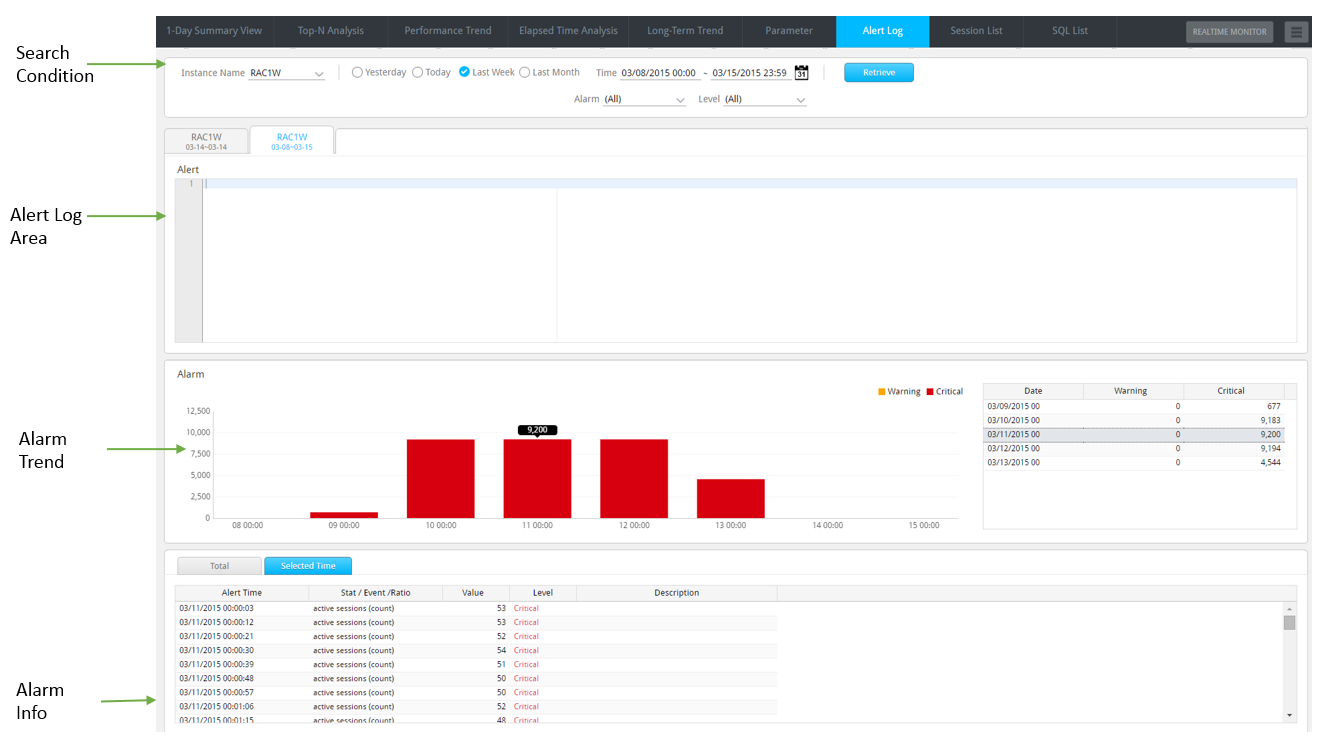
Alert Log
SUB) Overview
Provides the details of the Oracle alert log and alarm generation history.
SUB) Window Configuration
The window configuration is as follows.
SUB) Search Condition
| Search Condition | Description |
| |
Selects the target instance for analysis. For selection convenience, the autocomplete function is available. |
| |
Sets the analysis date for yesterday. (Default Value) |
| |
Sets the analysis date for today. |
| |
Sets the analysis period for the last 1 week. |
| |
Sets the analysis period for the last 1 month. |
| |
You can either enter the analysis date, or select the date from the calendar UI. |
SUB) Alert Log Area
Provides the Oracle Alert Log generation history.
SUB) Alarm Trend
Provides the the number of times each indicator’s threshold value set in the Configuration Window satifies the conditions, in an hourly trends graph and grids.
SUB) Alarm Info
Provides the Alarm history.
- Total Tab: Provides the entire history of alarms generated within the analysis period.
- Seleted Time Tab: Provides the alarm history for the time selected from the bar graph or the grid in the Alarm Trend.
SUB) Alarm Info Grid Column
| Column Name | Description |
| Name | Parameter Name |
| Date | Parameter Modification Date |
| Current Value | Post-Modification Value |
| Prev Value | Pre-Modification Value |
SUB) Alarm Info Grid Column Mouse Right-Click Menu
| Item | Description |
| Export Excel | Downloads the grid content on an excel file. |
| Copy(To Clipboard) | Makes a copy of the grid content. |
| Show/ Hide Columns | Selects the columns to be displayed on the grid. |
| Filter On | Enables the Filtering function. |
| Multiple Sort On | Sorts based on 2 or more column values. |
| Save Image | Saves the grid content as an image. |
Session List
SUB) Overview
Provides the session search function.
SUB) Window Configuration
The window configuration is as follows.
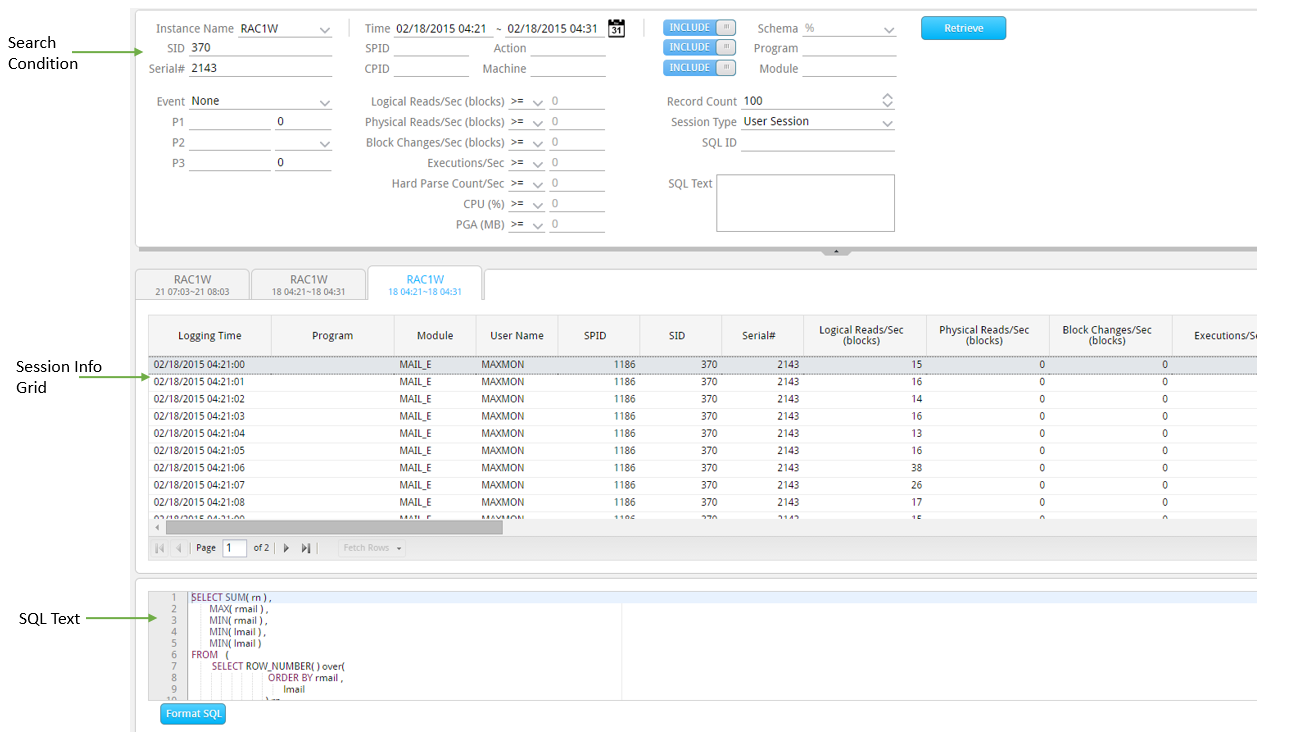
SUB) Search Condition
| Search Condition | Description |
| |
Selects the target instance for analysis. For searching convenience, autocomplete function is available. |
| |
Sets the analysis date for yesterday. |
| |
Sets the analysis date for today. |
| |
You can either enter the analysis date, or select the date from the calendar UI.
|
| SID | Enter the SID.
|
| Serial# | Enter the Serial#. |
| Record Count | Set the Fetch count.
|
| Session Type | Select the session type. (User Session or Background Session)
|
| SQL ID | Enter the Oracle SQL ID.
|
| SQL Text | Enter a part of the SQL Text. The search rules are as follows.
|
SUB) Session Info Grid Column
Provides the active session information taken once per second.
| Column Name | Description |
| Logging Time | Session Information Logging Time |
| SID | Session Identifier |
| Program | Program |
| Module | Module Name
|
| User Name | Oracle User Name |
| SPID | Server Process ID |
| CPU (%) | CPU Usage (%) |
| Elapsed Time (Sec) | Time elapsed from the start of SQL execution until now |
| Event Name | The name of event name currently waiting |
| Logical Reads/Sec (blocks) | Memory I/O Blocks Count (Value/sec) |
| Physical Reads/Sec (blocks) | Disk I/O Blocks Count (Value/sec) |
| Block Changes/Sec (blocks) | Changed Blocks Count (Value/sec) |
| Executions/Sec | SQL Text Execution Count (Value/sec) |
| Hard Parse Count/Sec | Hard parsing Count (Values/sec) |
| Parse Count Total/Sec | Parsing Count (Value/sec) |
| Open Cursors | Number of cursors currently open (Current value) |
| Undo Blocks | Number of Undo Blocks used during the transaction. (Value/Sec) |
| Undo Records | Number of Undo Record generated during the transaction (Value/Sec) |
| Undo Seg.ID | Undo Segment ID being used by the transaction |
| PGA (MB) | Size of PGA currently in use |
| Machine | Machine Name |
| Process MEM (MB) | Process’ Physical Memory Size |
| SQL Text | SQL Text currently being executed |
| Prev SQL Text | Previous SQL Text |
| SQL ID | Oracle SQL ID |
| Prev SQL ID | Oracle Previous SQL ID |
| Status | Session Status |
| P1 | Indicates the P1 value of the wait event. |
| P2 | Indicates the P2 value of the wait event. |
| P3 | Indicates the P3 value of the wait event. |
| Wait SEQ | Indicates the value equivalent to V$SESSION_WAIT.SEQ# column. |
| Wait Time | Indicates the value equivalent to V$SESSION_WAIT.WAIT_TIME column. |
| Seconds In Wait | Indicates the value equivalent to V$SESSION_WAIT.SECONDS_IN_WAIT column. |
| Action | Action Name |
| Client Identifier | Client Identifier |
| Client Info | Displays the information that it has been set as DBMS_APPLICATION_INFO.SET_CLIENT_INFO procedure |
| PQ Owner Inst ID | PQ coordinator session’s Instance ID |
| PQ Owner Inst SID | PQ coordinator SID |
| Action | Action Name |
| Row Wait File | Indicates the value equivalent to V$SESSION.ROW_WAIT_FILE#. |
| Row Wait Obj | Indicates the value equivalent to V$SESSION.ROW_WAIT_OBJ#. |
| Row Wait Block | Indicates the value equivalent to V$SESSION.ROW_WAIT_BLOCK#. |
| SQL Plan Hash | Plan hash Value |
| Command Type | SQL Type (SELECT, INSERT, DELETE, UPDATE, CREATE, and etc.) |
| Schema | Schema Name |
| Logon Time | Session Login Time |
| Session Type | Session Type (USER, BACKGROUND, and etc.) |
| Logical Reads (Sigma) | Memory I/O Blocks Count (Cumulative Value) |
| Physical Reads (Sigma) | Disk I/O Blocks Count (Cumulative Value) |
| Block Changes (Sigma) | Changed Blocks Count (Cumulative Value) |
| Executions (Sigma) | SQL Text Execution Count (Cumulative Value) |
| Hard Parse Count (Sigma) | Hard parsing Count (Cumulative Value) |
| Parse Count Total (Sigma) | Parsing Count (Cumulative Value) |
| SQL Address | SQL Text Address Value |
| OS User | OS User Name |
| Serial | Session Serial Number |
| CPID | Client Process ID |
SUB) Session Info Grid Column Mouse Right-Click Menu
The mouse right-click menu is as follows. For more information, please reference “Appendix. Grid Mouse Right-Click Menu UI”.
| Item | Description |
| Fetch Rows | Fetches the next records. The following option items are available.
|
| Session Detail | Provides the details of session history.
|
| SQL Detail | Provides the details of SQL execution history.
|
| Full SQL Text | Provides SQL Full Text. |
| Prev SQL Text | Provides the Previous SQL Full Text. |
| Long-Term Trend | Connects to Long-Term Trend window for the corresponding SQL.
|
| Export Excel | Downloads the grid content on an excel file. |
| Copy(To Clipboard) | Makes a copy of the grid content. |
| Show/ Hide Columns | Selects the columns to be displayed on the grid. |
| Filter On | Enables the Filtering function. |
| Multiple Sort On | Sorts based on 2 or more column values. |
| Save Image | Saves the grid content as an image. |
SUB) SQL Text
Provides the SQL Full Text of the record selected in the Session Info Grid.
SQL List
SUB) Overview
Provides the SQL search function.
SUB) Window Configuration
The window configuration is as follows.
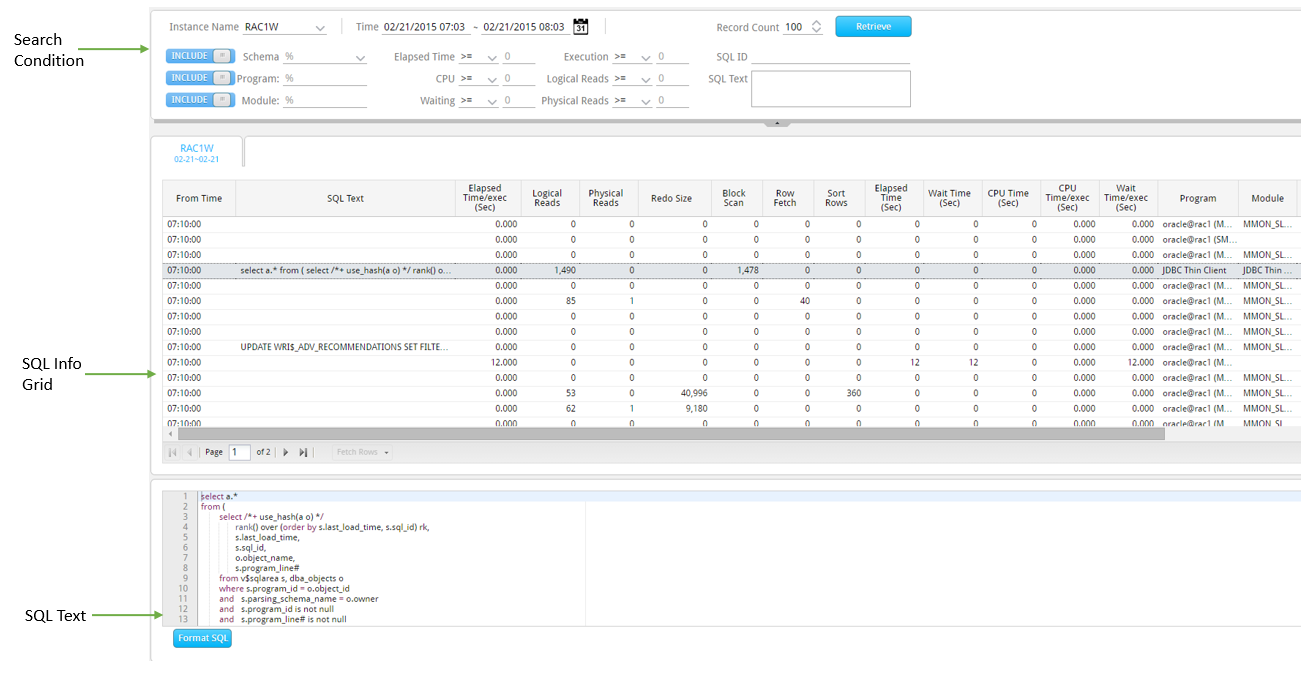
SUB) Search Condition
| Search Condition | Description |
| |
Selects the target instance for analysis. For searching convenience, autocomplete function is available. |
| |
Sets the analysis date for yesterday. (Default Value) |
| |
Sets the analysis date for today. |
| |
You can either enter the analysis date, or select the date from the calendar UI.
|
| Record Count | Set the Fetch count.
|
|
|
Include / Exclude Toggle Button
|
| |
Select Shema using the Combo box. You can choose 2 or more Schemas by clicking the items in the Combo Box.
|
|
Enter the target Program Name and Module Name for analysis (or for exclusion). The input rules are as follows.
For example, if you want to search the programs whose Program Name is “JDBC Thin Client”, “SQL Plus”, then enter the keywords as “thin,sql”. |
| Executions | SQL Text Execution Count |
| Elapsed Time/exec (Sec) | SQL Elapsed Time (Average Per One Time) |
| CPU Time/exec (Sec) | CPU Time (Average Per One Time) |
| Logical Reads/exec (blocks) | Logical IO (Average Per One Time) |
| Physical Reads/exec (blocks) | Physical IO (Average Per One Time) |
| SQL ID | Enter the Oracle SQL ID.
|
| SQL Text | Enter a part of the SQL Text. The search rules are as follows.
|
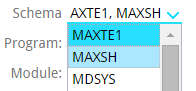
SUB) SQL Info Grid Column
| Column Name | Description |
| From Time | 10 minute summary information collection time.
|
| Schema | Schema Name |
| Program | Program Name |
| Module | Module Name |
| SQL Text | SQL statement |
| SQL ID | Oracle SQL ID |
| SQL Plan Hash | SQL Plan hash |
| Executions | Execution Count (Sum) |
| Elapsed Time (%) | The ratio of corresponding SQL’s Elapsed Time out of the total Elapsed Time of all the SQLs executed in the selected Top-N items. |
| CPU Time (%) | The ratio of corresponding SQL’s CPU Time out of the total CPU Time of all the SQLs executed in the selected Top-N items. |
| Elapsed Time (Sec) | The corresponding SQL’s Elapsed Time (Sum) |
| Elapsed Time/exec (Sec) | The corresponding SQL’s Elapsed Time (Average Per Execution) |
| CPU Time (Sec) | The corresponding SQL’s CPU Time (Sum) |
| CPU Time/exec (Sec) | The corresponding SQL’s CPU Time (Average Per Execution) |
| Logical Reads (blocks) | The corresponding SQL’s Memory IO (Sum) |
| Physical Reads (blocks) | The corresponding SQL’s Physical IO (Sum) |
| Redo Size (byte) | Redo amount generated upon executing the corresponding SQL (Sum)
Unit: Bytes |
| Sort Disk (count) | The number of times the corresponding SQL has executed the disk sort (Sum) |
| Sort Rows | The number of records the corresponding SQL has performed sorting (Sum) |
| Table Fetch By Rowid (count) | The number of times the corresponding SQL has accessed the table by using the ROWID. (Sum)
|
| Table Fetch Continued By Rowid (count) | The number of times the corresponding SQL has accessed 2 or more blocks to fetch one record. (Sum) |
| Table Scan Blocks Gotten (block) | The number of blocks accessed by the corresponding SQL at the time of scan operation (Table Full Scan, Index Full Scan, and Index Fast Full Scan). (Sum) |
| Table Scan Rows Gotten (row) | The number of records accessed by the corresponding SQL at the time of scan operation (Table Full Scan, Index Full Scan, and Index Fast Full Scan) (Sum) |
SUB) SQL Info Grid Column Mouse Right-Click Menu
The mouse right-click menu is as follows. For more information, please reference “Appendix. Grid Mouse Right-Click Menu UI”.
| Item | Description |
| Fetch Rows | Fetches the next records. The following option items are available.
|
| Session Detail | Provides the details of session history.
|
| SQL Detail | Provides the details of SQL execution history.
|
| Full SQL Text | Provides SQL Full Text. |
| Long-Term Trend | Connects to Long-Term Trend window for the corresponding SQL.
|
| Export Excel | Downloads the grid content on an excel file. |
| Copy(To Clipboard) | Makes a copy of the grid content. |
| Show/ Hide Columns | Selects the columns to be displayed on the grid. |
| Filter On | Enables the Filtering function. |
| Multiple Sort On | Sorts based on 2 or more column values. |
| Save Image | Saves the grid content as an image. |
SUB) SQL Text
Provides the SQL Full Text for the records selcted in the SQL Info Grid.