
MaxGague is a software that provides various functions essential for database performance management such as real time monitoring, diagnosis and analysis, and performance tuning for database systems.
The following are the main functions which MaxGague provides.
MaxGauge’s agent uses the SGA Direct Access method for data collection which minimizes the load.
Note. With the SGA Direct Access method, data can be collected even in a DB hang mode.
The quickest way to check the current status of a database system is by checking the trends of main performance indicators. In other words, for DBMS performance monitoring, you need to check the trends of main performance indicators such as the system CPU usage (%), I/O generated in the database, SQL execution count, the number of sessions currently in active state and the wait time of wait events. And for this reason, the data which MaxGauge collects are as follows:
One of the important things in database performance monitoring is the ability to easily check the sessions and OS processes that are currently running or in waiting from various points of view. As for such, the types of monitoring and analysis which MaxGauge provides are as follows:
MaxGauge offers a function in which you can see the SQL elapsed time distribution chart, which provides the elapsed time of all SQLs being executed in the database system in a distribution chart format.
Among the numerous applications and SQLs being executed in a complex work environment, identifying the cause of the bottleneck which is slowing down the application performance and verifying the malicious SQL in a quick and accurate manner are very critical. MaxGauge clearly analyzes the cause of application’s performance delay through an OWI-based performance analysis methodology. It also provides a function which quickly tracks down the cause of the individual SQL’s performance delay by checking the real time execution plan.
MaxGauge employs an architecture which stores up all the performance data in the repository in real time. Therefore, in the event you are trying to closely analyze the performance degradation discovered during real time monitoring, you can immediately connect with the performance analysis window.
In order to build a pro-active monitoring environment, one of the essential components is an effective alarm setting function. MaxGauge not only offers alerts for various performance items but also provides the SMS (Short Message Service) connection function. The items for which you can set up the alerts in MaxGauge are as follows:
Note. Reference the “MaxGauge Configuration Manual” for further information regarding the SMS connection function.
MaxGauge’s agent collects the workload information of SQLs executed by the active sessions at 20 times per second (maximum 100 times per second) by polling method. The workload information which the MaxGauge agent collects is as follows:
One of the advantages of data visualization is that it provides convenience for analysis through the “visualization” technique. In the event of analyzing multiple dates or multiple instances simultaneously, MaxGauge provides views which have applied the “data visualization” technique. The visualization techniques that have been applied in MaxGauge are as follows:
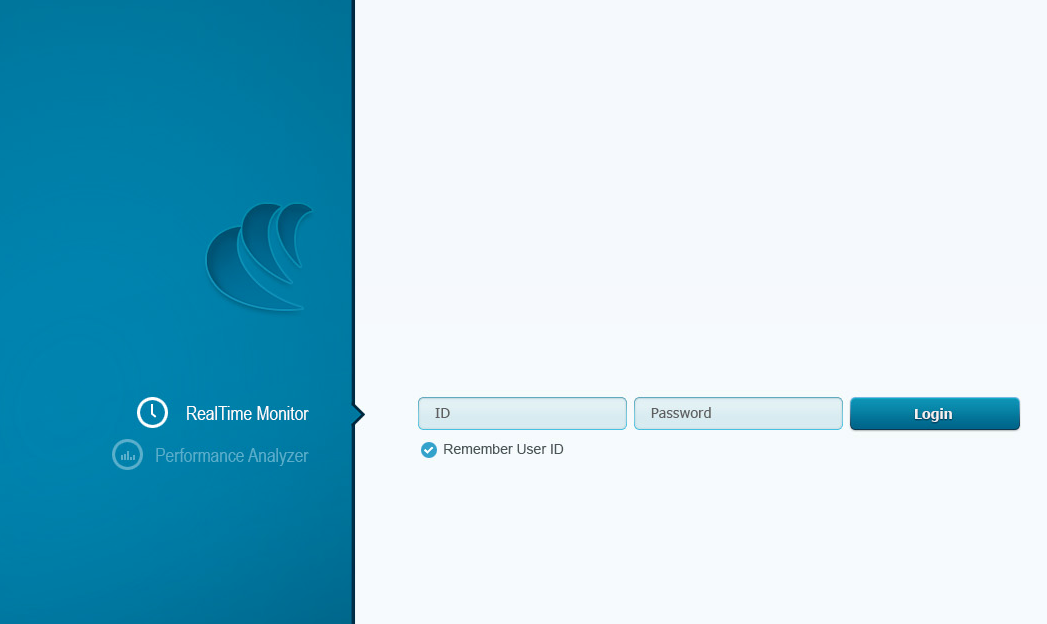
To get started on the task of performance management with MaxGauge, enter the MaxGague web address into the web browser.
![]()
Note. IP is the IP of the server in which one of MaxGauge’s components, platform.JS, is located. The Port is port the platform.JS uses. Please reference “MaxGauge Admin Manual” for information regarding MaxGauge architecture.
The initial window will appear as follows.
| Item | Description |
| |
Use the Connection Manager Window and go through the process of selecting the target instance for monitoring. |
| |
Connect to the Performance Analyzer. |
Note. MaxGauge ID and password are case-sensitive. Reference the “MaxGauge Configuration Manual” regarding user account management.
Enter the MaxGauge ID and password. The default ID and password are as follows.
| ID | Default Password | Permission |
| admin | manager | Super User |
Note. MaxGauge ID and password are case-sensitive. Reference the “MaxGauge Configuration Manual” regarding user account management.
The connection manager is used in the startup stage for selecting the target instance for monitoring. Even after the connection set up is complete, you can use the Connection Manager icon ![]() to change the target instance for monitoring.
to change the target instance for monitoring.
The initial window configuration is as follows.
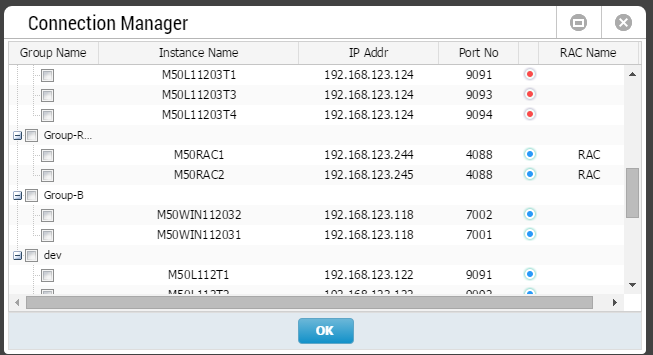
| Column Name | Description |
| Group Name | Group Name |
| Instance Name | Instance Name |
| Business Name | Work Name |
| IP Address | DB Server IP |
| Port No | MaxGauge Agent (RTS) Port# |
| RTS Status | MaxGauge Agent (RTS) Status |
| DB Status | DB Status |
| RAC Name | RAC Group Name |