
Overview
Provides the function through which you can quickly diagnose the issues discovered in the event of real time monitoring. The items that may be diagnosed through the Real Time Diagnostics Window are as follows.
- List of individual SQLs executed during the CPU Peak period.
- List of long running SQL
- List of active sessions executed during the resource peak period
- Lock Tree
Note. A quick diagnosis of the resource peak period is the sole purpose of Real-Time Diagnostics. For more detailed performance analysis, you need to use the Performance Analyzer.
Get Started
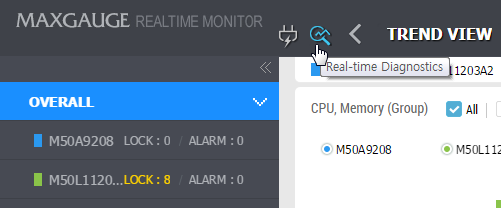
Click on the Real-Time Diagnostics icon.
Window Configuration & UI
The window configuration is as follows.
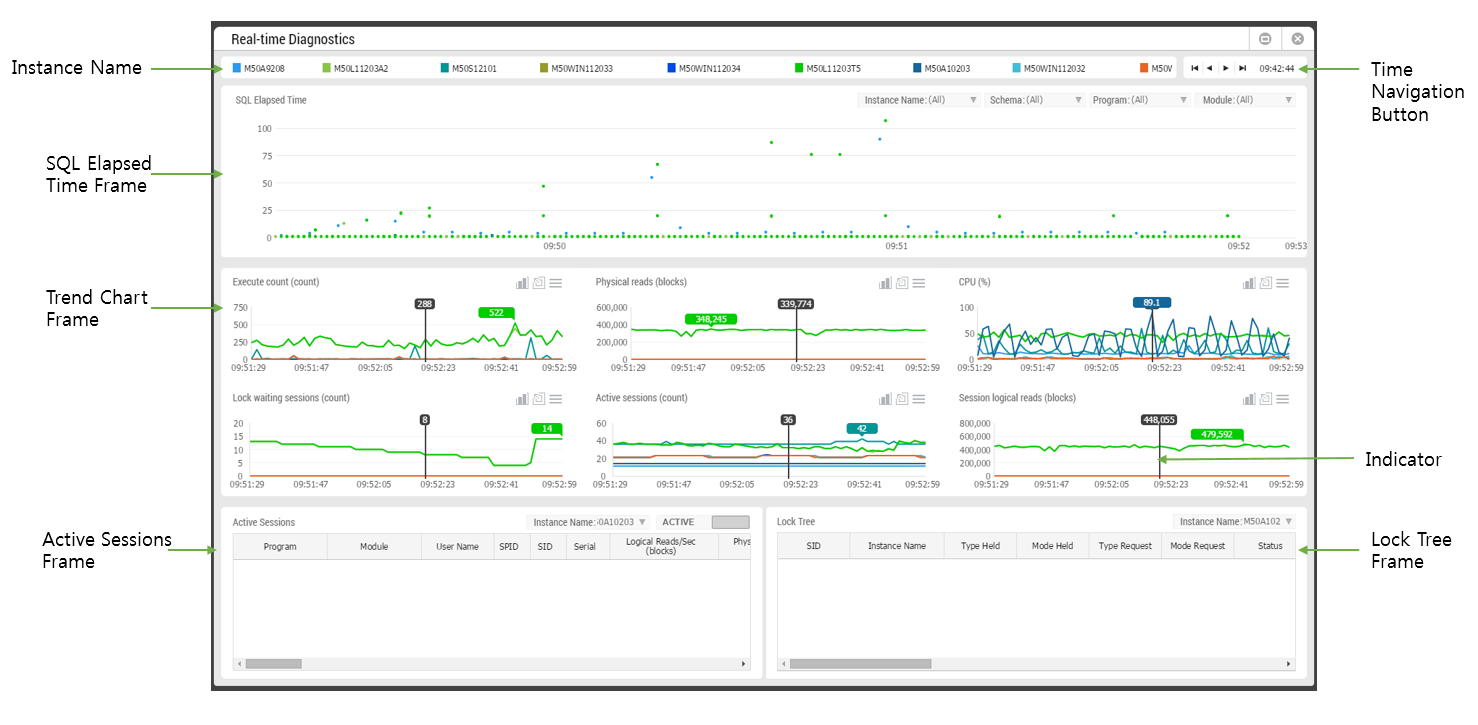
SUB) Instance Name
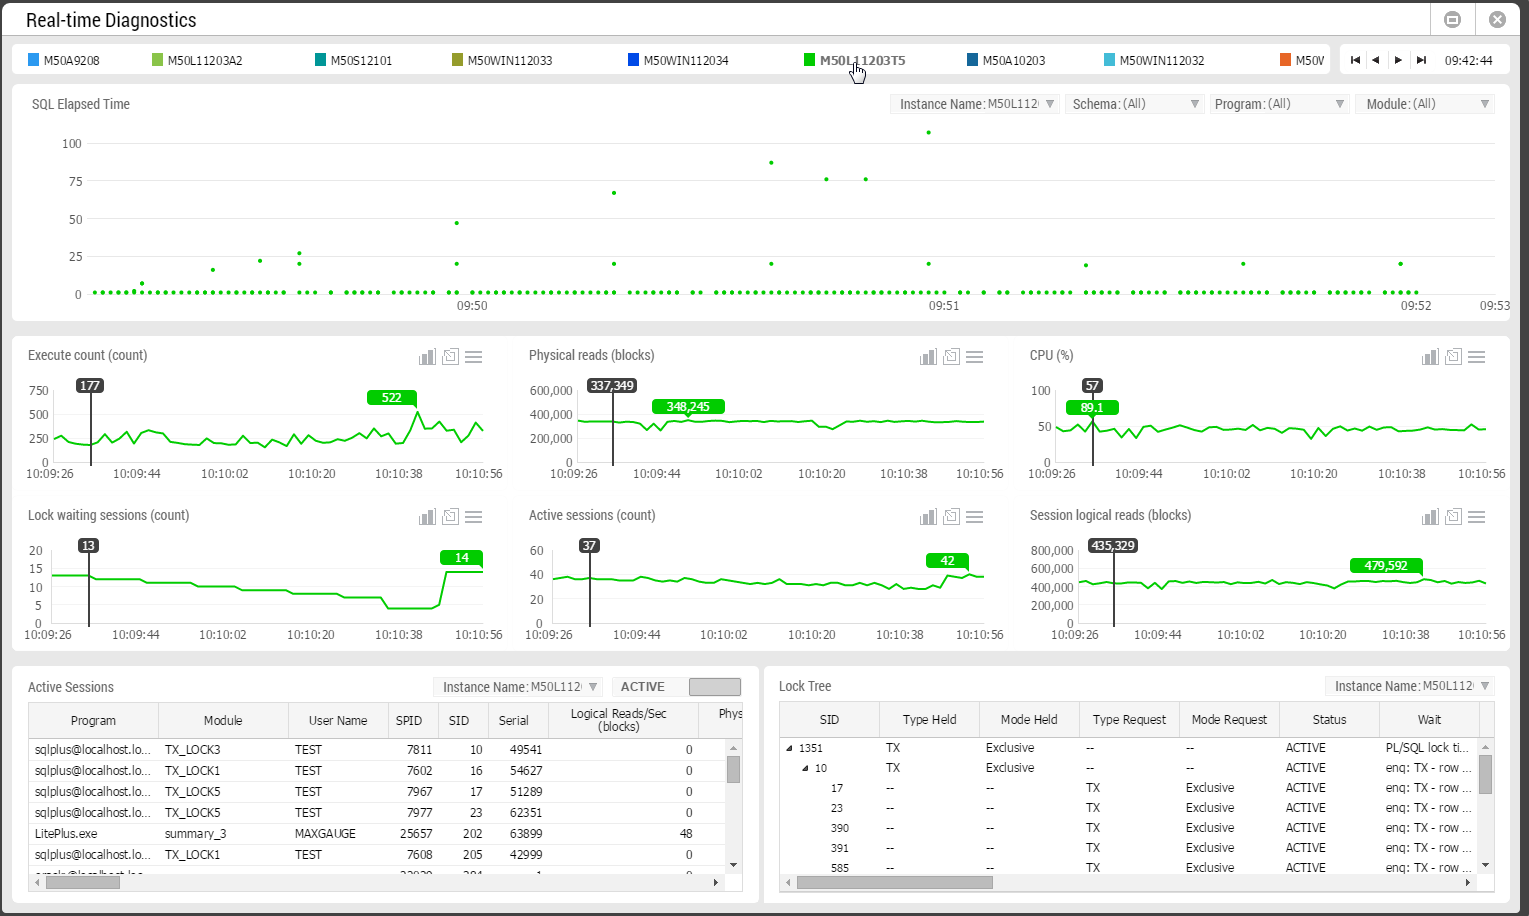
The Instance Name provides a list of all the instances currently being monitored. When you click on the Instance Name, only the information of the corresponding instance will be output on the SQL Elapsed Time Frame and Trend Chart Frame, the item in the combo box within the ActiveSessions Frame and the Lock Tree Frame will be changed to the corresponding instance. Once you click on a particular instance within the Instance Name Area, the screen will appear as follows.
SUB) SQL Elapsed Time Frame
Please reference “Chapter 6 SQL Elapsed Time Frame” section.
SUB) Trend Chart Frame
Basic Function
The basic function is the same as the Trend Chart Frame. For more information, please reference “Chapter 4 Trend Chart Frame” section.
Add Function
The Add Function allows you to move the point of analysis to a different time with a mouse double-click. The Active Sesions Frame and Lock Tree Frame output the information of the corresponding time point.
UI
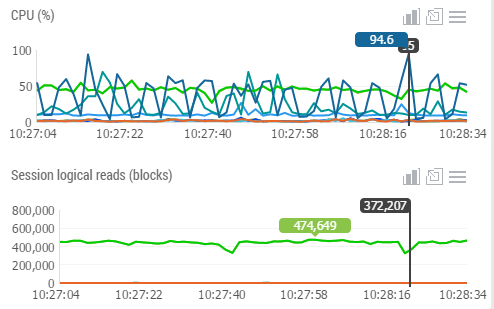
When the Real-Time Diagnostics Window pops up, the Indicator position will automatically move to the point at which the CPU (%) is the highest. The Help black balloon will display the performance indicator value. The balloon of the same color as the Instance displays the corresponding indicator’s peak value, and the color helps to easily identify which instance has generated a peak.
SUB) Active Sessions Frame
Please reference “Chapter 5 Active Sessions Frame” section.
Active Sessions Frame among the Grid mouse right-click menu and other items.
It provide the SQL Detail instead of View SQL
| Item | Description |
| Session Detail | It connects to the PA of the Session Detail Window. For more details, please reference “MaxGauge User Manual-PA”. |
| SQL Detail | It connects to the PA of the SQL Detail Window. For more details, please reference “MaxGauge User Manual-PA”. |
SUB) Lock Tree Frame
Please reference “Chapter 5 Lock Tree Frame” section.
The items in Grid Mouse Right-Click Menu which are different from the Lock Tree Frame
Provides the SQL Detail item insteand of the View SQL.
| Item | Description |
| Session Detail | Connects to PA’s Session Detail Window. For more information, please reference the “MaxGauge User Manual – PA”. |
| SQL Detail | Connects to PA’s SQL Detail Window. For more information, please reference “MaxGauge User Manual – PA”. |