3.MaxGauge Main Features
MaxGauge Main Screen Configuration
( Multi Real-time View )
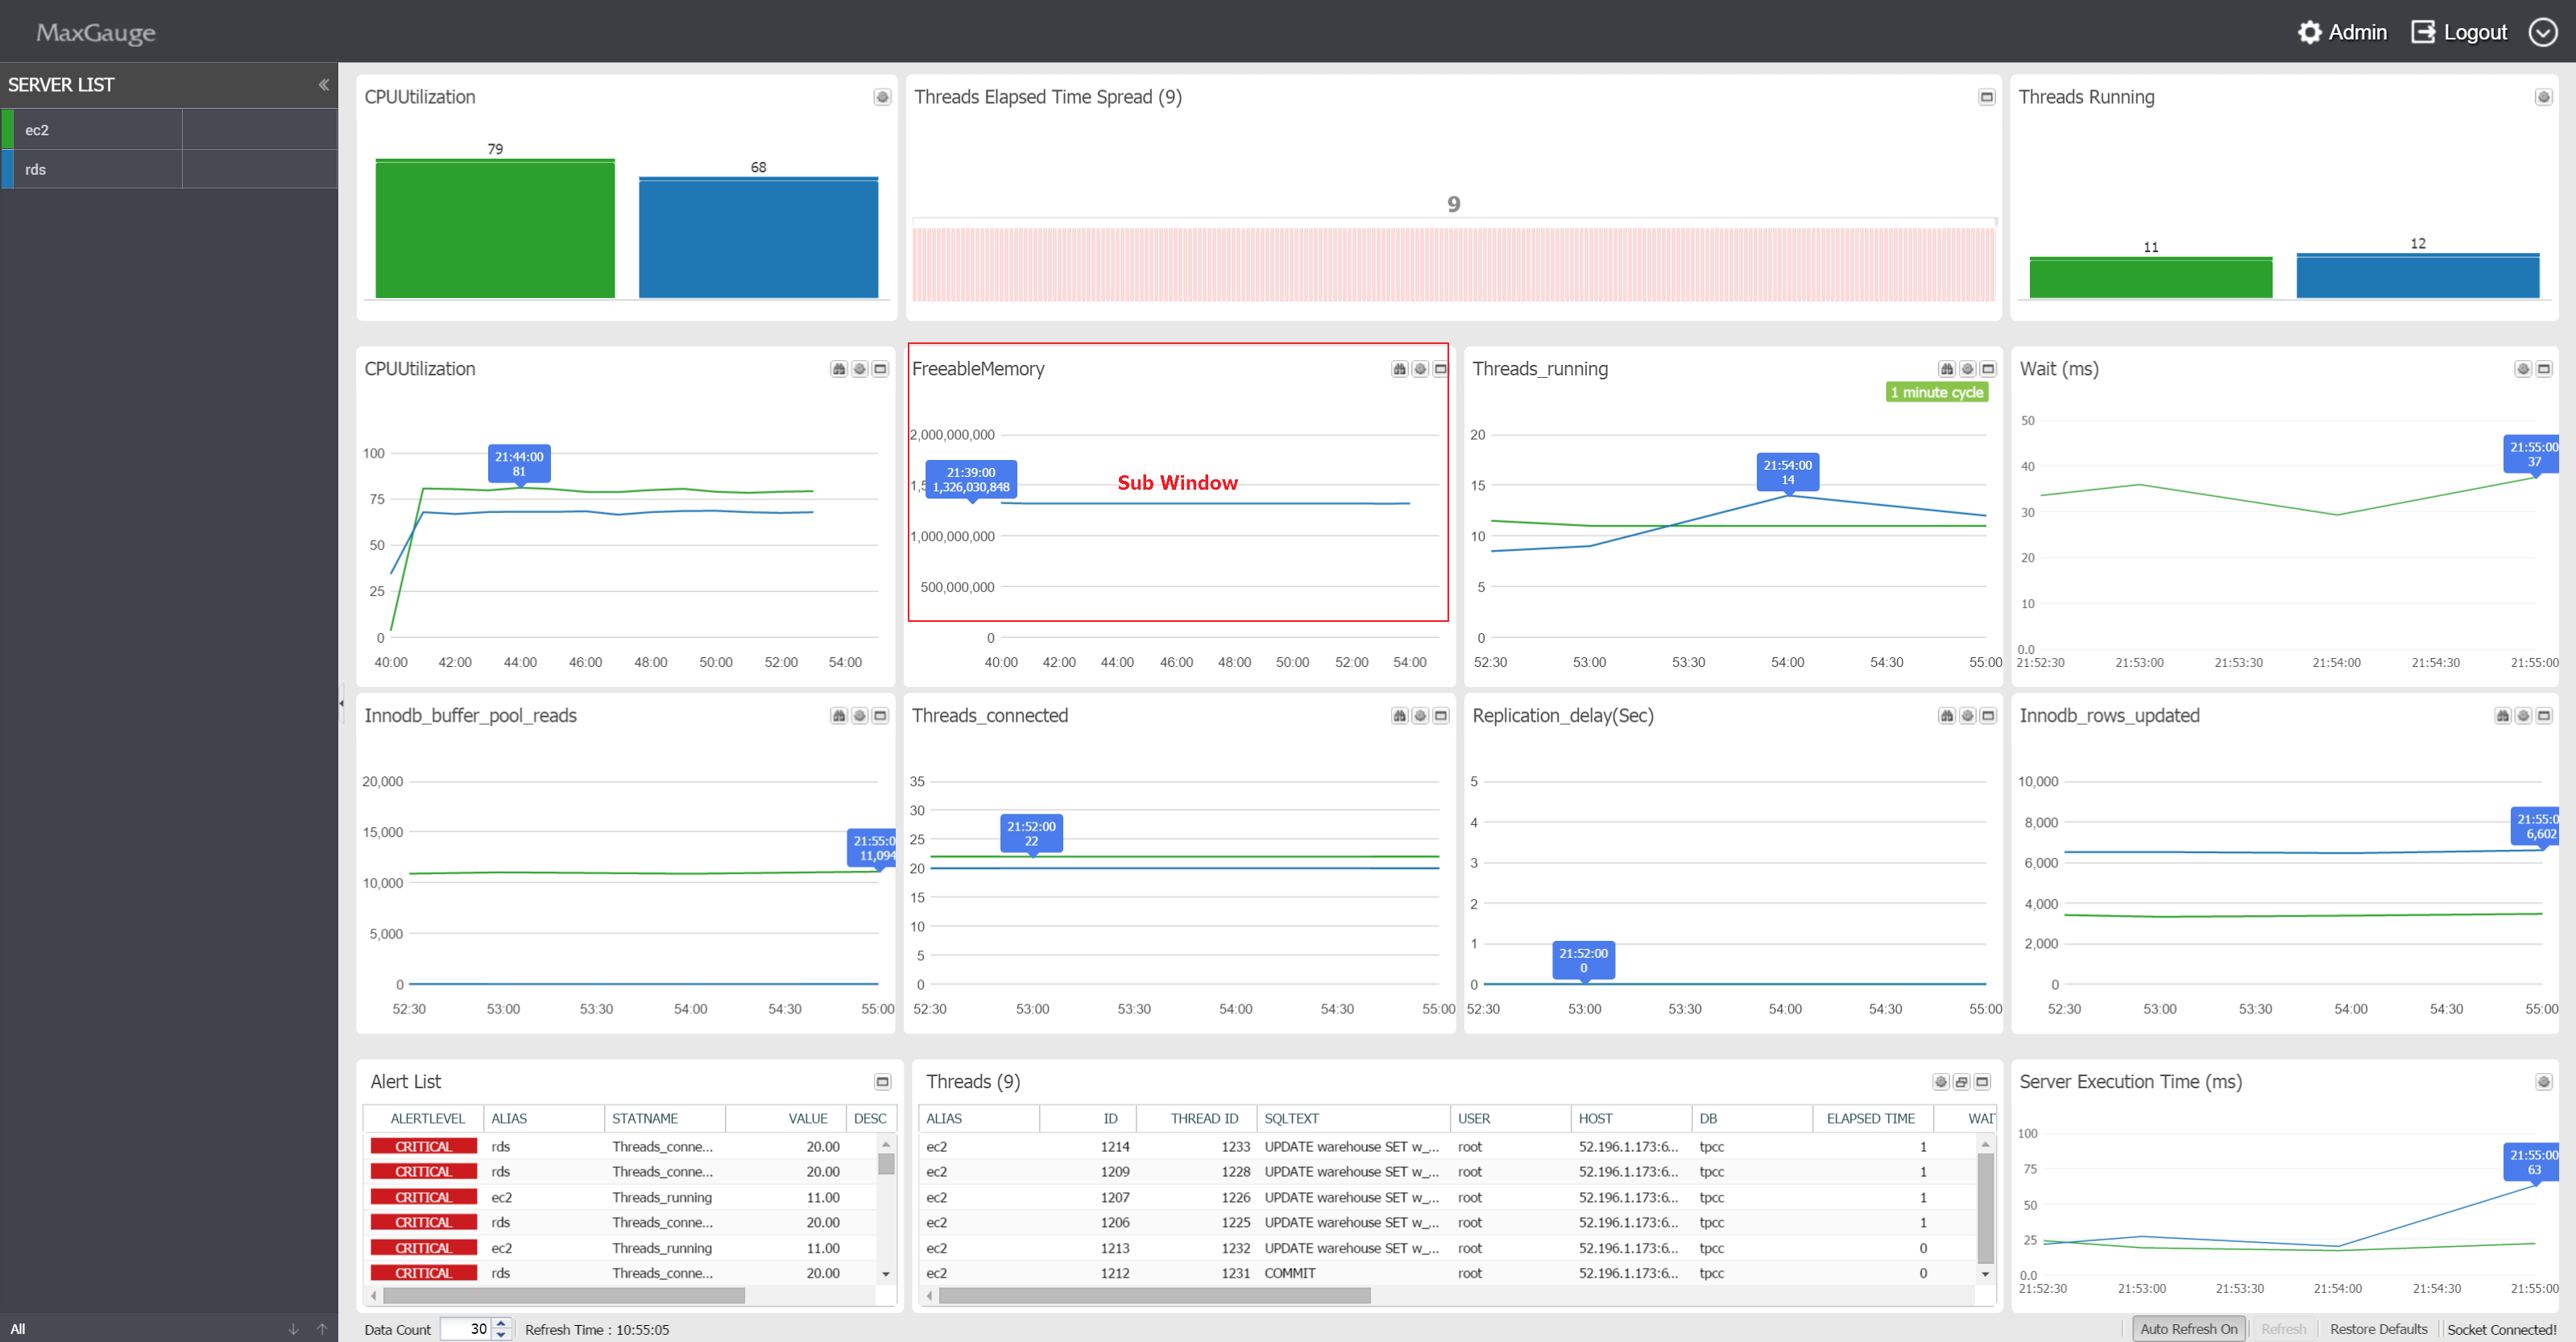
MaxGauge’s main screen monitors the performance issues of multiple MySQL database simultaneously, from the system’s overall perspective on a single screen, to ensure quick and effective real-time performance management of MySQL database.
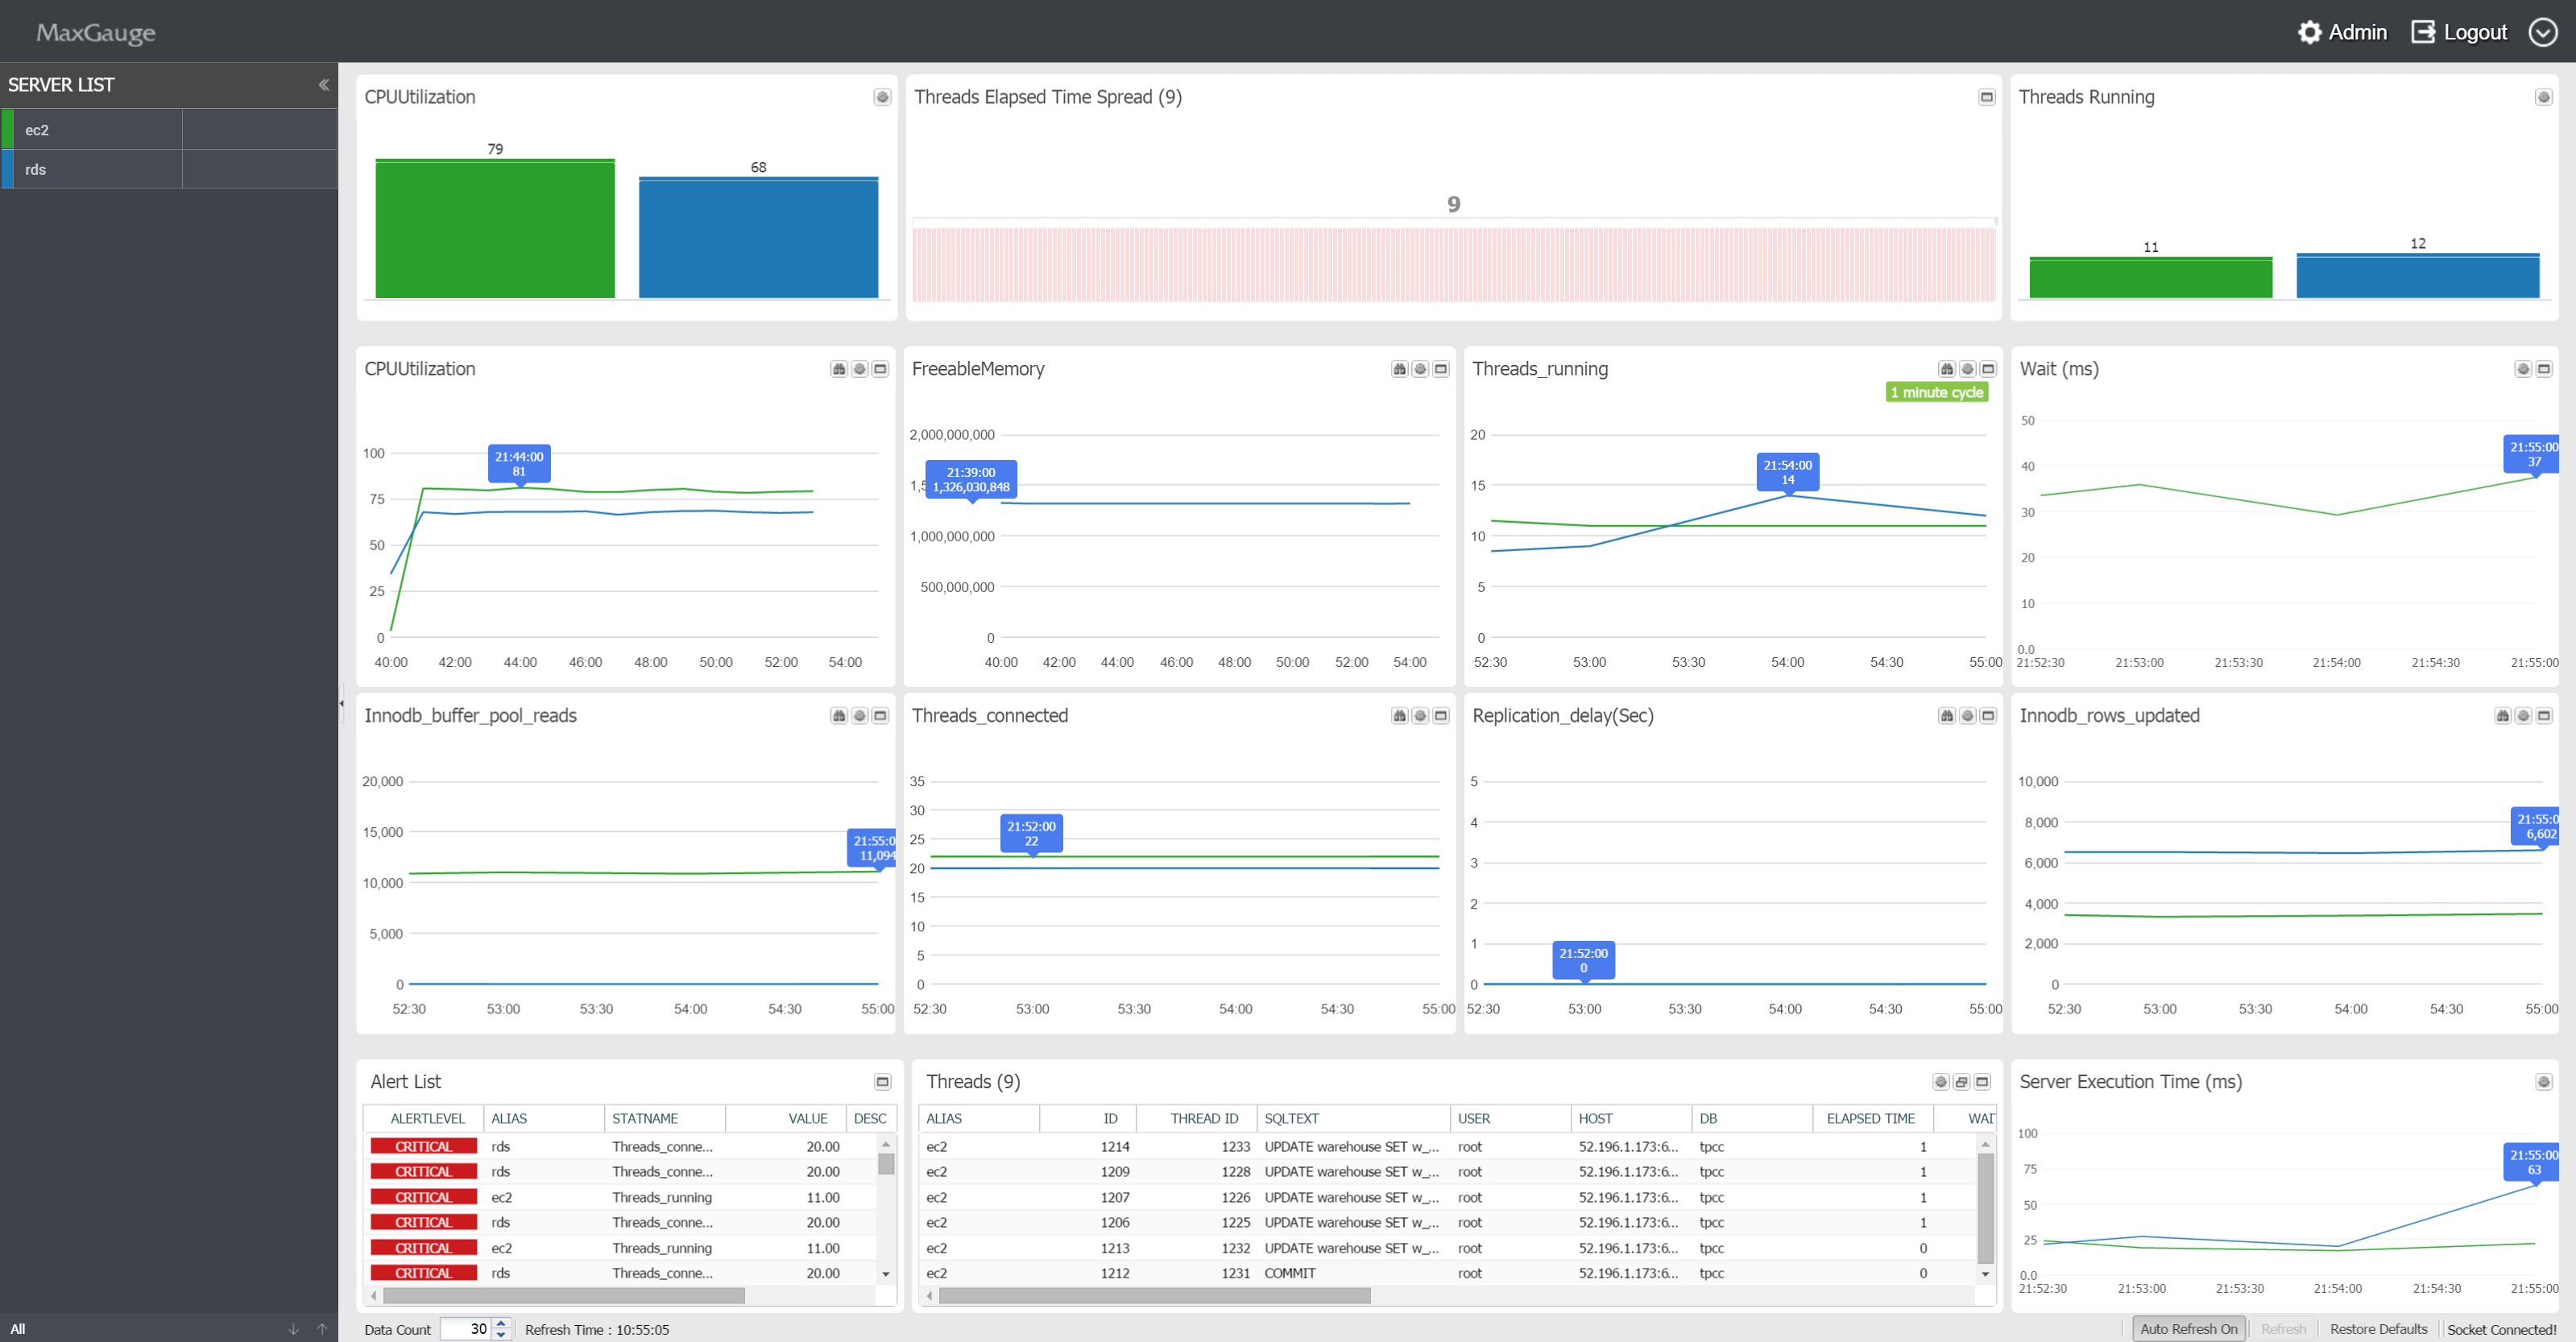
MaxGauge For MySQL’s DBMS performance information collects data using the query method, and you can immediately start monitoring after installation without the database’ downtime. Also, through the integrated monitoring of multiple databases on a single screen, in the case of performance degradation and faillures in the database, you can quicklly and effectively trace the the session and the SQL identified as the root cause of the problem.
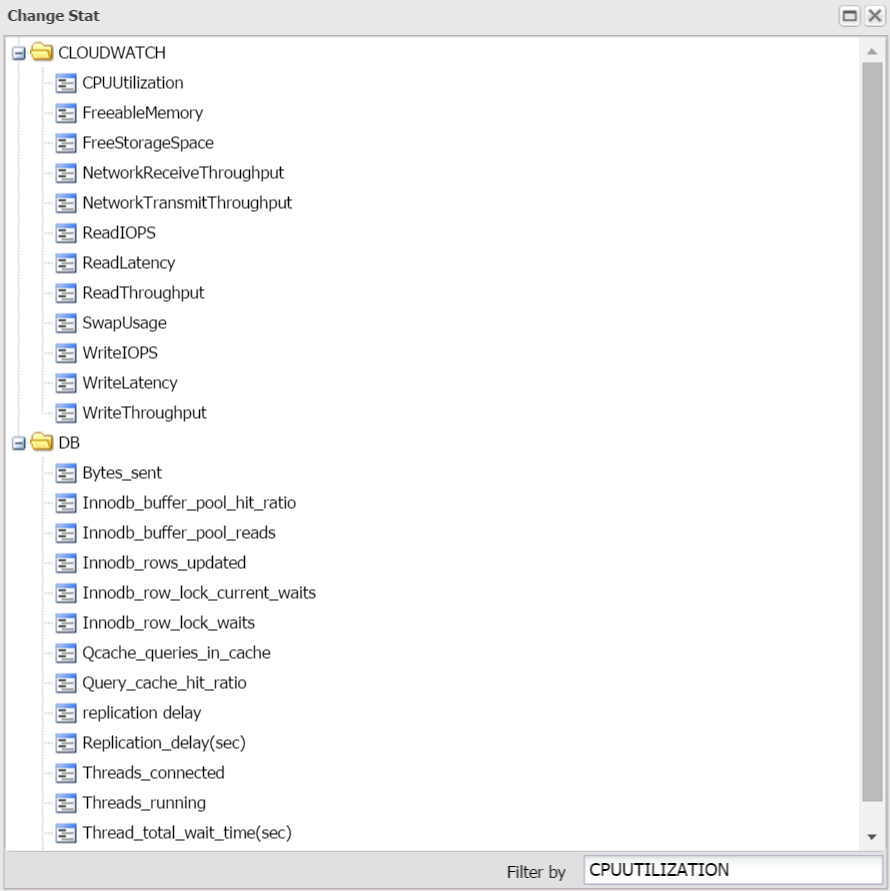
To Change the Monitoring Indicator Items
- The monitoring indicators displayed on MaxGauge’s Multi Monitor Area may be changed according to user’s preference. To change the items, click on the
 button on the right.
![]() View the 24Hour trends of the current day.
View the 24Hour trends of the current day.
![]() Change the viewing chart format.
Change the viewing chart format.
![]() View more details in a pop-up.
View more details in a pop-up.
- Outputs a list of items you can change. Click the indicator you wish to change.
MAXGAUGE FOR MYSQL transmits only the pre-selected indicators to the Real-Time View. If you do not need to change the indicators, go to ADMIN > Stat > Stat Info and change to Yes for Use, and you will be able to use the corresponding indicators on the Real-Time View.
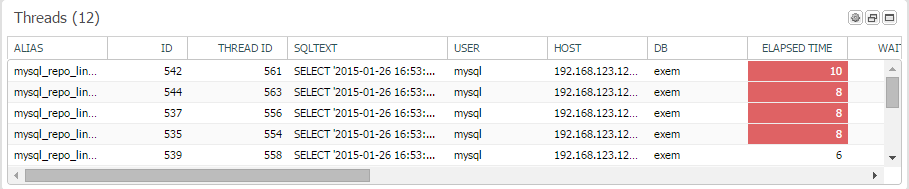
To View Threads
- In the Threads area at the bottom, you will find a list of Threads that are currently active.
Multi Monitor Area
The ‘Multi Monitor Area’ of MaxGauge’s main screen is composed of 10 sub-windows, and the user can choose various information provided by MaxGauge such as MySQL’s performance indicator, CPU indicator, and the ratio indicator from each sub-window.
Monitoring Target Main Performance Indicators
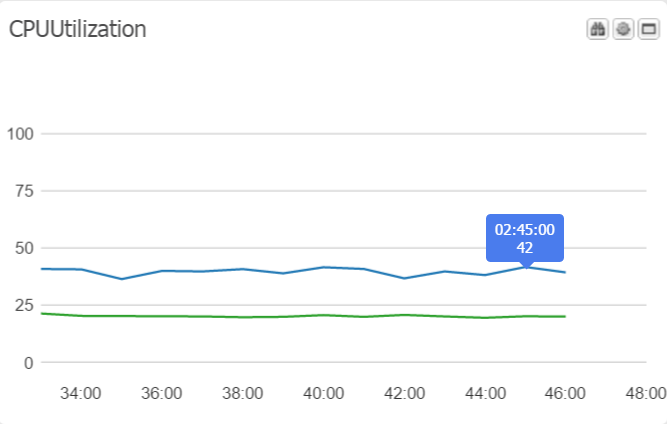
- CPUUtilization
- FreeableMemory
- Threads running
- Innodb buffer pool reads
- Threads connected
- Innodb rows updated
The Multi Monitor Areadisplays 6 performance indicators by default. The graph and the values displayed on the screen are defined as the average value per second of the difference value of the time (t) and the previous time (t-1) divided by the elapsed time (sec) in the case of performance indicators logging values in cumulative format; and the current values in the case of performance indicators logging current values.
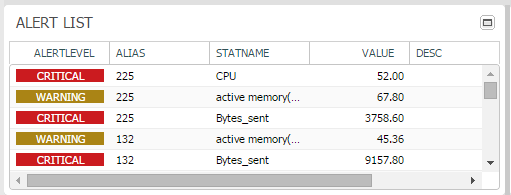
Alert Area
In the Alert Area, you can check the alarm history of the instance currently being monitored.
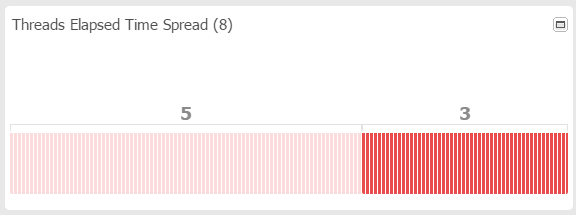
Thread Elapsed Time Spread Area
Checks the individual elapsed time of each active thread and indicates the thread count by each elapsed time segment.
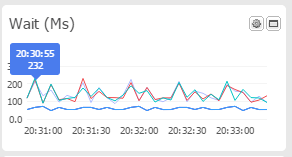
WAIT (ms) Area
Displays the average wait time of the monitoring target database.
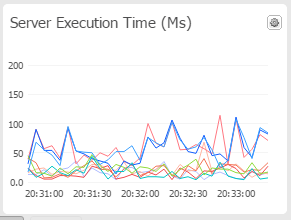
SERVER EXECUTION TIME (ms) Area
The Server Execution Time is an indicator which checks the elapsed time by continuously executing simple quieries as to know whether normal query execution is possible in the monitoring server.