Thread Detail
Thread Detail Overview
The THREAD Detail can provide detailed information about a particular thread in the database system and has the following functions.
- Wait indicator’s content and activity amount from the time of connection to an individual thread until now.
- Wait indicator’s content and activity amount between the current time and the previous time.
- Thread default information and the SQL text currently executing.
- Query Kill function
The following is the Tread Detail Initial Screen.
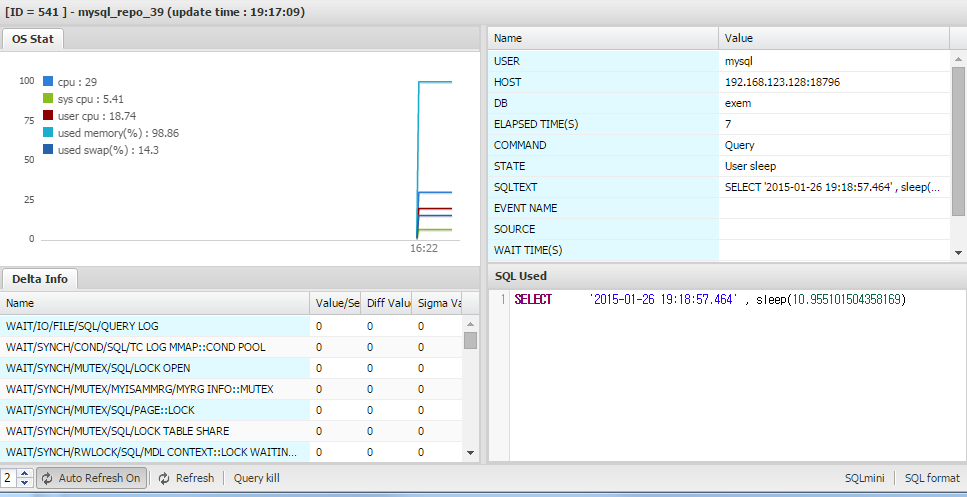
Thread Detail Description by Each Area
Thread Control Area
![]()
You can manually Refresh or Query Kill the threads actually operating.
Detail Info Area
Displays the cumulative value (Sigma) and the Value/Se of the wait information about the corresponding session which has been waiting until the present.
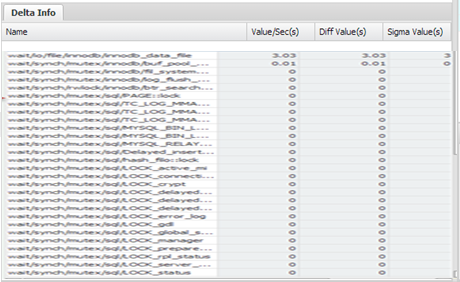
| Item | Description |
| Name | MySQL Wait Indicator Name |
| Value/Sec(s) | Average value per second of the value generated in between times. |
| Diff Value(s) | The difference value in between times. |
| Sigma Value(s) | The cumulative value until the present time. |
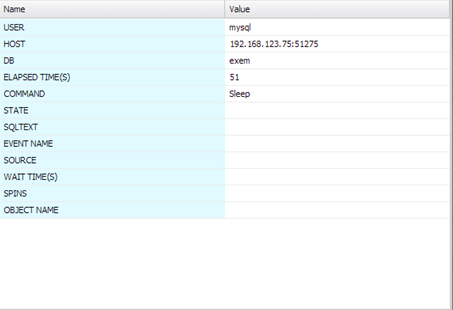
Session Basic Information and Current Wait Area
Displyas the User Name, Host Name, DB Name, Elapsed Time Information and the Current Wait Information.
SQL Used Area
The is the area where the currently executing used SQL text is displayed.
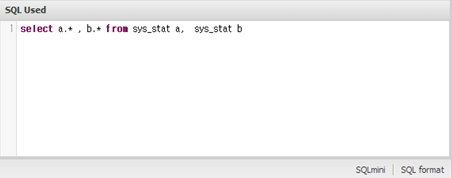
To see the execution plan of the SQL Text, click on the SQLmini button located on the right bottom.
If the SQL text is not readable due to long length, use the SQL formatting function. Click the Format SQL button at the bottom of the window.
Thread Detail Drive Method
To drive the Thread Detail, use the following methods.
- From MaxGauge’s main screen’ Thread Tab, double-click on the session.
- From MaxGauge’s Threads Manager screen, double-click on the session.
- From MaxGauge’s Lock Tree screen, double-click on the Thread.