01

Loaded with features, easy as ever

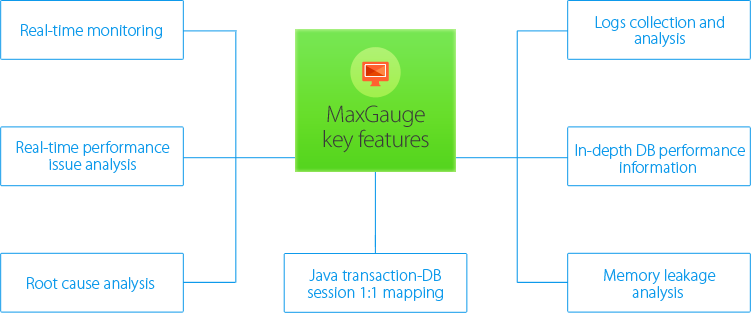
MaxGauge is a specialized tool for application performance management. It provides a function for tracking transactions across all tiers of infrastructure, from Web to DB or external requests, not to mention the Call Tree & SQL execution information necessary for analyzing individual transactions, and even provides the JVM status and system operation information.


01_11

  • Illustrates the complex system operation in a clear and simple structural diagram so you can recognize the overall status at a glance.
  • Provides an intuitive real-time screen which helps to resolve the greatest challenge to all administrators by minimizing the time trying to identify the root cause of the system error.
  • Provides a screen which allows you to monitor at a glance not only the internal system but also the external connection systems through which transactions are processed.
  • Through accurate analysis data, the problems are resolved before they can develop.
  • Through transaction tracking function, it provides a real-time monitoring screen in regards to the total elapsed time of a single transaction from beginning to completion, including the breakdowns of elapsed time in each tier.
  • DB and Application Server administrators view the same data and analyze the operation status from the same perspective, and hence, the diagnosis of the root cause of the problem is clear and accurate.

Honeycam 2015-05-08 16-52-24


with MaxGauge

  • Transaction Tracking Analysis: You can monitor in real-time the transaction status across all tiers of infrastructure involved in completing a transaction, including the internal and external systems. In the event of a system error, you can precisely pinpoint as to exactly where the problem was originated.
  • Application Server Resource Usage: Excessive memory usage phenomenon analysis In the event an error occurs due to excessive usage of heap memory in Application Server, it provides a screen on which you can obtain a list of objects occupying excessive memory and intuitively monitor the memory usage of each object through which you can effectively analyze the root cause of the problem.
  • DB Connection: Identifying and analyzing service delays phenomenon due to DB lock In the event of a DB lock, it allows you to immediately identify and analyze the Java transaction which is holding the lock(Lock Holder) and the Application Server which is waiting on the lock(Lock Waiter) by providing real-time data which maps out the Java transaction and DB session 1:1.
  • Transaction Delays: Identifying and analyzing service delays phenomenon due to GC generation. If Garbage Collection(GC hereinafter) is generated frequently due to lack of available heap memory in Application Server, it may greatly affect the service process. Therefore, in the event of service delays due to lack of resource, it allows you to quickly analyze the root cause by providing information such as number of GC generated, execution time, memory usage by each area.

Architecture of MaxGauge

041_수정

MaxGauge Agent

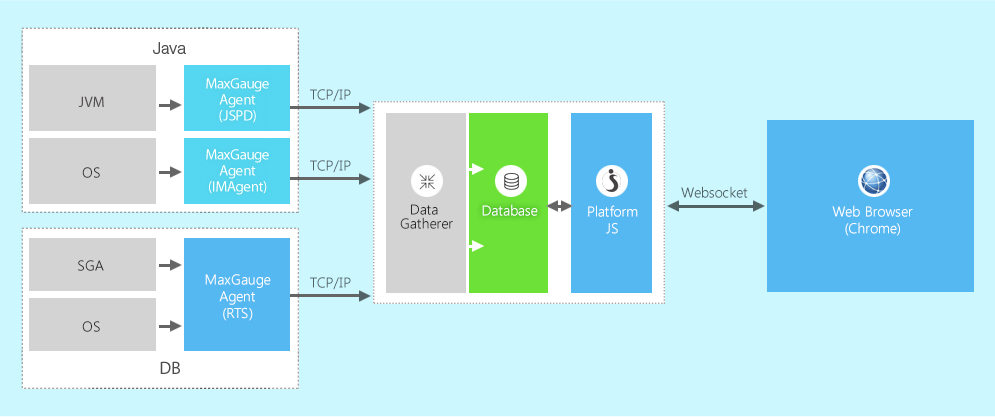
MaxGauge agent gathers various performance data from OS, Application Server and database, and sends them to MaxGague data gathering server.

05

MaxGauge Data Gathering Server

MaxGauge Data Gathering Server includes DG(Data Gather) process and Platform JS which works as HTTP web server.

DG(Data Gatherer)

DG process is designed to store various performance data receiving from MaxGauge Agent to the database.

Platform JS

PlatformJS is application server which supports DLL Plug-In Function. It executes JavaScript through websocket and also executes database query such as Oracle, SQLServer, PostgreSQL and ODBC.


MaxGauge Client

MaxGauge Client provides web-based user interface for real-time monitoring and post-analysis on performance data. In order to provide such tools, MaxGauge Client has been developed using HTML5, CSS, and JavaScript.