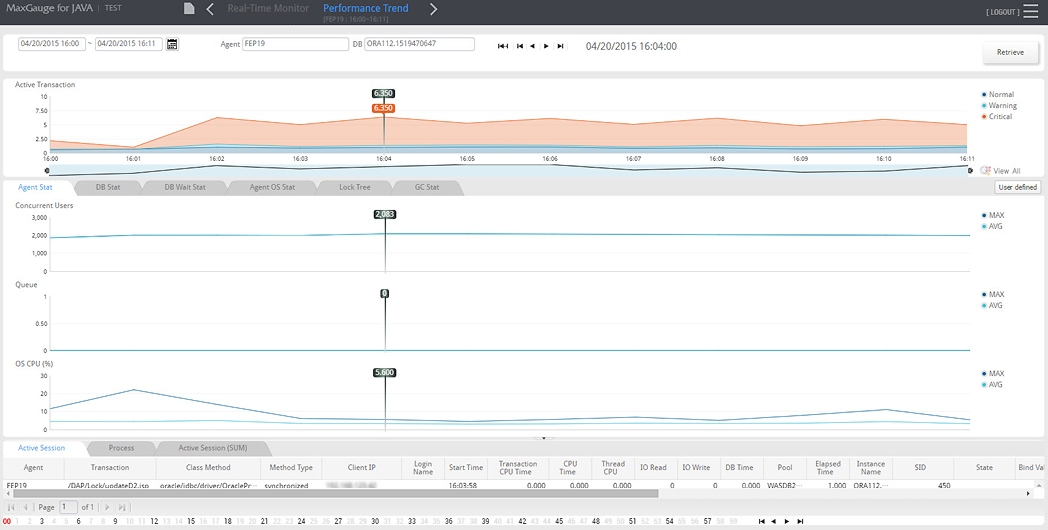
You can compare Application Server and DB’s main performance indicators trends graph at a glance. Also, by browsing the Active Transaction List, you can easily identify which transaction was executed at the time or system error.
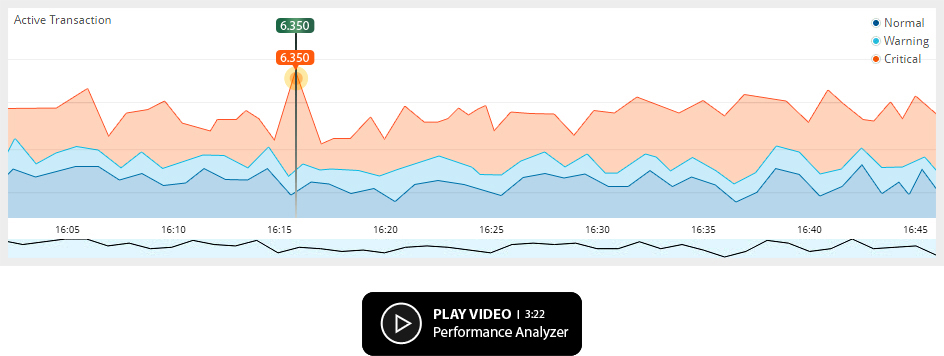
You can compare Application Server and DB’s main performance indicators trends graph at a glance. Also, by browsing the Active Transaction List, you can easily identify which transaction was executed at the time or system error.
Displays transactions’ detailed execution information such as the distribution of elapsed time of completed transactions, system errors found, and etc.
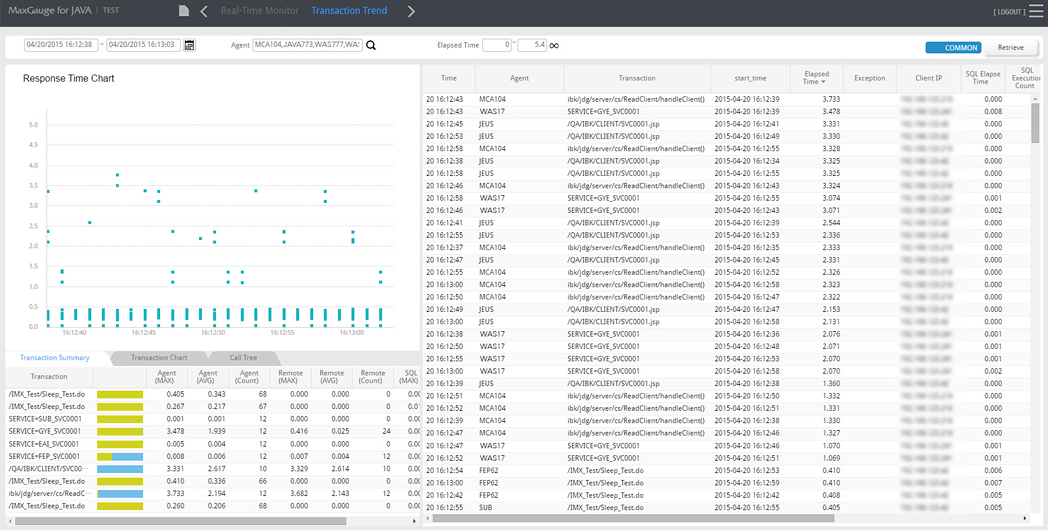
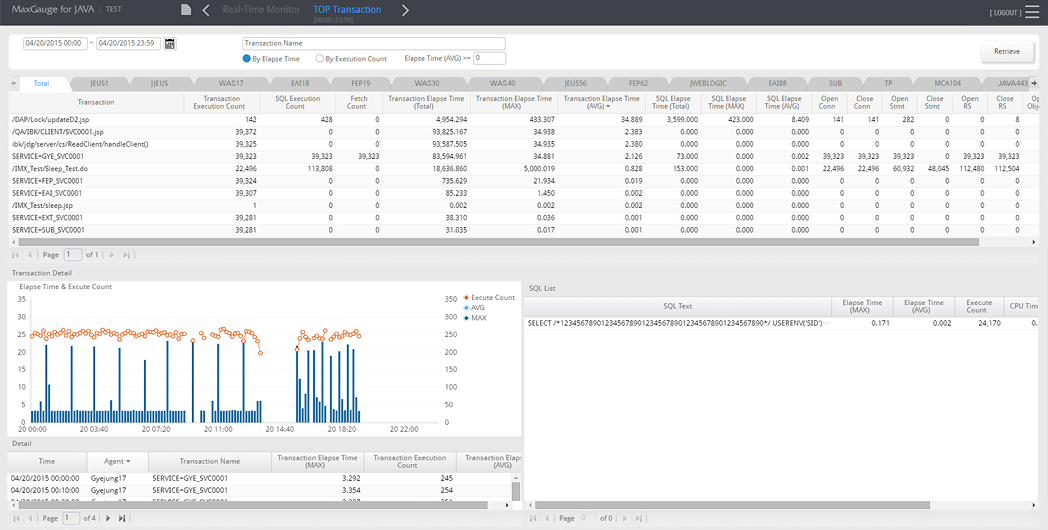
A list of top transactions is output by sorting the transactions by the average elapsed time during the search period or the total execution count. You can check the performance of the delayed transactions as well as the most frequently execution transactions.
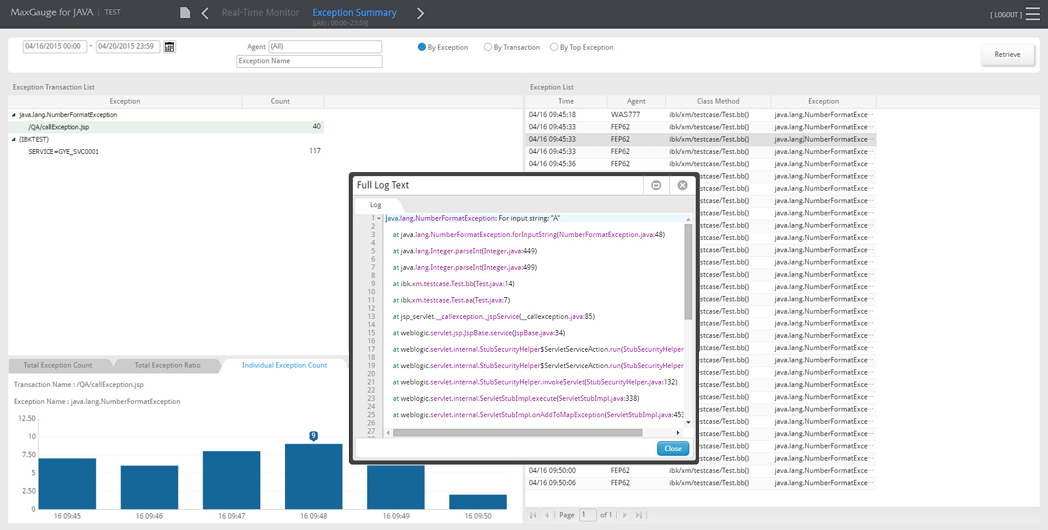
By providing the statistics of exceptions generated during a Transaction execution, you can identify the transactions in which exceptions are frequently generated and the exception generation status.
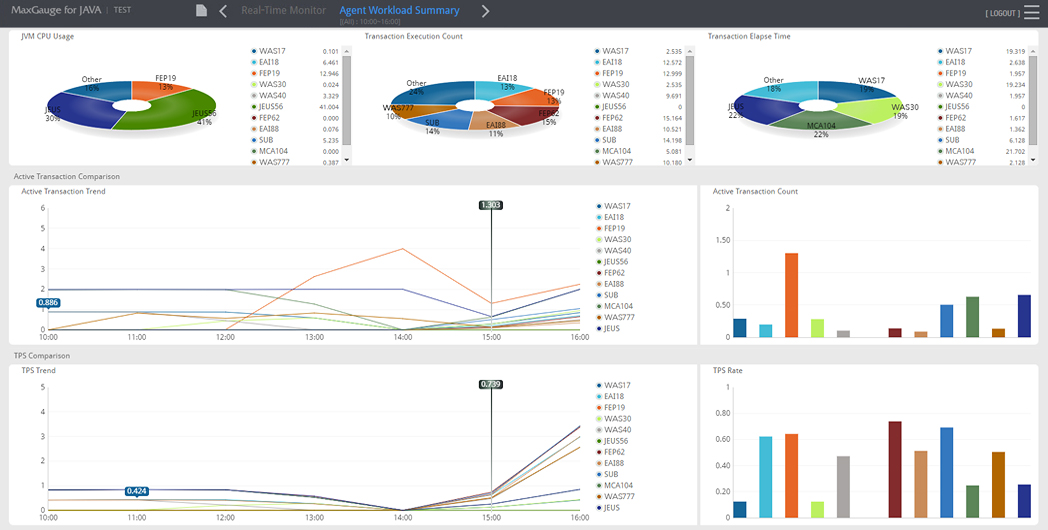
You can analyze the degree of workload distribution by comparing the performance indicators such as JVM CPU usage rate among the selected Application Server, transaction execution count, transaction execution time, TPS, and etc.
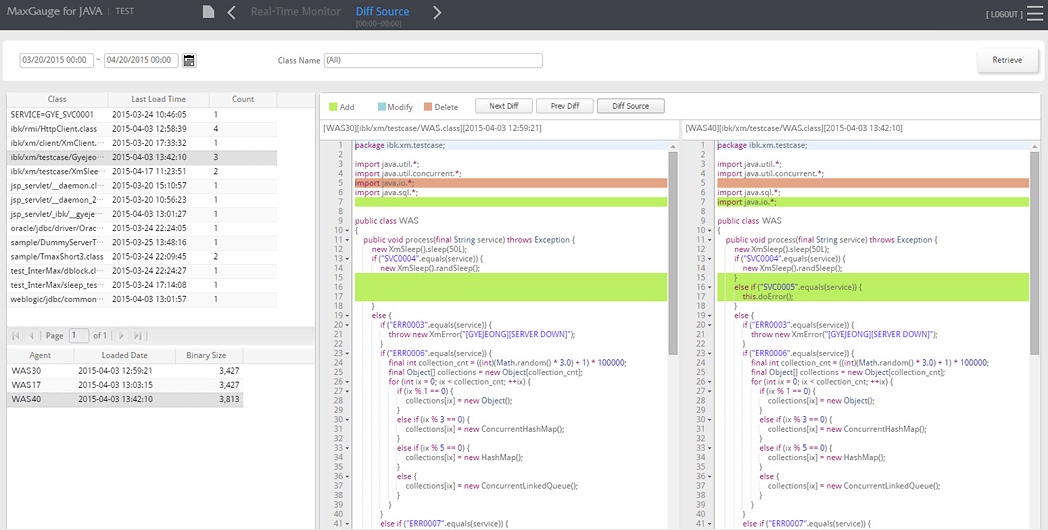
You can manage the changes in Class Source used in Application Server.
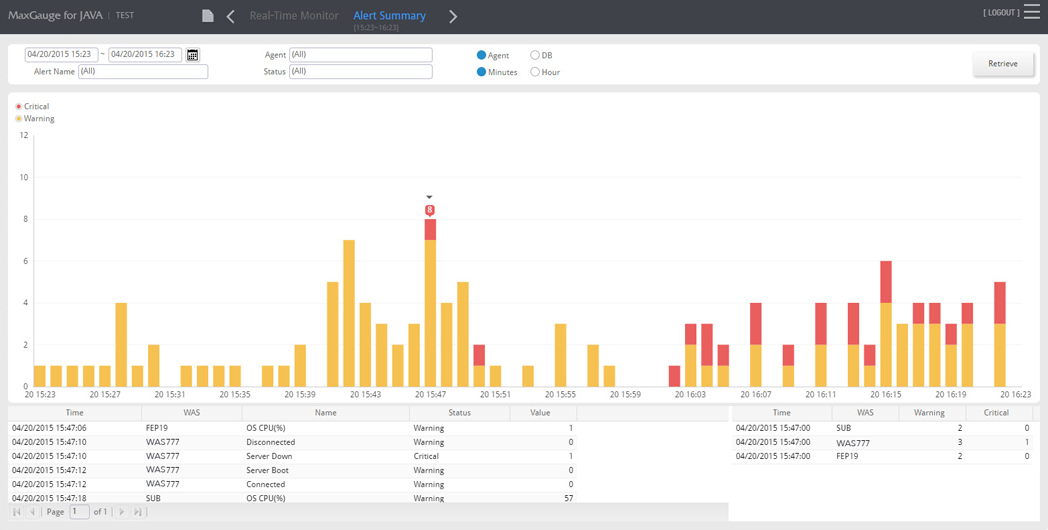
You can view the details of alarms generated due to Application Server, DB down or by exceeding the threshold values.