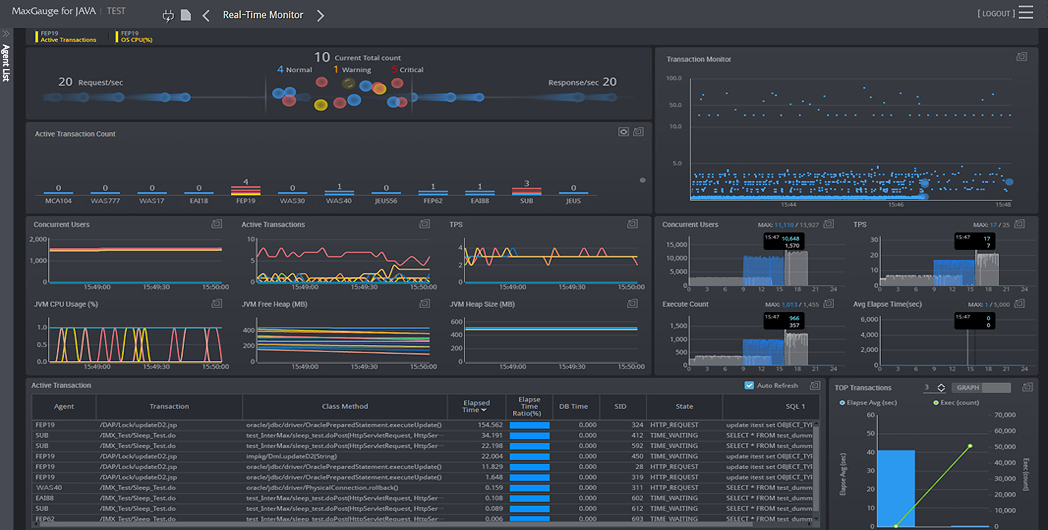
MaxGauge for JAVA monitors and records the web application server’s job execution status in real-time, monitoring the transactions between Application Server and database and closely analyzing the call tree. You can effectively manage the performance and system errors in between Application Server and database.
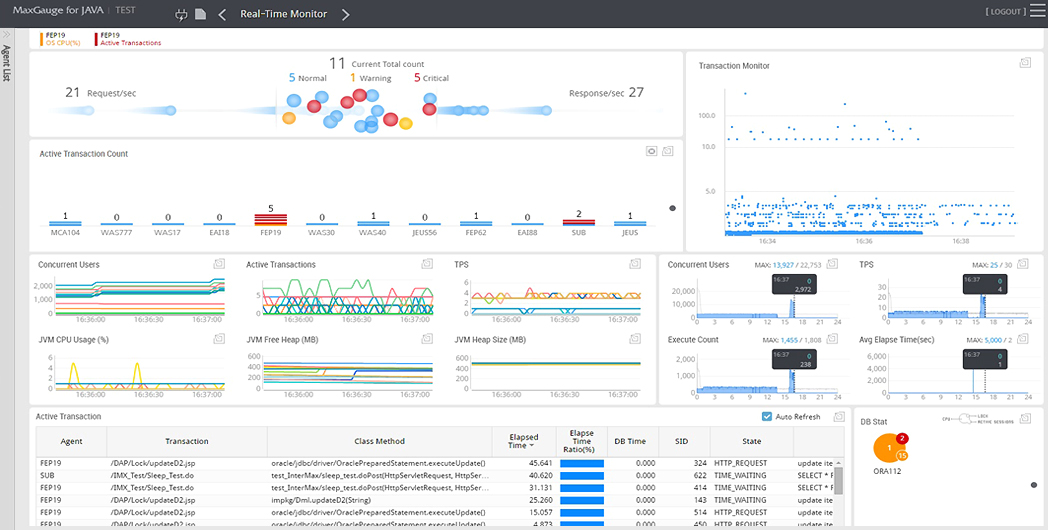
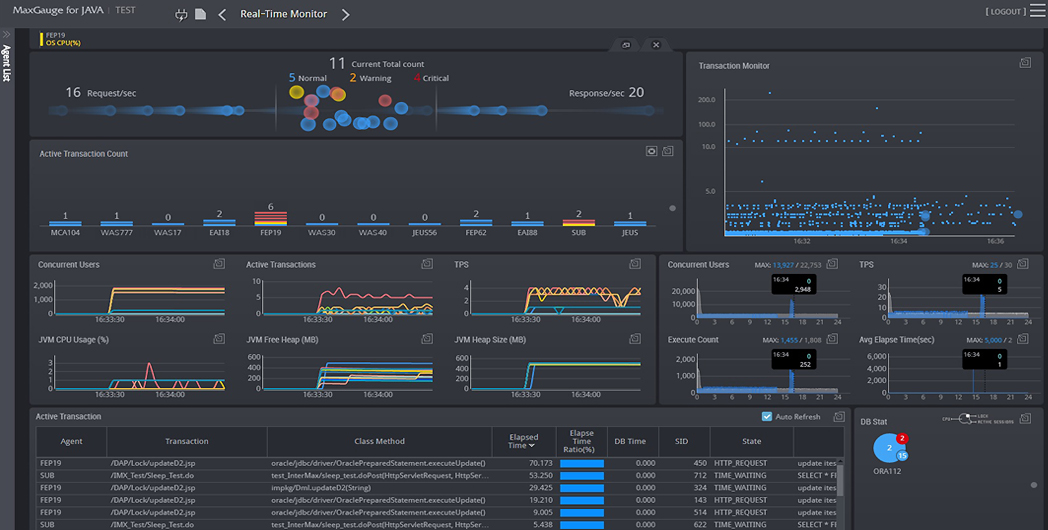
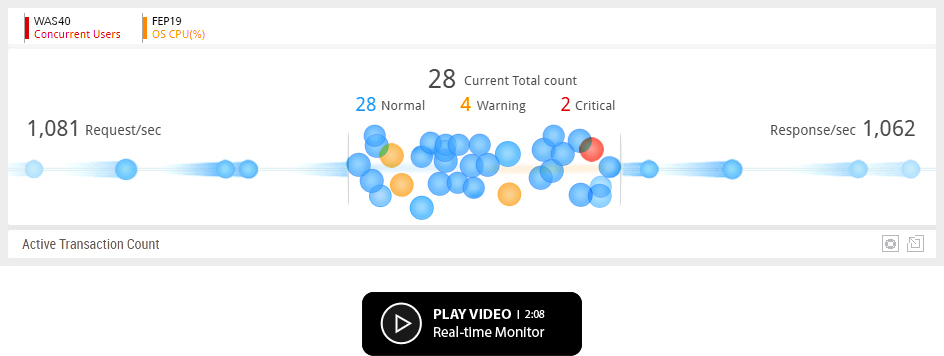
Provides features such as Application server’s resource usage, JVM status indicator, transaction information, real-time alarm and operation management, which allows you to quickly recognize response delays for a quick resolution.
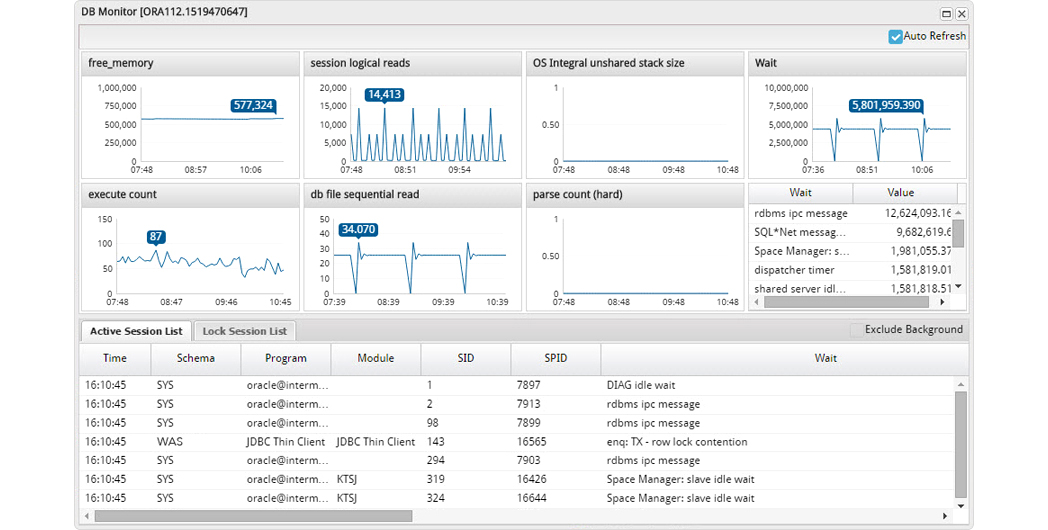
Provides the DB server’s main performance indicators, wait information, and the active session information, and in the event of a lock, it provides the Lock Tree in real-time so you can intuitively identify the problems associated with the transaction lock.
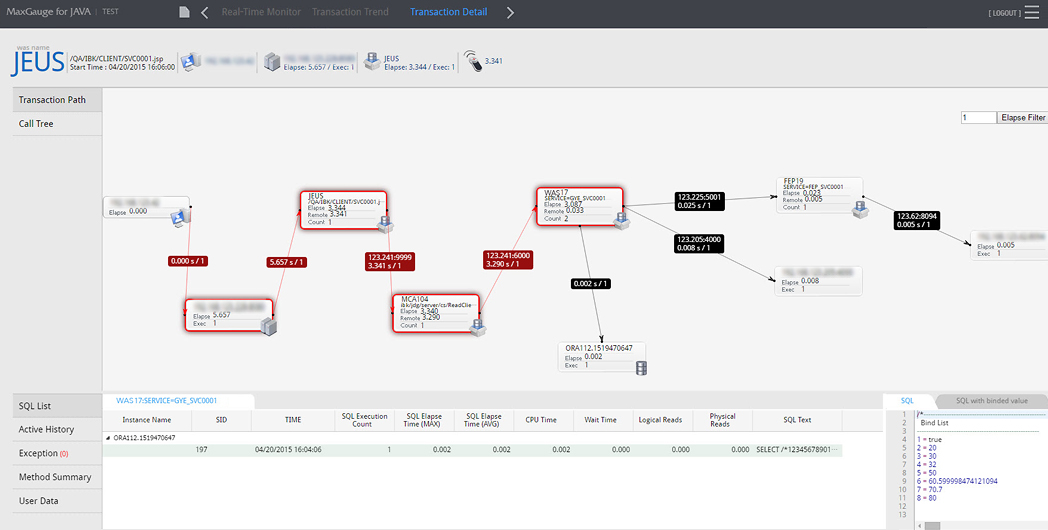
Through the transaction path screen, you can intuitively identify the component in which the problem is occurring. By using the Call Tree, Java Source check, and SQL execution information which are essential in the transaction’s detailed performance analysis, you can rather quickly and accurately diagnose the root cause of the problem.