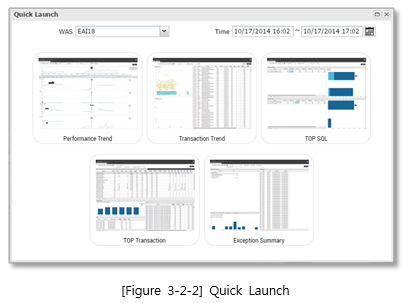
SUB) Quick Launcher
You can select the desired time of inquiry and WAS to quickly move to the main tabs of performance analyzer, where you can view the main indices of the WAS/DB.
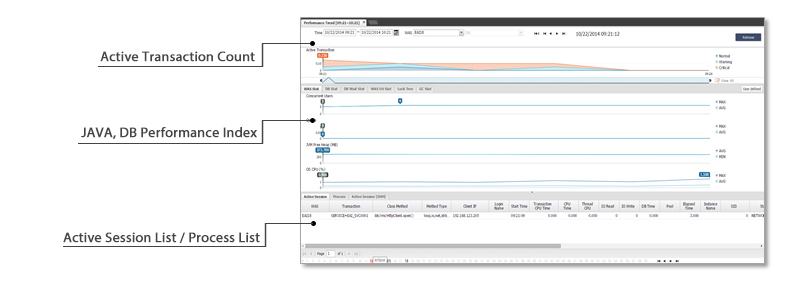
Performance Trend
SUB) Setting the Search Conditions
The trend graph allows for comparison of the main performance indices of WAS/DB at the time point of your inquiry, at a single glance. Additionally, it shows the list of active transactions executed at a specific time; and it means that you can easily find out which transaction was executed when trouble occurred.
| Item | Descriptions |
|---|---|
| Search condition |
|
| ActiveTransaction
Count |
The number of active transactions occurring at the time pointDepending on the elapsed time of transaction, different color is used (blue for three sec or less, yellow for three to five sec, and red for six sec, or more). |
| |
View the desired regions during the search period. |
| |
View all the applicable regions during the search period. |
| Performance trend graph | Display the trends of changes in the main indices for the WAS/DB during the search period.
|
| |
Unhide Active Session Lists and Process Lists |
| |
Hide Active Session Lists and Process Lists |
| ActiveSession List
/ Process List |
Double click on the desired area of the trend graph to check the active transaction list and the process list for that region.
|
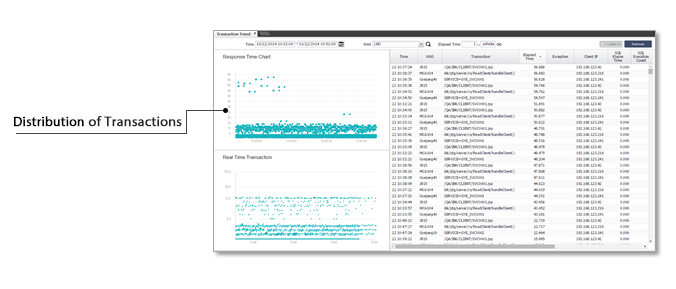
Transaction Trend
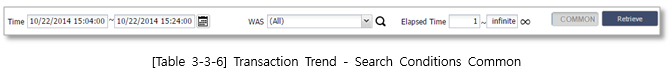
SUB) Setting the Search Conditions
Transaction Trend represents the distribution of elapsed time & the information of transactions that are already executed.
If the AP is normally terminated, the sky color will be used on the left. In case of exception, the red color is used. Drag the transaction to show the transaction information on the right. Click on the transaction name and right click the right mouse button to launch the link menu.
| Item | Descriptions |
|---|---|
| Time | Transaction completion time |
| WAS | WAS where the transaction is executed |
| Transaction | Transaction Name |
| Elapse | Total execution time for a transaction |
| Exception | Name of exception occurring during transaction execution |
| Login Name | Transactions’s login name |
| SQL Elapse | Time of SQL executed by a transaction |
| SQL Execute Count | The number of times SQL executed by a transaction |
| SQL Fetch Count | Transaction fetch count |
| Client IP | IP address for the client that executed a transaction |
| Remote Elapse Time | Execution time of a transaction called from the outside |
| Remote Execution Time | The number of transaction executions called from the outside |
| Login Name | Transactions’s login name |
| Browser | Browser used by the client |
| TP Elapse | Transaction’s TP execution time |
• Search Conditions
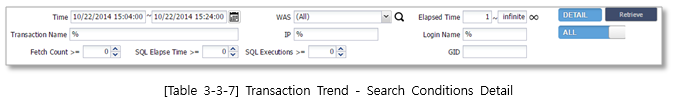
| Item | Descriptions |
|---|---|
| |
|
| |
|
| |
Display all transactions executed in the search area. |
| |
Only display transactions with exceptions in the search area. |
| |
Search button |
SUB) Transaction Trend Screen
• Link menu
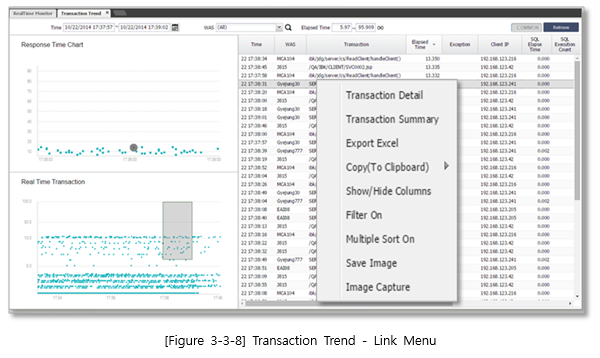
| Item | Descriptions |
|---|---|
| Transaction Detail | Displays the details of transaction. |
| Transaction Summary | Inquire about the execution details of transaction. |
| Export Excel | Save the transaction data in an XLS file. |
| Copy (To Clipboard) | Copy the transaction data to clipboard. |
| Show/Hide Columns | Hide or unhide a column. |
| Filter On/Off | Filter a column by assigning a condition to it. |
| Multiple Sort On/Off | Multiple sort function |
| Save Image | Save the transaction data in a PNG file. |
| Image Capture | Select a captured area and save it in a PNG file. |
DB Trend
SUB) Setting the Search Conditions
The trend graph allows for comparison of the main performance indices of WAS/DB at the time point of inquiry, at a single glance. In addition, it shows the list of active transactions executed at the specific time, and allows you to easily identify which transaction was executed when trouble occurred.
SUB) Stat Tab Screen
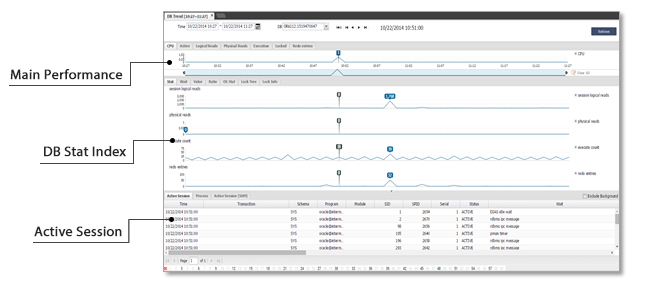
| Item | Descriptions |
|---|---|
| Search condition |
|
| |
View the desired regions during the search period. |
| |
View all the applicable regions during the search period. |
| DB’s MainPerformance IndexTrend Graph | It represents the trends of the following : CPU, Active, L/Reads, P/Reads, Exec, Locked, Ratio Entries. |
| DBStat indexTrend Graph | It represents the following DB stats trends: Stat, Wait, Value, Ratio, OS Stat, Lock Tree, Lock Info. |
| ActiveSession/ Active
Session(SUM) |
Double click on the desired area of the trend graph to check the active session list and the SUM information.
|
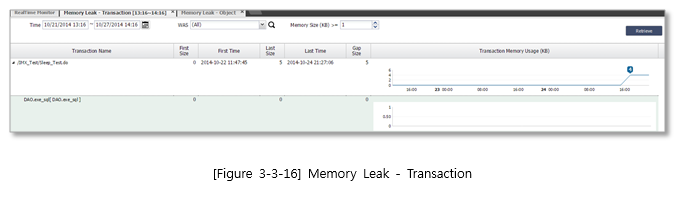
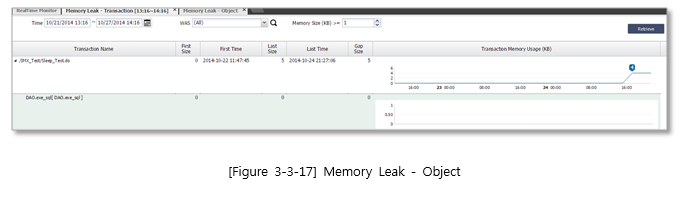
Memory Leak
SUB) Transaction Memory Leak Screen
Maxgauge can extract member variables with increasing memory usage from the list of member variables used in the transaction; and identify the transactions with suspected memory leak and memory usage by member variable.
SUB) Object Memory Leak Screen
You can see the changes in the memory usage by an object with suspected memory leak.
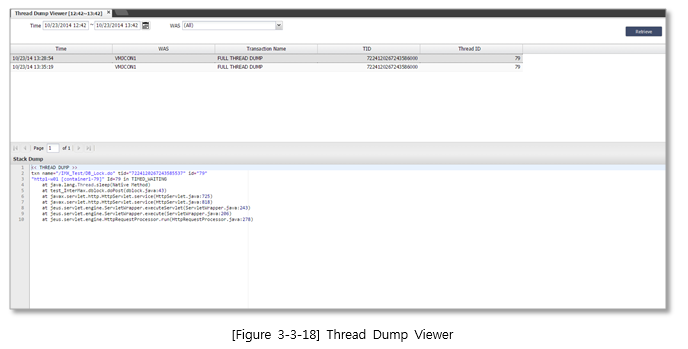
Thread Dump viewer
SUB) Thread Dump Viewer Screen
In case of OOM (Out Of Memory), or upon user’ requests, Thread Dump Viewer can start thread dumping and perform analysis. Using Thread Dump Viewer, you can identify when the dump takes place and the learn the details.
TOP Transaction / SQL
SUB) Setting the Search Conditions
| Search condition |
|
|---|
SUB) TOP Transaction Screen
Maxgauge can extract the list of transactions with the average elapsed time or the total number of executions, so that you can review the longest transactions or the most frequently executed transactions.
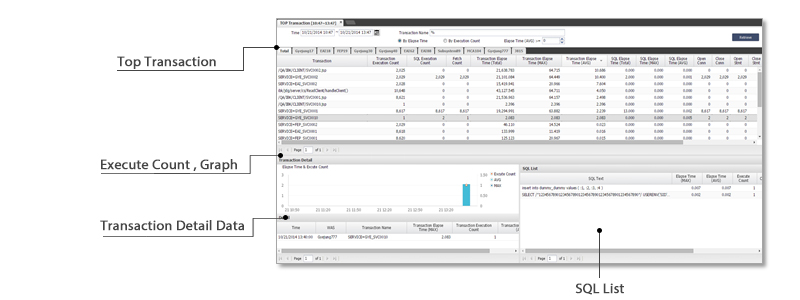
| Top Transaction List | It represents the list of top transactions during the search period in terms of average elapsed time or total number of executions. You can inquire about a specific WAS or the entire system.
|
|---|
SUB) TOP SQL Screen
Maxgauge can extract and sort the SQL, in the increasing order of average elapsed time, so that you can analyze and manage the SQL performance.
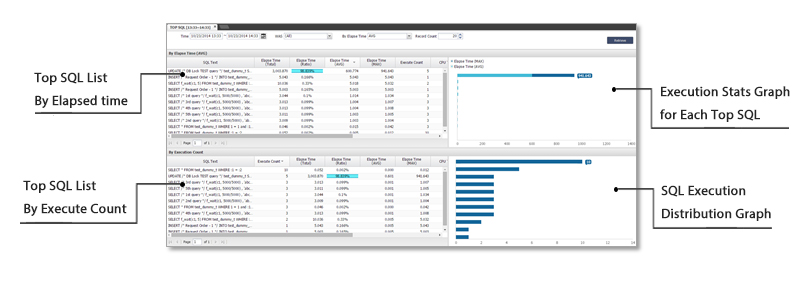
| Functions | Descriptions |
|---|---|
| Search condition | Time: Set the time range of search.WAS – Set the condition for the WAS that executed the SQL.Elapse Time – SQL execution time (avg, max, total) |
| SQL List – By Elapse Time | Sorted in the increasing order of average elapsed time. |
| SQL List – By Execute count | Sorted in the increasing order of execute count. |
| Elapse Spread | You can see the distribution of elapsed time for the SQL selected.Horizontal axis represents the elapsed time.(sky color: average, blue: maximum) |
| Execute Spread | You can see the distribution of execute count for the SQL selected.Horizontal axis represents the Execute Count. |
Transaction Summary
SUB) Setting the Search Conditions
It shows the summary data of transaction, per unit time, in chronological order. You can analyze the specific performance history at each time segment. You can identify which time segment has a performance issue.
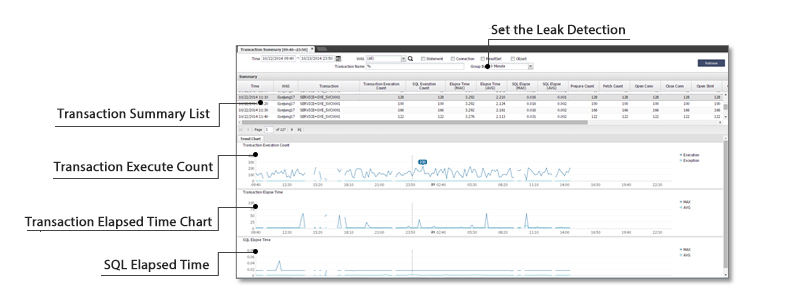
| Item | Descriptions |
|---|---|
| Search condition |
|
| Transaction
Summary List |
This is the summary information of transaction execution history in the unit of time designated (default: 10 minutes). |
| Transaction
Execute Count Chart |
Distribution of execute counts for a transaction in the unit of time designated |
| Transaction
Elapse Time Chart |
Distribution of elapsed times for a transaction in the unit of time designated |
| SQL Elapse time
Chart |
Distribution of SQL elapse times for a transaction in the unit of time designated |
SQL Summary
SUB) Setting the Search Conditions
Maxgauge can search by specific time periods, WAS or transaction name; and check the execution details of the SQL used in the transactions for performance analysis.
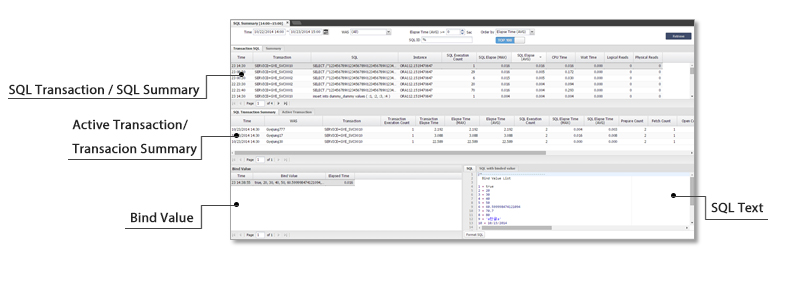
| Item | Descriptions |
|---|---|
| Search condition |
|
| |
Display the top 100 summary data sets of SQL execution history during the search period based on the reference time (default, 10 min). |
| |
Display all the summary data sets of SQL execution history during the search period based on the reference time (default, 10 min). |
| Transaction SQL | Display the summary data sets of SQL execution history for each transaction during the search period based on the reference time (default, 10 min).
|
| SQL Summary | Display the summary data sets of SQL execution history during the search period based on the reference time (default, 10 min).
|
| SQL Transaction
Summary |
Execution stats of transactions that used the selected SQL |
| Active Transaction | Details of active transactions executed when selected SQL is executed |
| SQL Text | Full text for the selected SQL |
| Bind List | Display the list of each bind used for selected SQL (at present, the time data is not collected. You can only set the bind list.). |
Exception Summary
SUB) Setting the Search Conditions
Exception History provides the statistics for Exceptions that occur while transaction is running. It helps you to assess transactions with frequent exceptions and the status of frequent exceptions.
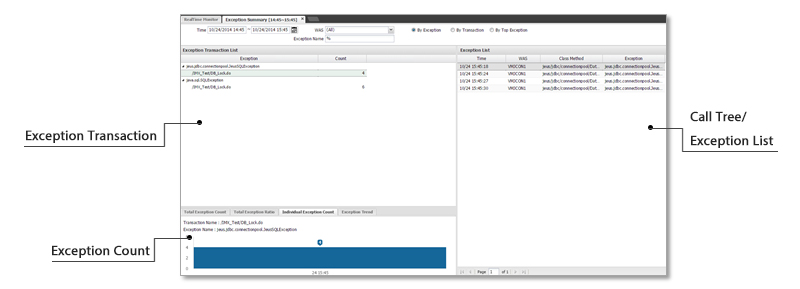
| Item | Descriptions |
|---|---|
| Search condition |
|
| Exception Transaction List | Exception statistics of transaction occurring in the search area |
| Call Tree | Call tree information for the selected transaction |
| Exception List | Details of exceptions occurring in the search area |
| Total Exception Count | Stats graph for exceptions occurring in the search area |
| Total Exception Ratio | Ratio of each exception name found in the search area |
| Individual ExceptionCount | Stats graph for an exception selected from the exception transaction list |
| Exception Trend | Graph indicating the status of exception in the search area |
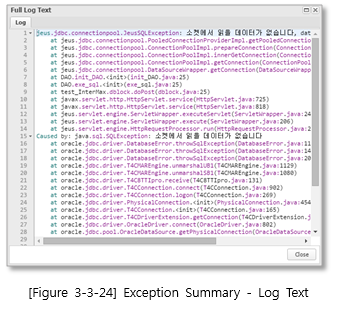
Log Text
You can see the details of exceptions. In the Exception Transaction list, left click the mouse on an exception; then double click on it or right click on the mouse in the Exception List; and then select Log Text.
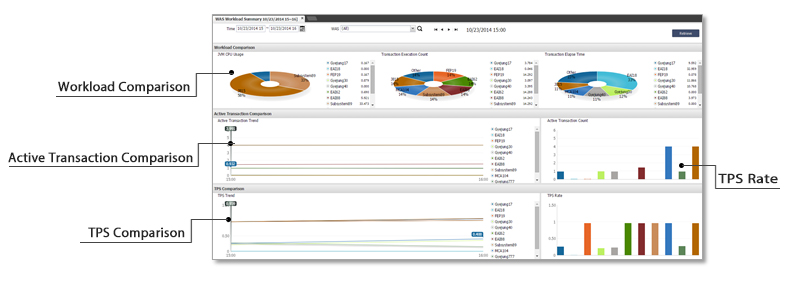
WAS Workload Summary
SUB) Setting the Search Conditions
You can compare various performance indices such as CPU usage, Transaction execution, or TPS of the WASs; and analyze the degree of load balance between different WAS.
| Item | Descriptions |
|---|---|
| Search condition |
|
| Workload Comparison | Analyzes the following performance indices: JVM CPU Usage, Transaction Execute Count, Transaction Elapse Time. |
| Active Transaction
Comparison |
Comparative analysis of the WAS and the trends of active transactions in the selected time range |
| Active Transaction
Count |
Active transaction count bar graph |
| TPS Comparison | Comparative analysis of the WAS and trends for TPS in the selected time range |
| TPS Rate | TPS ratio bar graph |
ComparisonComparative analysis of the WAS and the trends of active transactions in the selected time rangeActive Transaction
CountActive transaction count bar graphTPS ComparisonComparative analysis of the WAS and trends for TPS in the selected time rangeTPS RateTPS ratio bar graph
Diff Source / Env
SUB) Setting the Search Conditions
Diff Source allows user to manage the change history of class source used in WAS. Source Download starts operating after it is set in Maxgauge Configuration. Each time WAS restarts, it will check whether the source is modified; and if yes, it will continue to add new changed source.
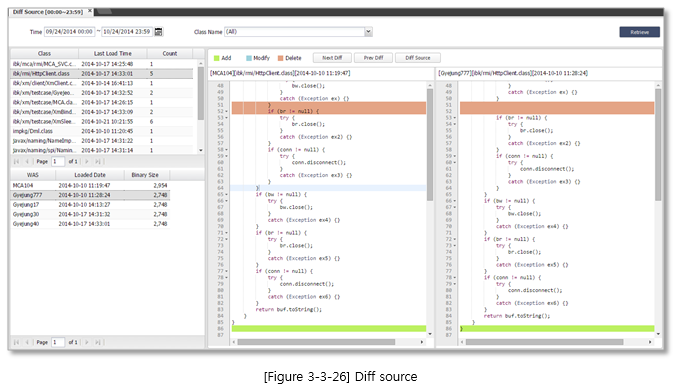
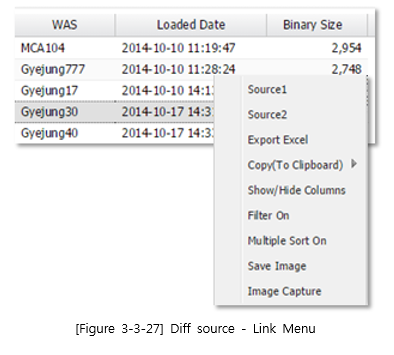
To compare sources, you can use time or class name options for your inquiry. If you select a class in the left top, the data loaded for each WAS will be displayed at the left bottom. After selecting the data that you want to view the source for, right click with the mouse to move the source to Source 1, Source2 buttons.
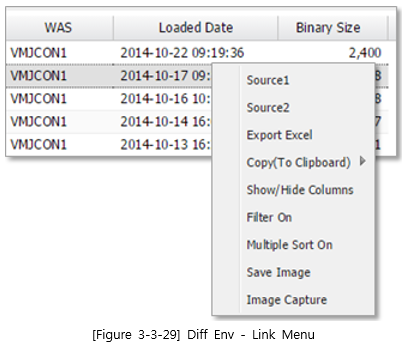
Diff Env
Diff Source allows user to manage the change history of class source used in WAS. Source Download starts operating after it is set in Maxgauge Configuration. Each time WAS restarts, it will check whether the source is modified; and if yes, it will continue to add new changed source.
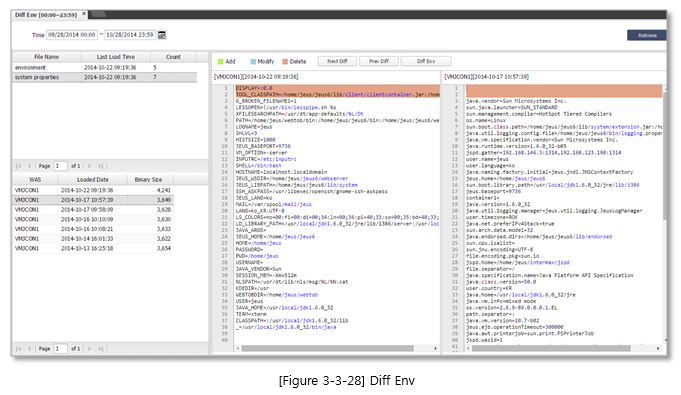
To compare sources, you can use time or class name options for your inquiry. If you select a class in the left top, the data loaded for each WAS will be displayed at the left bottom. After selecting the data that you want to view the source for, right click with the mouse to move the source to Source 1, Source2 buttons.
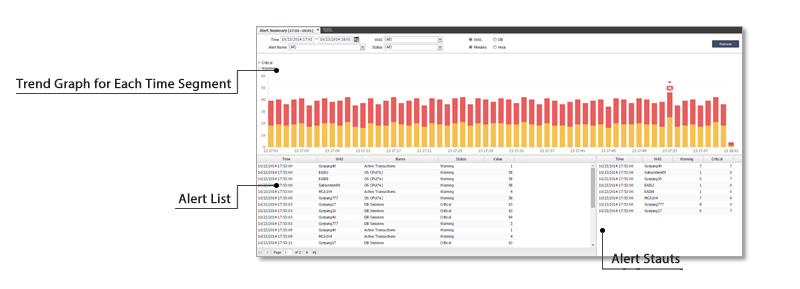
Alert Summary
You can see the details of alarms issued for JVM downtime.
| Item | Descriptions |
|---|---|
| Search condition |
|
| ALARM | The bar graph represents the number of JVM down times for each time segment.
Depending on the alert level, different colors are used. Yellow indicates a warning level, while red indicates a critical level. |
| Alert List | Click on the bar graph to see the details of alerts occurring at the time. |
| Time | Alert occurrence time |
| WAS/DB | WAS or DB where an alert is generated |
| Name | Alert Name |
| Status | Alert Status. Either warning or critical. |
| Value | Alert count or value Depending on the alert characteristics. |
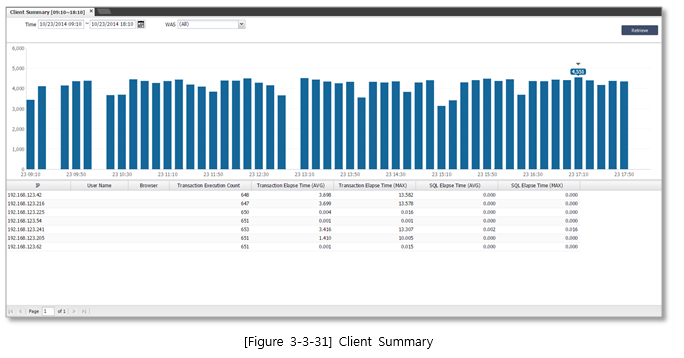
Client Summary
Client Summary displays the statistics of transactions executed for each IP address, used at the time.
| Item | Descriptions |
|---|---|
| Search condition |
|
| Bar Graph | The bar graph, based on total time, represents the sum of transactions executed for each IP address that the client accessed. |
| IP | Client’s IP address |
| User Name | Client’s User Name |
| Browser | Client’s Browser Type |
| Transaction Execute Count | The number of times transactions executed for each client’s IP address |
| Transaction Elapse Time (AVG) | Average elapsed time for a transaction executed for each client’s IP address |
| Transaction Elapse Time (MAX) | Max elapsed time for a transaction executed for each client’s IP address |
| SQL Elapse Time (AVG) | Average elapsed time for SQL used in a transaction executed for each client’s IP address |
| SQL Elapse Time (MAX) | Average elapsed time for SQL used in a transaction executed for each client’s IP address |
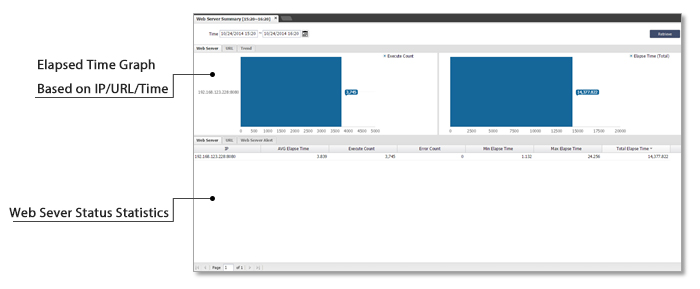
Webserver Summary
This statistic indicates the status of the web server, such as the response time for each URL called by the web server, service statistics for each URL, and service error alarms.
| Item | Descriptions |
|---|---|
| IP | IP address for the web servers during the search period |
| AVG Elapse Time | The average elapsed time during the search period |
| Execute Count | The total number of executions during the search period |
| Error Count | The average service response time during the search period |
| Min Elapse Time | The min elapsed time during the search period |
| Max Elapse Time | The max elapsed time during the search period |
| Total Elapse Time | Total elapsed time during the search period |