Overview

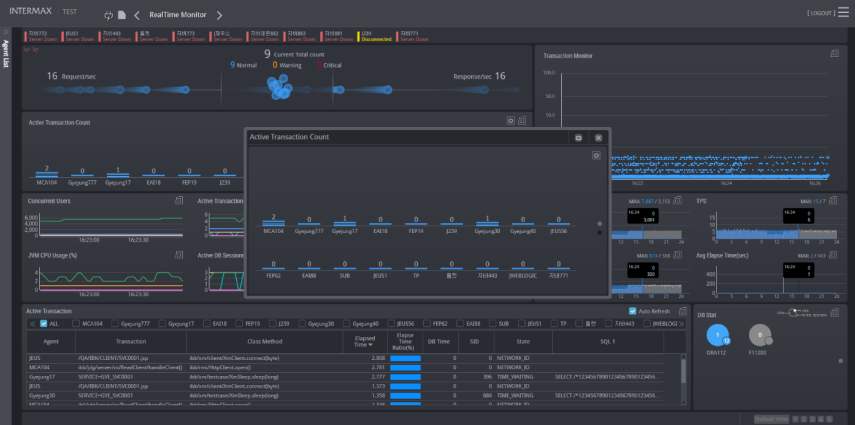
MaxGauge is a performance management tool designed to provide an integrated and effective management of performance and system errors of WAS and the Database server, which make up the N-tier web service environment. From a system operation manager’s perspective, the ability to connect and integrate WAS and DB for monitoring is essential for an effective web service performance management.

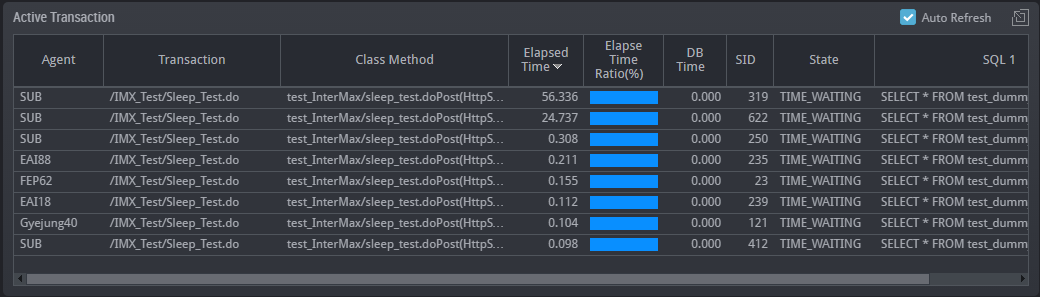
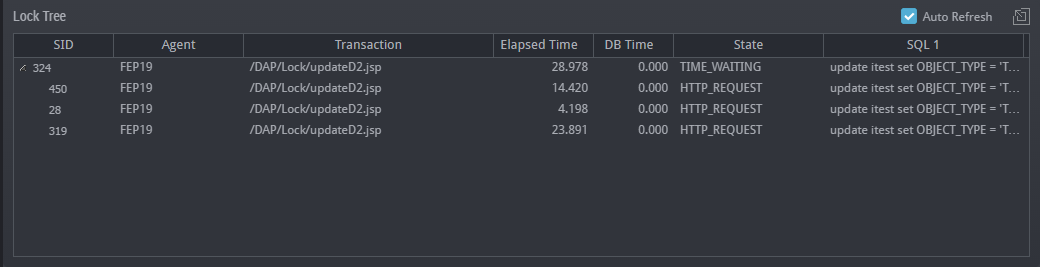
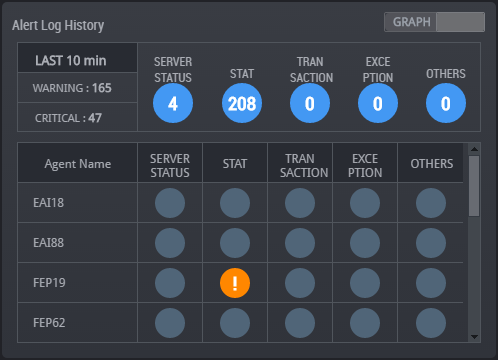
MaxGauge supports system administrators or database and application managers who are responsible for system errors and performance management, to effectively carry out their tasks of real-time monitoring, diagnosis, and analysis.
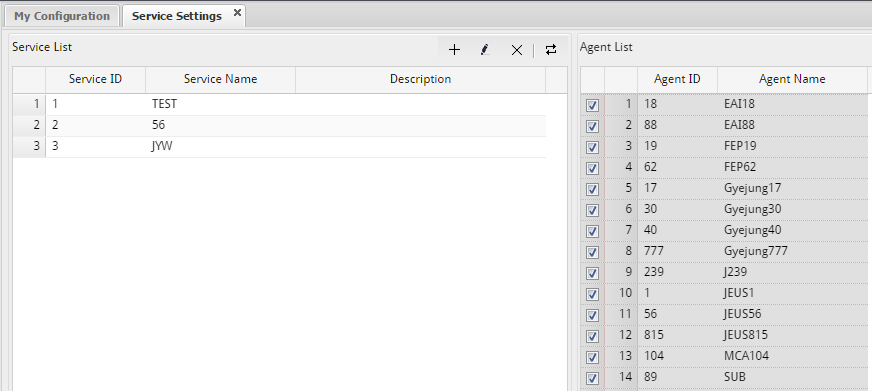
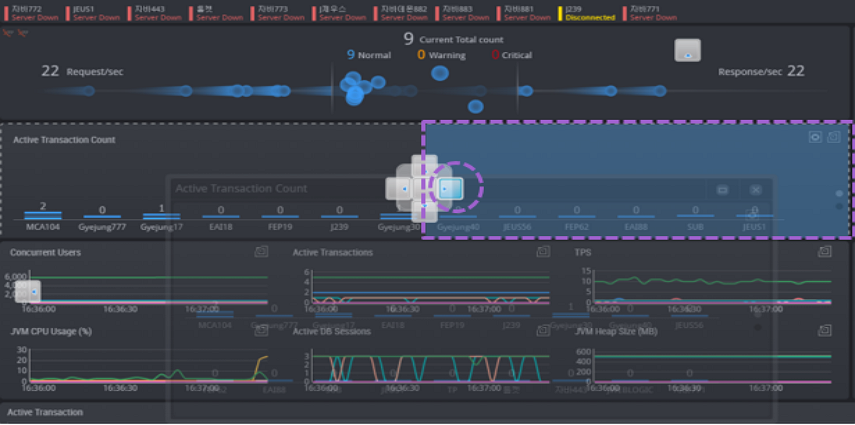
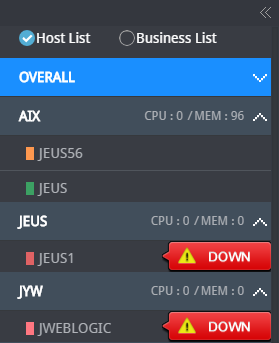
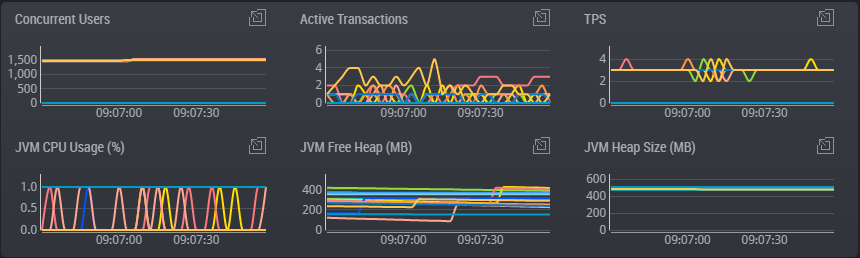
The real-time monitoring function enables you to easily and quickly identify in which WAS or DB the system error occurred or the performance degradation occurred, among the many servers which make up the web service.

Back To Top

SUB) Resource / Throughtput Information

  • OS Main Resource Performance Data
  • Number of Active Transactions
  • JVM Heap Memory Usage Rate Information
  • JVM Garbage Collection Information
  • TPS/Daily Transaction Throughput Information

Back To Top

SUB) Transaction / SQL Execution Information

  • Active Transaction
  • Transaction Response Time Distribution Chart
  • Lock Wait Transaction Information
  • SQL Execution Time and Bind Variables

Back To Top

Get Started

MaxGauge provides a web-based monitoring screen.  To start real-time monitoring, you must enter the Platform JS module’s service IP and the port designated for MaxGauge UI into the web browser address bar.

1 Caution : The lates Version of Chrome browser is required for MaxGauge monitoring.

Back To Top

SUB) Login

DataGather Console (hereinafter referred to as “DG Console”) is the program used to check whether a DG agent successfully receives data from jspd and rts, and accurately saves it in the Repository DB. DataGather Console can be installed only on a Windows based PC. Run the DG console by double clicking on the DGConsole.exe file (appropriate for number of Window bits).

2

For first time login, enter ‘Maxgauge’ in the user ID field and ‘manager’ in the password field.

Back To Top

SUB) Agent Information Configuration

When you log in for the first time, you will see the configuration screen. You can configure various settings for monitoring from the configuration screen.

3

Agent information and service settings are required for MaxGauge monitoring. To configure agent information, go to Configuration’s Agent Setting screen.

4

Click on the ‘+’  icon on the top right, and the form will appear where you can enter the agent information.

5

Select an agent whose information you wish to enter. Next, enter the agent’s name, the host name of the server to which the agent belongs, and the gather name which collects the agent’s performance information. Then, click the Save button and the setting values will be saved.

Back To Top

SUB) Service Configuration

Maxgauge is designed to support performance monitoring for a unit of service by registering agents to a service.  You can register several agents whose tasks are similar to a single service to provide an integrated monitoring.

To configure a service, go to Configuration’s Service Settings.

6

lick on the ‘+’ icon next to the Service List, and the form will appear where you can enter the service information.

7

Select the Service name you wish to add and the agent to be registered for the corresponding service, and then click the Save button to save the settings.

Back To Top

SUB) Select Service

Once monitoring agent configuration and service configuration has been completed, then you can start real-time monitoring. Click on the Real-time button at the bottom right of the screen, and the window will appear on which you can select the service for monitoring.

8

On the Select Service screen, choose the service for monitoring and click OK, and the real-time monitoring screen for the corresponding service will appear.

Back To Top

User Interface

MaxGauge provides the user interface which is suitable for intuitively monitoring  the performance data, and this is called the Client.

Back To Top

SUB) Title Bar

In the upper part of the MaxGauge Client, the Views for real-time monitoring, the Connection Manager icon and the Select Menu icons can be found

9

Back To Top

SUB) The Difference between Tools and Frame

The difference between the tools and frames is whether it is possible for docking or not. In general, the Frame items are considered frequently used items during monitoring, and docking is only available to the Frame items.

Back To Top

SUB) Frame Management

The MaxGauge Client provides an ideal monitoring View that is suitable for various environments by using the Frame docking function.

Adding a Frame
For example, you can add a Lock Tree Frame by following the steps below.

[Step 1]
From the Select Menu list, click on the Lock Tree Frame.

10

[Step 2]
The Lock Tree Frame will be generated at the center of the MaxGauge Client.

11

[Step 3]
By clicking on the Title Bar of the Lock Frame, you can drag it over to the desired position.  When you move the mouse over the arrow of the desired docking position, the docking area will become shaded in a different color.

12

[Step 4]

Once you release the mouse click, then docking is complete.

Removing a Frame

In order to change the position of the frame, you have to first remove the docked frame and repeat the docking process.  Removing a frame is very simple.  Put the mouse over the frame of interest, then two tabs will appear on the upper right corner, and you need to click on the left tab.

13

Re-inserting a Frame
To re-dock a frame that has been removed, double-click on the Frame Title.

Deleting a Frame
Deleting a frame is just as simple as removing a frame.  When you put the mouse over the frame  you want to delete, the two tabs will appear at the top, then you  can just click on the right tab.

14

Back To Top

SUB) Screen Layout Management

MaxGauge provides optimal comprehensive monitoring views based on the performance management methods, and it also provides the function through which the user is able to customize the monitoring screens to suit his monitoring environment.  That is because even if the most comprehensive optimal monitoring views were provided, it is not easy to adjust to the various users’ different monitoring levels and conditions to meet their needs.  Therefore, MaxGauge  is equipped with the function to store up to 20 frames and screen layouts to satisfy such needs.  The screen layouts can be saved using the following steps.

[Step 1]

Select your choice of frame and dock it onto the main screen.

[Step 2]

Select one of the number buttons in the right bottom corner and then SAVE.

Back To Top

SUB) Settings Methods

The MaxGauge sets the alarms by using the configuration function of the Select Menu.  For example, you can set the alarm for the “Active Session”, one of MaxGauge’s  performance indicators, by following the steps as follows.


[Step 1]

Click on the Configuration on the Select Menu.


[Step 2]

Click on “Alert Configuration” in the Navigation Bar of the Configuration Screen.


[Step 3]

Select the Instance set for alarm from the Instance List.


[Step 4]

Click on ADD from the Stat Alert Tab.


[Step 5]

Enter the required  information and then click the OK button.


The explanation on the required fields is as follows.


Table 1-4. Required Fields for Alarm Setting

Items Explanation
DB Stat Name Select the Alarm Setting Indicators Alarm
Comparison Select >= or <=
Warning Enter the Warning Level
Critical Enter the Critical Level
Repeat Warning generated when it exceeds ( or is below) the set Warning Level, as many as times the Repeat.


[Step 6]

When all information has been correctly entered, then you will be able to see the following.


Back To Top

SUB) Real-Time Monitoring Screen

MaxGauge for Java’s real-time monitoring screen is composed of the following functions to support monitoring of web service execution status in real-time.

  • OS Resource Monitoring
  • Service Execution Status Monitoring
  • Transaction Execution Details Monitoring
  • DB Monitoring
  • Performance Indicators Monitoring
  • Active Transactions Monitoring
  • Throughput and Transaction Statistics Monitoring
  • Alarm Monitoring

Back To Top

OS Resource Monitoring

On the left hand side of the real-time monitoring screen, you will find the OS Resource Monitoring area which provides the CPU and memory usage rate by each server, and the server status information.

15

When you click on the server’s CPU and the memory usage rate area, a window will appear from which you will be able to view the selected server’s OS process list, and the CPU, memory usage rate, and execution argument information of each process.

16

Back To Top

Service Execution Status Monitoring

In the Service Execution Status Monitoring area, you can check the service requests amount per second, service throughput, total number of active transactions, and the number of active transactions by each server, in real-time. Any server which has been shut down will indicate its status as ‘Down’.

17

The active transactions will be indicated in color according to its execution time as follows: blue – for 0~3 seconds, yellow – for 3~5 seconds, and red – for 6 or more seconds.

Back To Top

Transaction Execution Details Monitoring

In the Transaction Monitor Frame, you can check the distribution of execution time of all transactions executed during the last 6 minutes and if any error has occurred or not.

18

By checking the distribution of transactions execution time, you can instantly know whether the service is currently operating smoothly or not.

Back To Top

DB Monitoring

In DB Stat Frame, you can monitor the performance of DB’s that has a connection to WAS.

Back To Top

SUB) DB Performance Status Monitoring

Displays DB’s OS resource usage rate and main performance indicators, and indicates the status of each server.

19

In DB Stat Frame, you can monitor the following items.

20

Indicator Name Description Monitoring Cycle
CPU DB Server’s OS CPU Usage Rate 3 seconds
LOCK DB Server’s Number of Lock Wait Sessions 3 seconds
ACTIVE SESSIONS DB Server’s Number of Active Sessions 3 seconds

Back To Top

SUB) DB Detailed Monitoring

In DB Stat Frame, you can click on the image of the desired DB for detailed monitoring. You can monitor real-time information of the selected DB such as Stat, Wait information, as well as the Active Sessions, and Lock Sessions.

21

The items which you can monitor from the DB Monitor are as follows.

Area Description Monitoring Cycle
TOP CHART AREA DB’s Stat, Wait, and OS Stat Data 3 seconds
ACTIVE SESSION LIST TAB DB Server’s Active Sessions Detailed Information 3 seconds
LOCK SESSION LIST TAB DB Server’s Lock Sessions Detailed Information 3 seconds

The ACTIVE SESSION LIST TAB located at the bottom provides detailed information of the active sessions currently executing in the DB server.

22

Indicator Name Description
Time Time at which transaction information was collected.
Schema Schema Name
Program Program Name
Module Module Name
SPID ORACLE Server Process ID
SID Session’s SID
Wait Current or the latest wait information.
SQL Text Current or the latest SQL statement.
Elapsed Time Time elapsed from the start of SQL execution until now.
PGA(MB) PGA’s current size
Logical Reads The number of Blocks read from the memory at the time of Refresh.
Physical Reads The number of Blocks read from the DISK at the time of Refresh.
Block Changes The number of Block changes from the session logon time until now.
Hard Parse Count Hard parse average value per second generated during a session.
Command Type Type of SQL executed (SELECT, INSERT, UPDATE, and etc.)
Execution Count (Sigma) Cumulative SQL execution count from the session logon time until now.
Machine Machine Name

In the LOCK SESSION LIST TAB at the bottom, you will find detailed information of sessions currently waiting on the Lock in the DB server.

23

Indicator Name Description
SPID ORACLE Server Process ID
SID Session’s SID
Hold Lock Type Hold lock type of the session holding the Lock.
Hold Mode Lock Mode set in the target object.
Wait Lock Type Wait Lock Type of the session requesting the Lock.
Request Mode Lock mode of the session trying to use the target object.
Object ID Target Object ID
Status Current session status
Wait Current or the latest wait information.
SQL Text Current or the latest SQL statement.
Elapsed Time Time elapsed from the start of SQL execution until now.
WAS WAS Name
Transaction Name of transaction currently in progress.
Program Program Name
Module Module Name
Action Action name given to the session
Schema Schema Name
Machine Machine Name
OS User Session’s OS User Name
Logon Time Session’s logon time
Serial Session’s serial number
User Name User name of WAS transaction currently using the session.

Back To Top

SUB) Service Indicator Monitoring

The Service Indicator Frame provides the data with which you can compare and analyze yesterday and today’s performance indicators per minute, from the service perspective.

24

The service indicators which you can monitor are as follows.

Indicator Name Description
Concurrent Users Number of users logging on concurrently per minute.
TPS Transaction per second throughput (1minute average)
Execute Count Number of transaction executions (Total Sum of 1 minute duration)
Avg Elapse Time(sec) Transaction average execution time (second)

Back To Top

SUB) Performance Indicator Monitoring

In the Performance Indicator Frame, you can monitor the execution performance by each server during the last 2 minutes.

25

The performance indicators which you can monitor are as follows.

Indicator Name Description
Concurrent Users Number of users logging on concurrently.
Active Transactions Number of transactions processing in the server.
TPS Transaction per second throughput
JVM CPU Usage (%) JVM process CPU usage rate
JVM Free Heap (MB) JVM process heap memory availability
JVM Heap Size (MB) JVM process heap memory size

Back To Top

Active Transaction Monitoring

In the event of a system error, you must be able to monitor the process status of the currently active transactions in order to accurately analyze the problem.  MaxGauge for JAVA provides the function for monitoring active transactions taken for every 3 seconds, which allows you to check detailed information as to know which transactions are currently active in which server.

26

The indicators which you can monitor in the Active Transaction Frame are as follows.

Indicator Name Description
Agent Server name in which the transaction is being executed.
Transaction Name of transaction currently being executed.
Class Method Name of class method currently being executed.
Elapsed Time Transaction execution time
Elapsed Time Ratio (%) Transaction execution time ratio ( WAS : DB )
DB Time Transaction’s query execution time
SID DB session ID used in the transaction.
State The state of OS thread currently executed by the transaction.
SQL 1 SQL text last executed by the transaction.

Back To Top

SUB) DB Lock Connection Monitoring

In the event of transaction delays due to a DB Lock, it may take a long time or even be impossible to identify the transaction which caused the lock.  MaxGauge for JAVA provides data through which you can instantly check the transaction which caused the DB lock and the transactions waiting on the lock, in real-time.  The lock holder and the waiter sessions are displayed in a tree structure so you can easily recognize the details.

27

The indicators which can be viewed in the Lock Tree Frame are as follows.

Indicator Name Description
SID DB session ID used in the transaction.
Agent Server Name in which the transaction is being executed.
Transaction Name of the transaction currently being executed.
Elapsed Time Transaction execution time.
DB Time Transaction’s query execution time.
State The state of OS thread currently executed by the transaction.
SQL 1 SQL text last executed by the transaction.

Back To Top

Alarm Monitoring

In the event of system failures or performance delays in the service, you may receive alarm notifications through the real-time screen.  Alarms are generated when there is a problem in the server status, or any data which exceeds the set threshold values is received.  Real-time alarms are expressed in three formats.

    • Table Format Alarm

28

    • List Format Alarm

29

    • Score Board Format Alarm

30

Back To Top