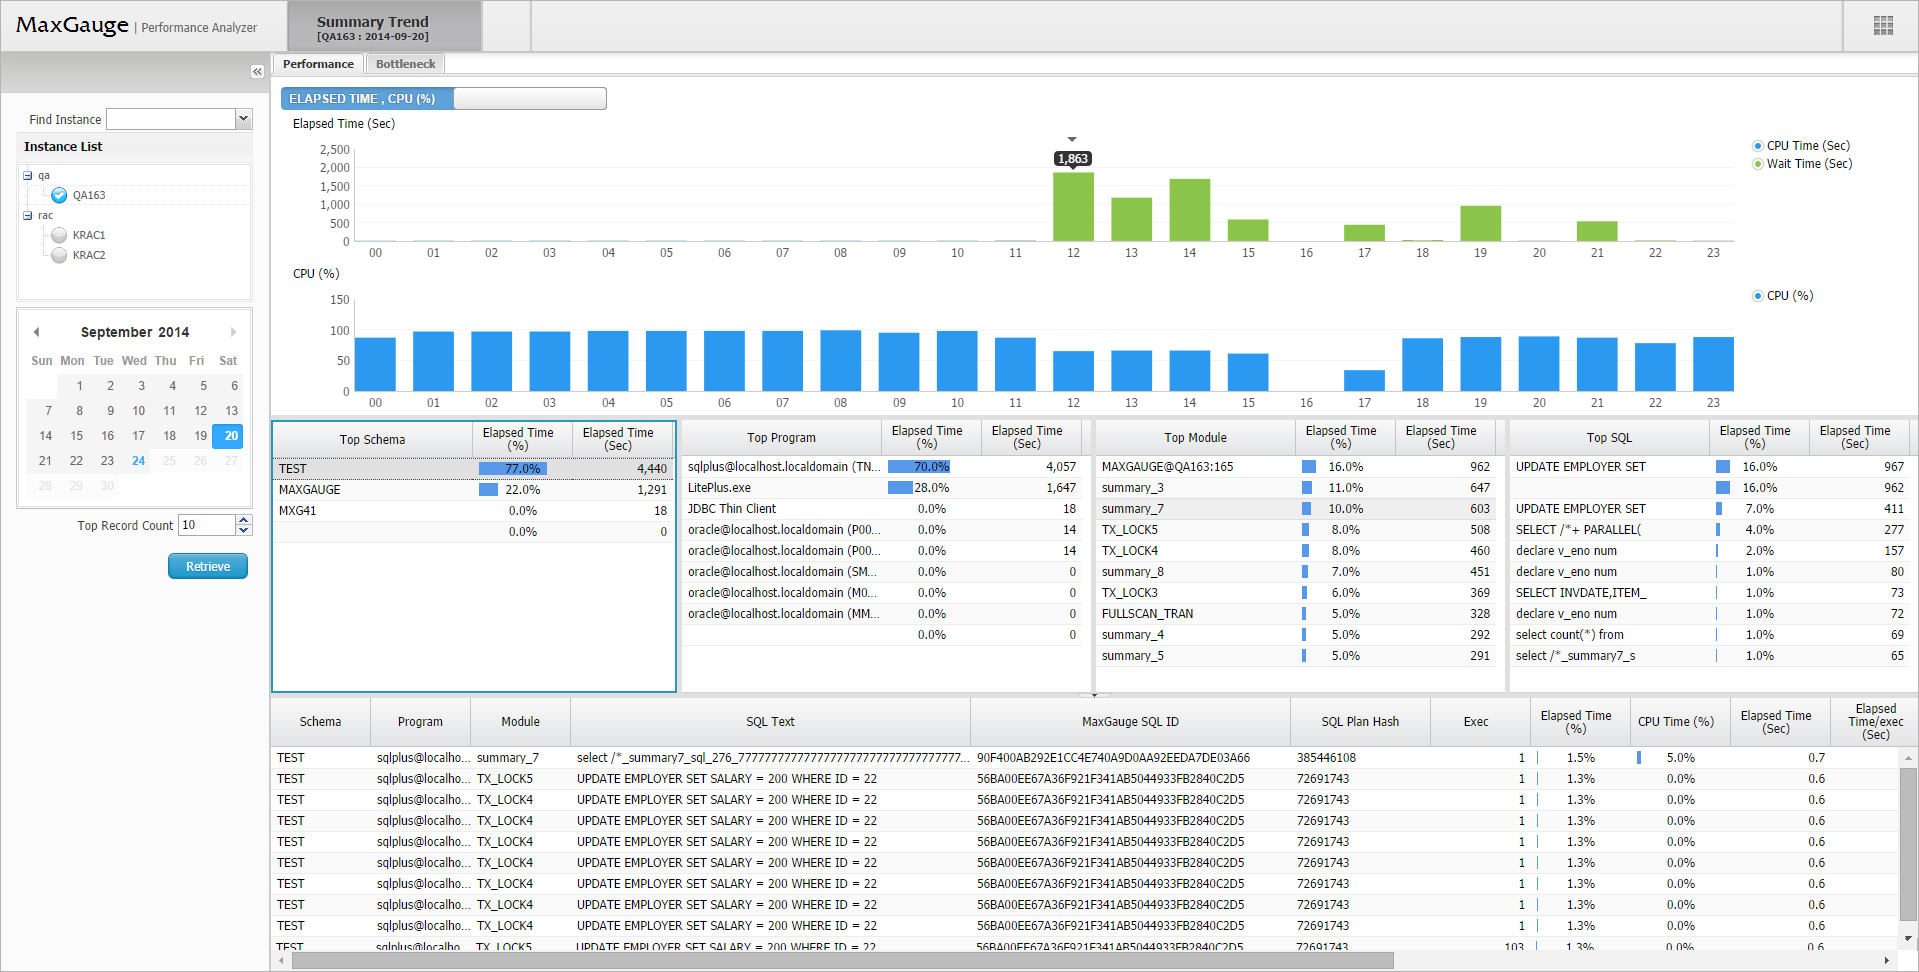
Summary Trend for Performance provides historical trend bar graph of important performance indicators and top list of schemas, programs, modules and SQL for the specific time period.

Summary Trend for Performance provides historical trend bar graph of important performance indicators and top list of schemas, programs, modules and SQL for the specific time period.
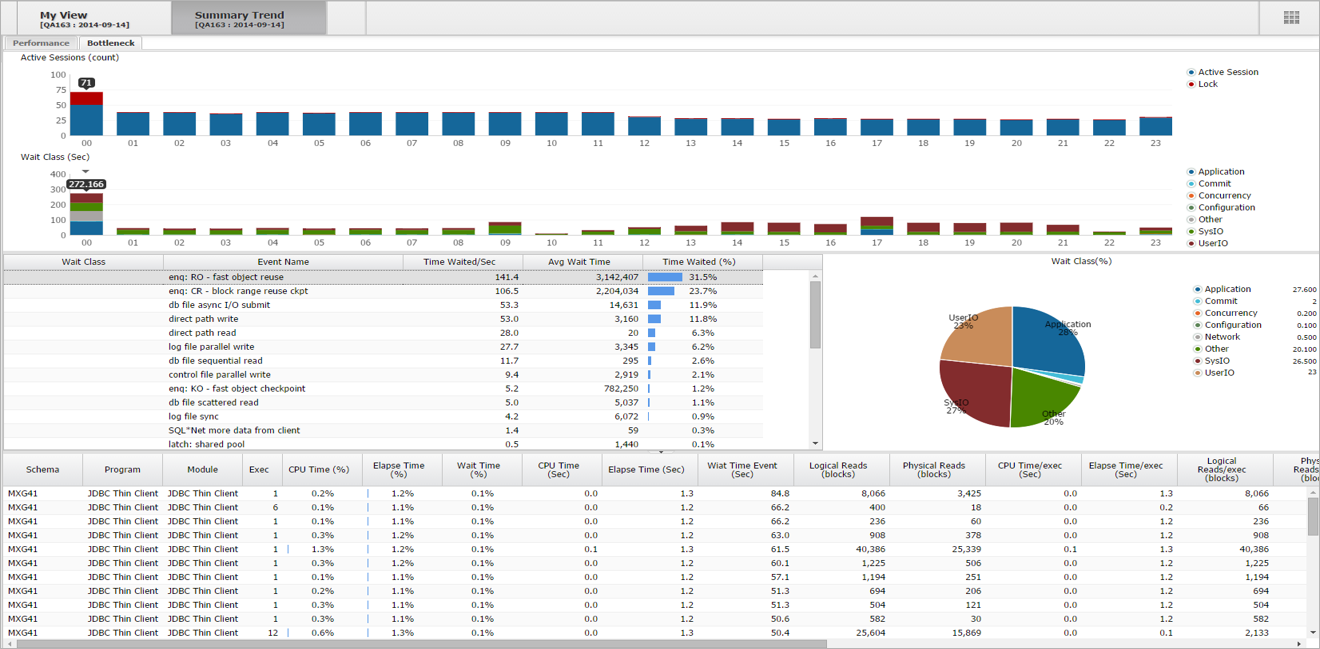
Summary Trend for Bottleneck provides hourly count of active sessions and wait classes based on wait events. It also pulls out the list of wait events and related queries for more detailed information.
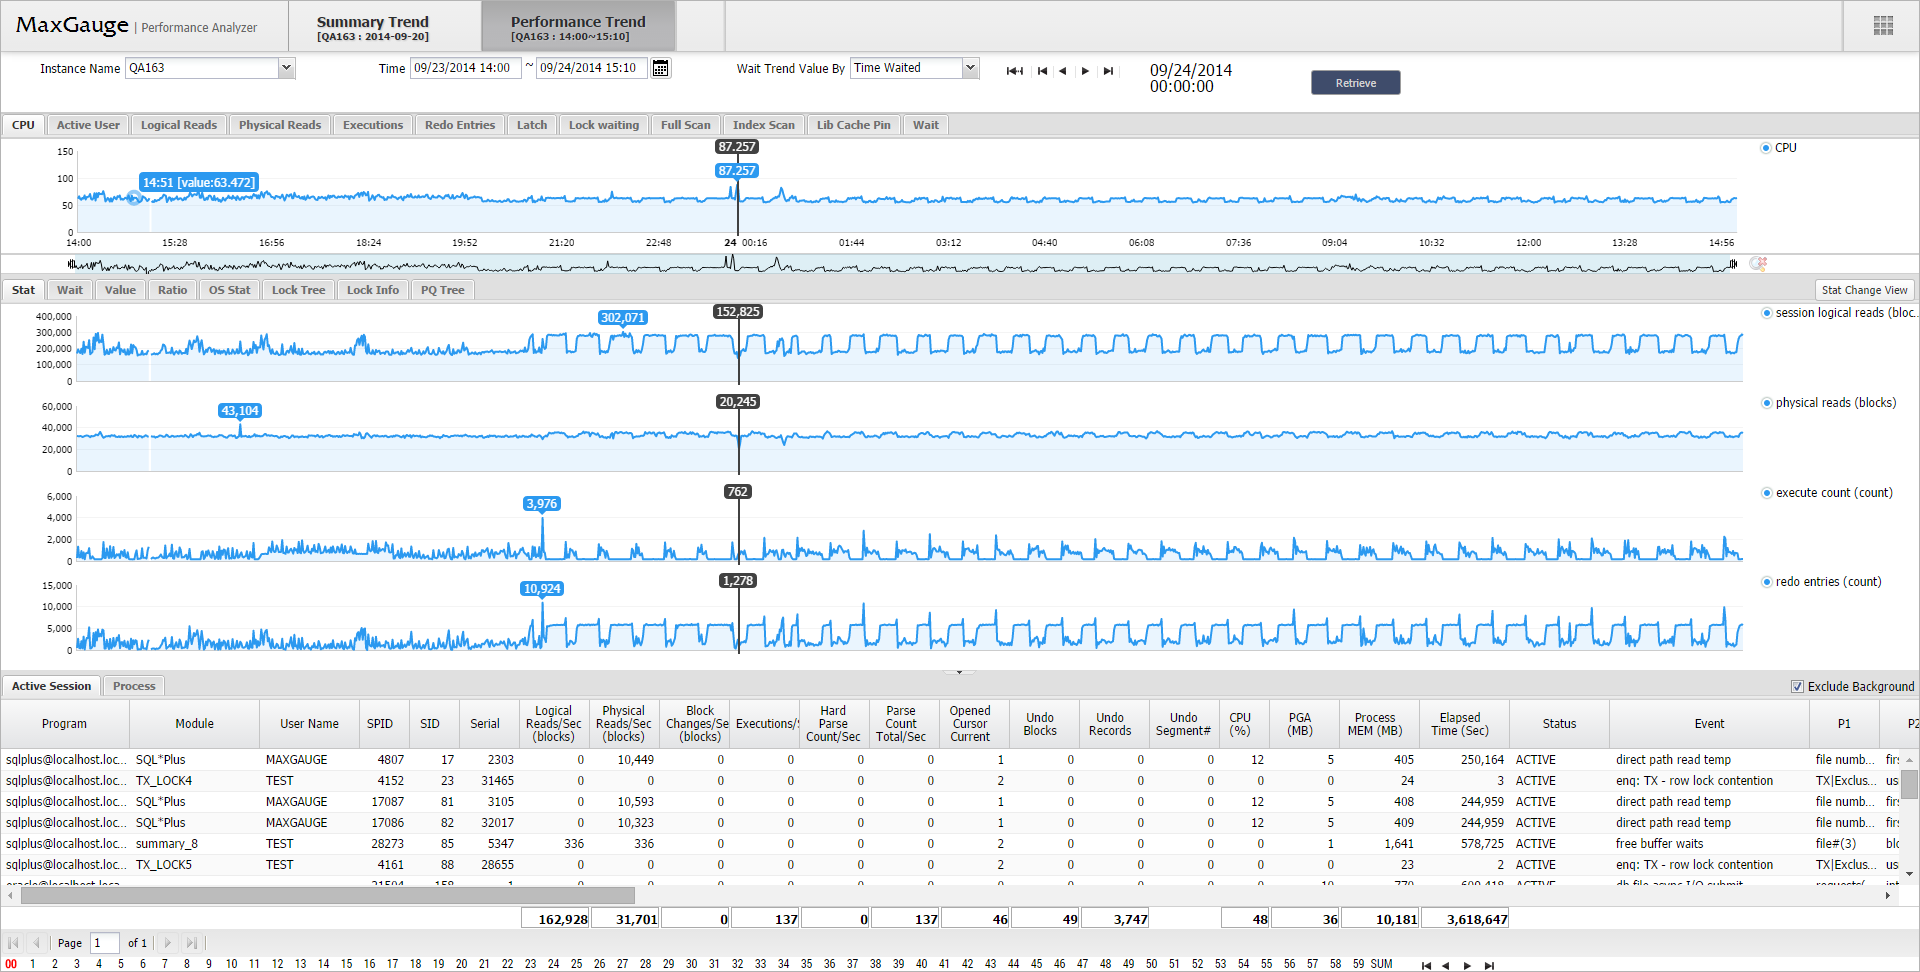
Performance Trend provides detailed analysis on performance indicators and active sessions as well as lock tree and PQ tree.
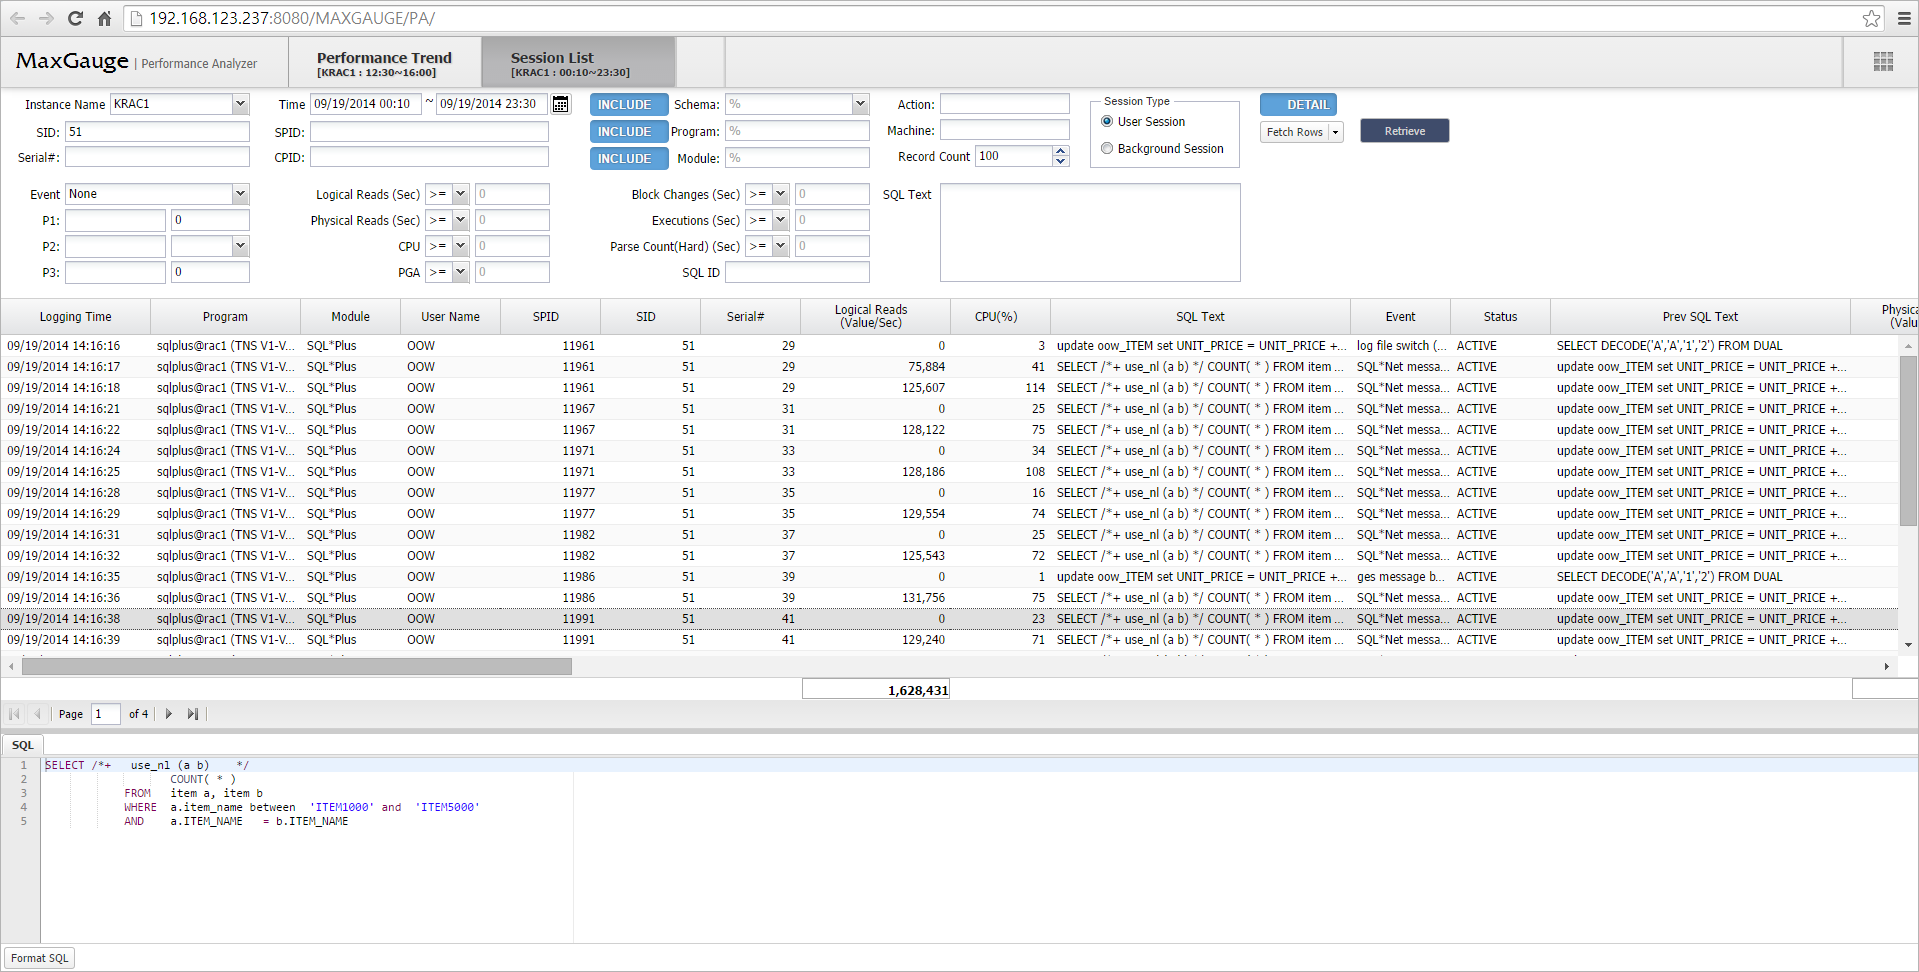
Maxgauge provides accurate post analysis filtering by SID, SPID, program, SQL text, executions and etc. at a one second interval. Therefore users can precisely pinpoint performance issues at specific moments in time.
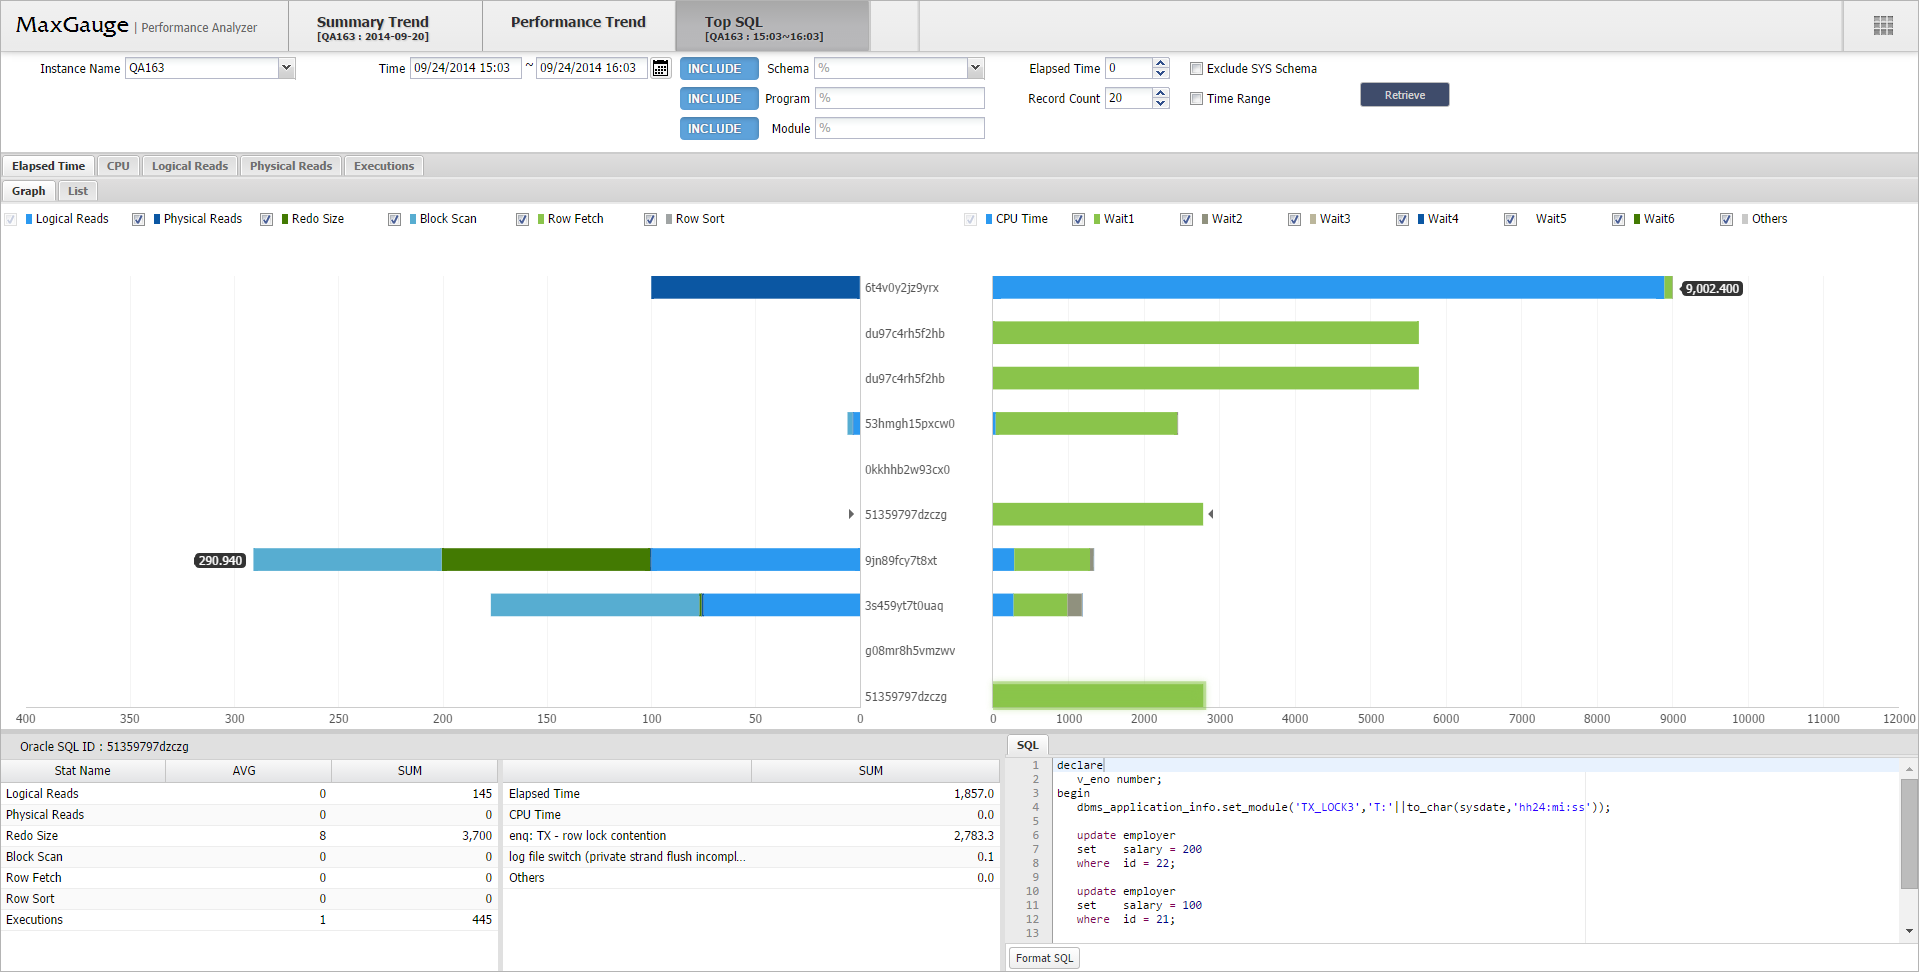
TOP SQL provides historical record of top-N SQL list based on elapsed time, CPU time, logical reads, physical reads, and executions count to find any performance issues.
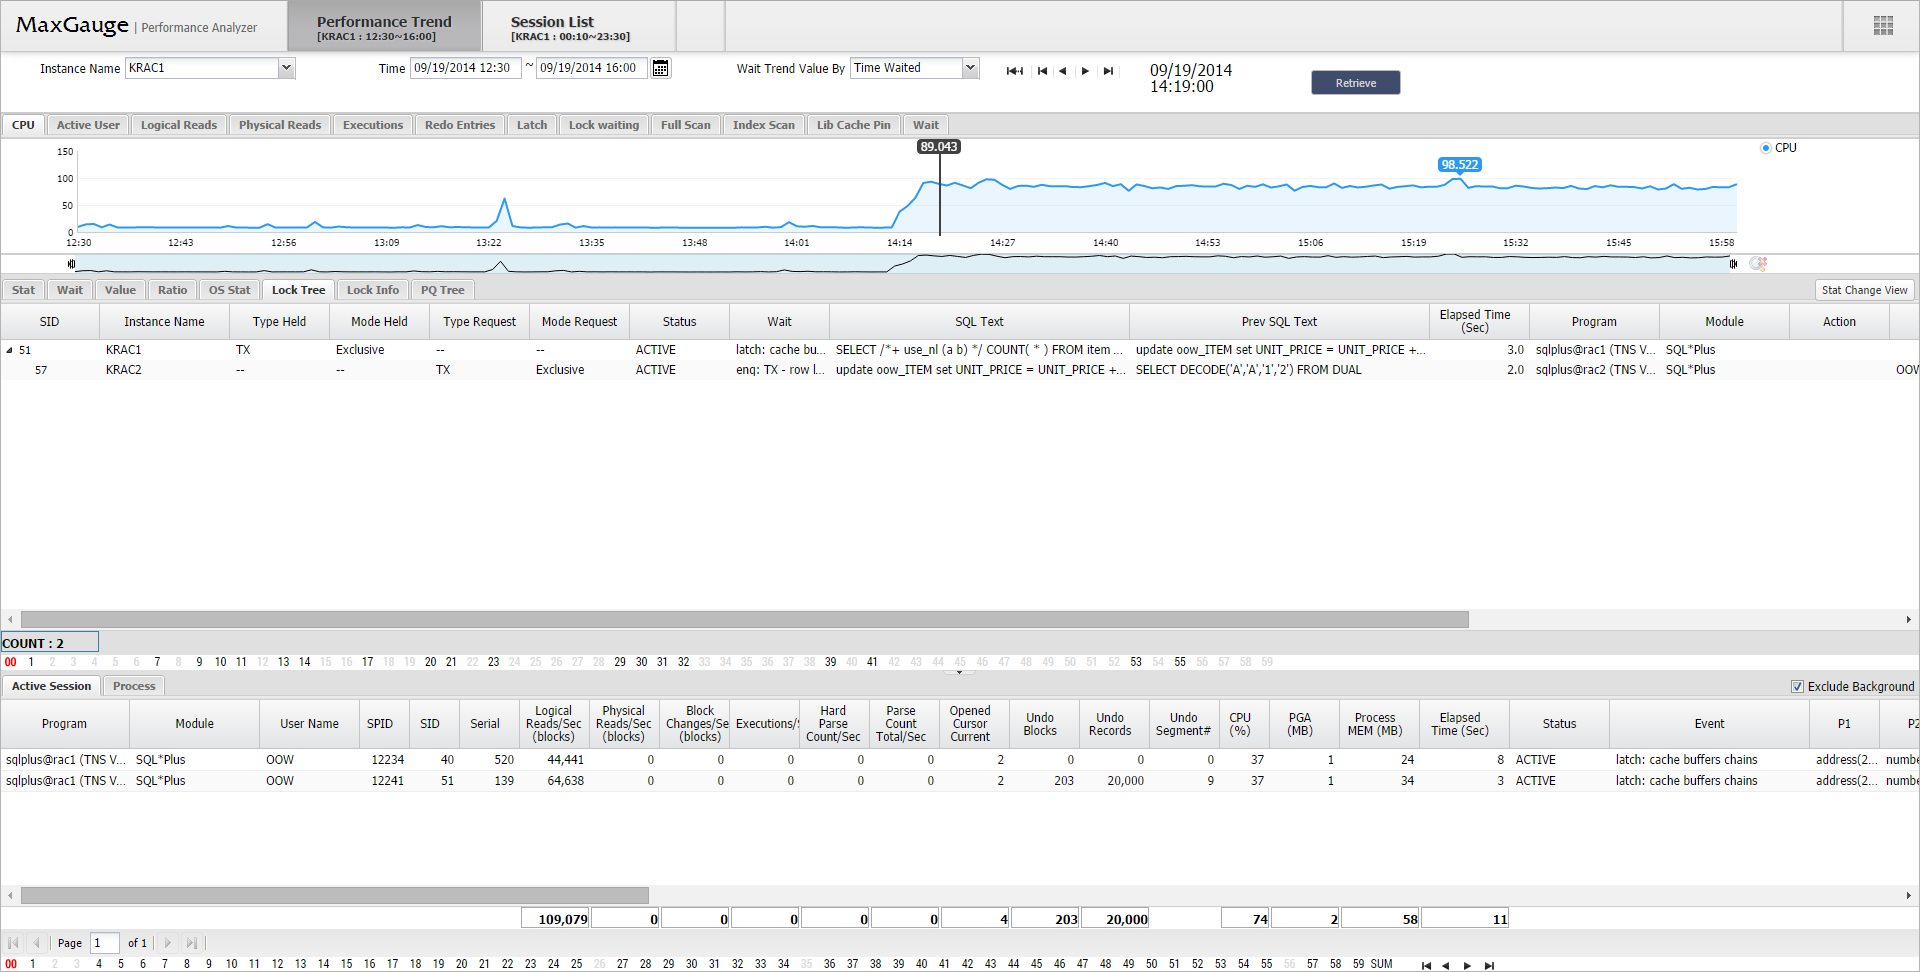
Global Lock Analysis provides high accuracy in detecting the cause of lock waiting events by lock session logging at a one second interval.
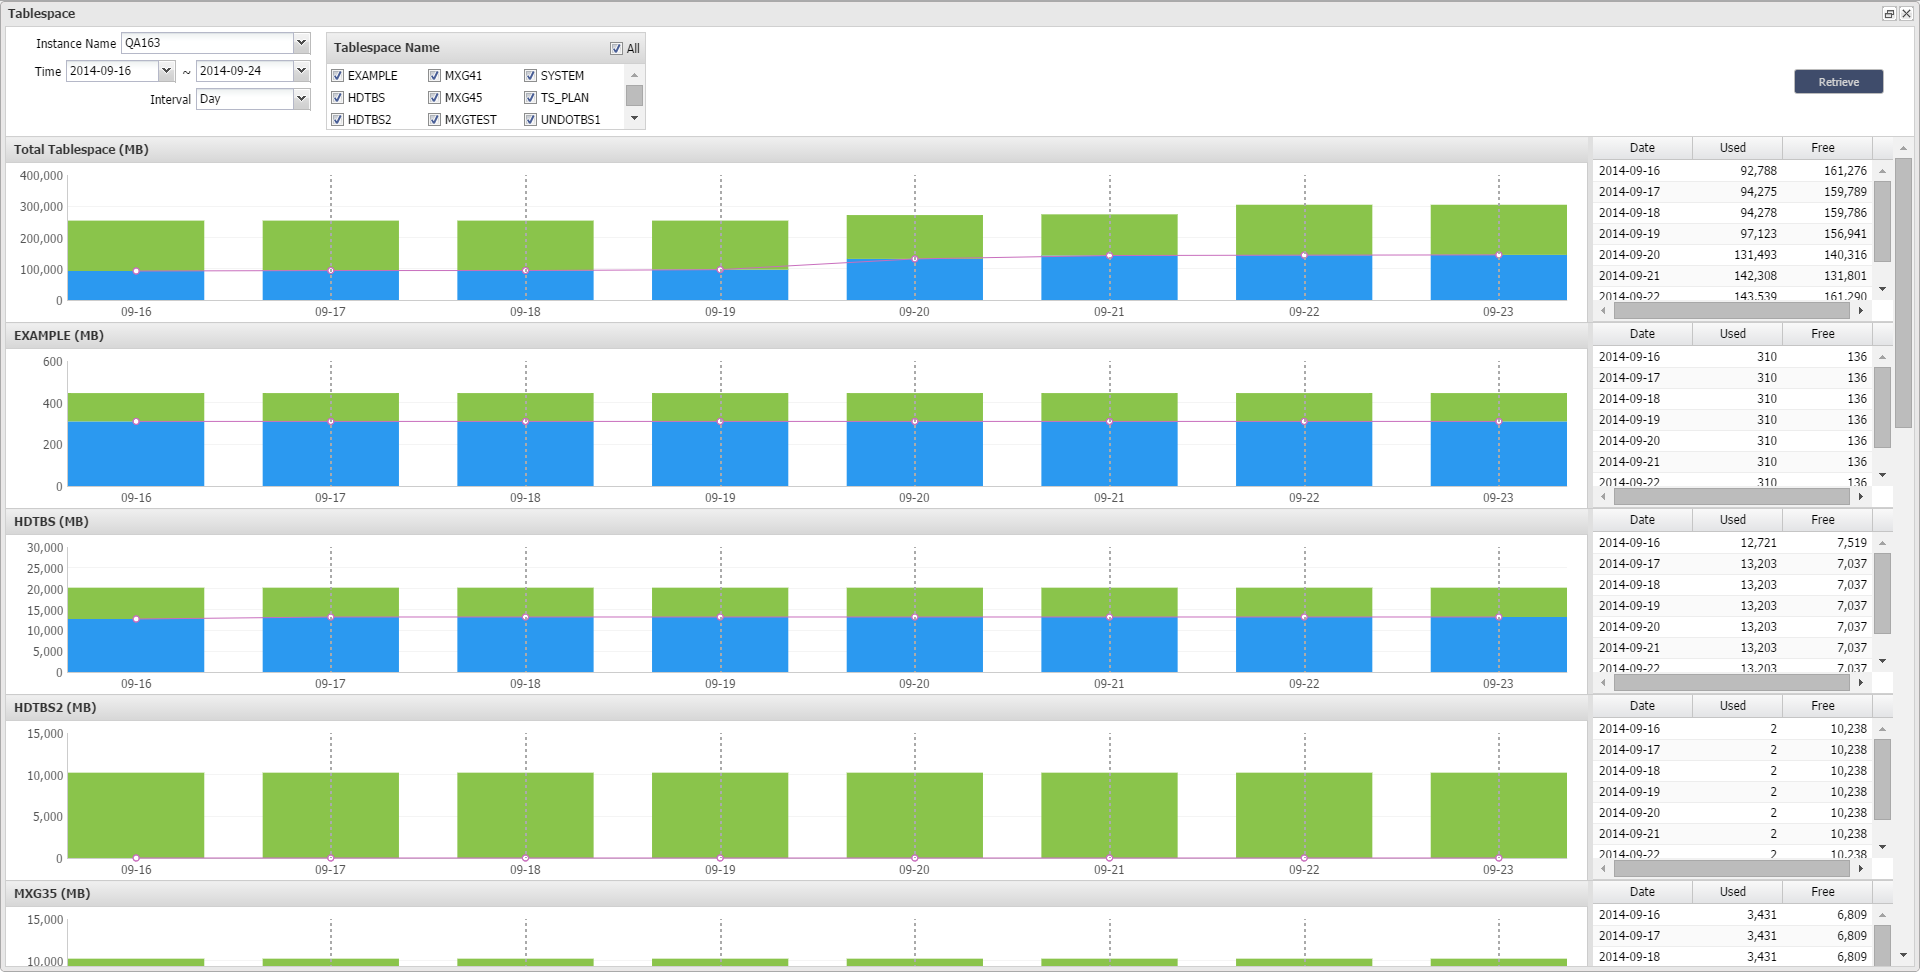
Tablespace Trend provides trend of daily or monthly tablespace usage and free size.