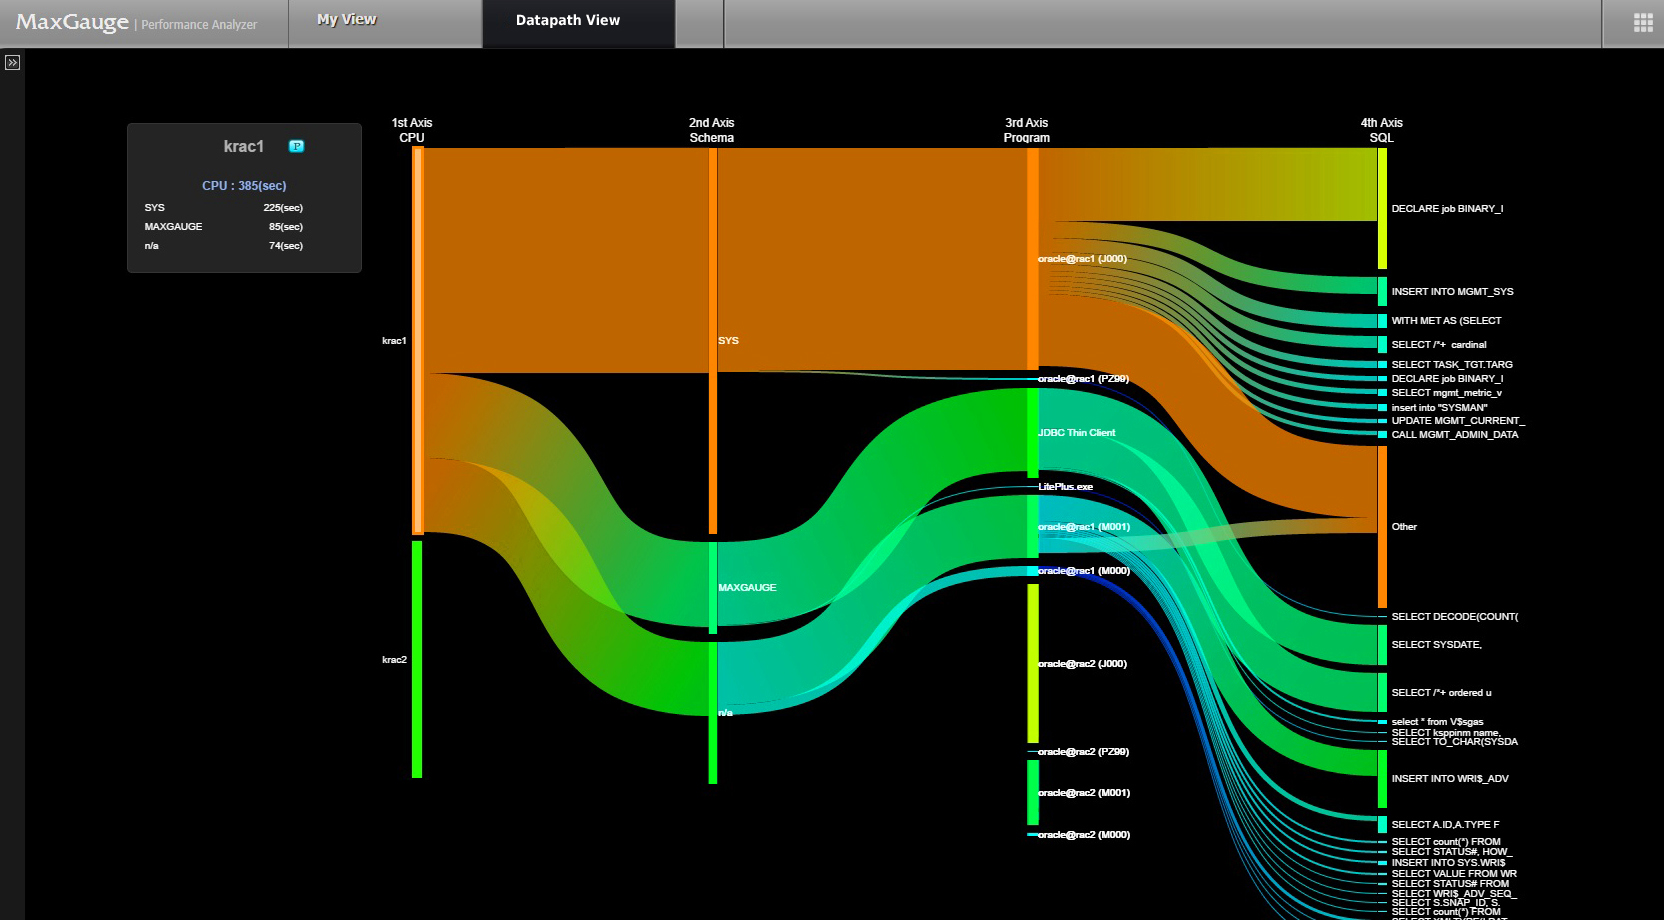
Dathpath View provides performance comparison analysis and correlation analysis on instance, schema, program and SQL for multiple databases or multiple dates on a single database. In order to visualize this view, flow visualization has been used.

Dathpath View provides performance comparison analysis and correlation analysis on instance, schema, program and SQL for multiple databases or multiple dates on a single database. In order to visualize this view, flow visualization has been used.
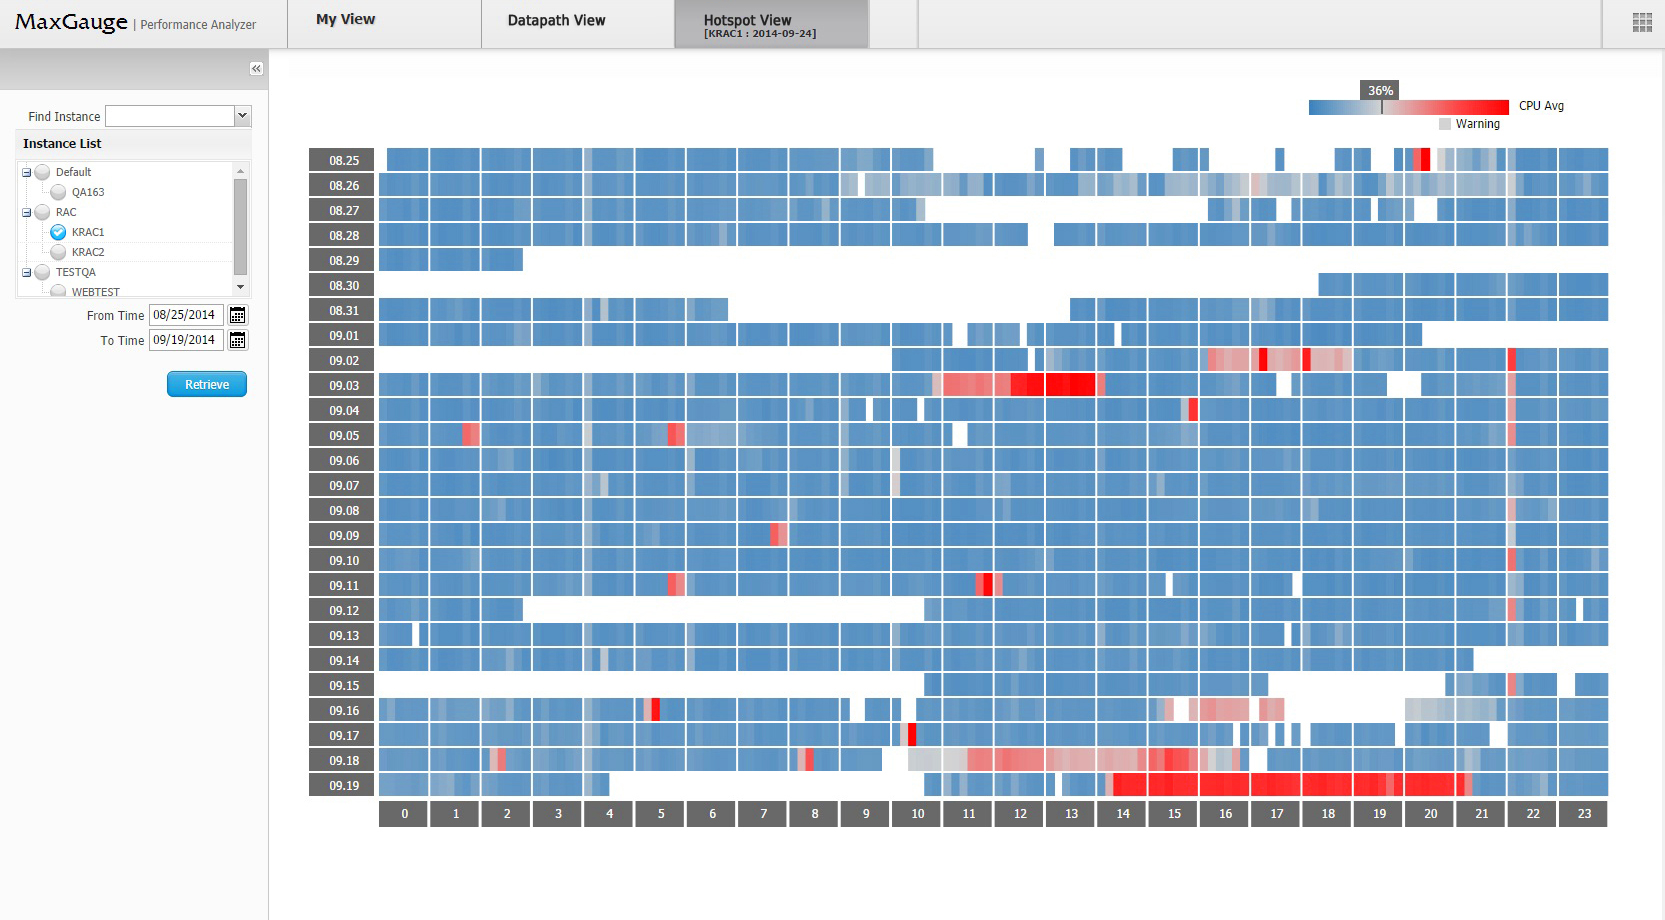
Hotspot View provides hot spot analysis based on CPU(%) for multiple databases or multiple dates on a single database. In order to visualize this view, heat map visualization has been used.
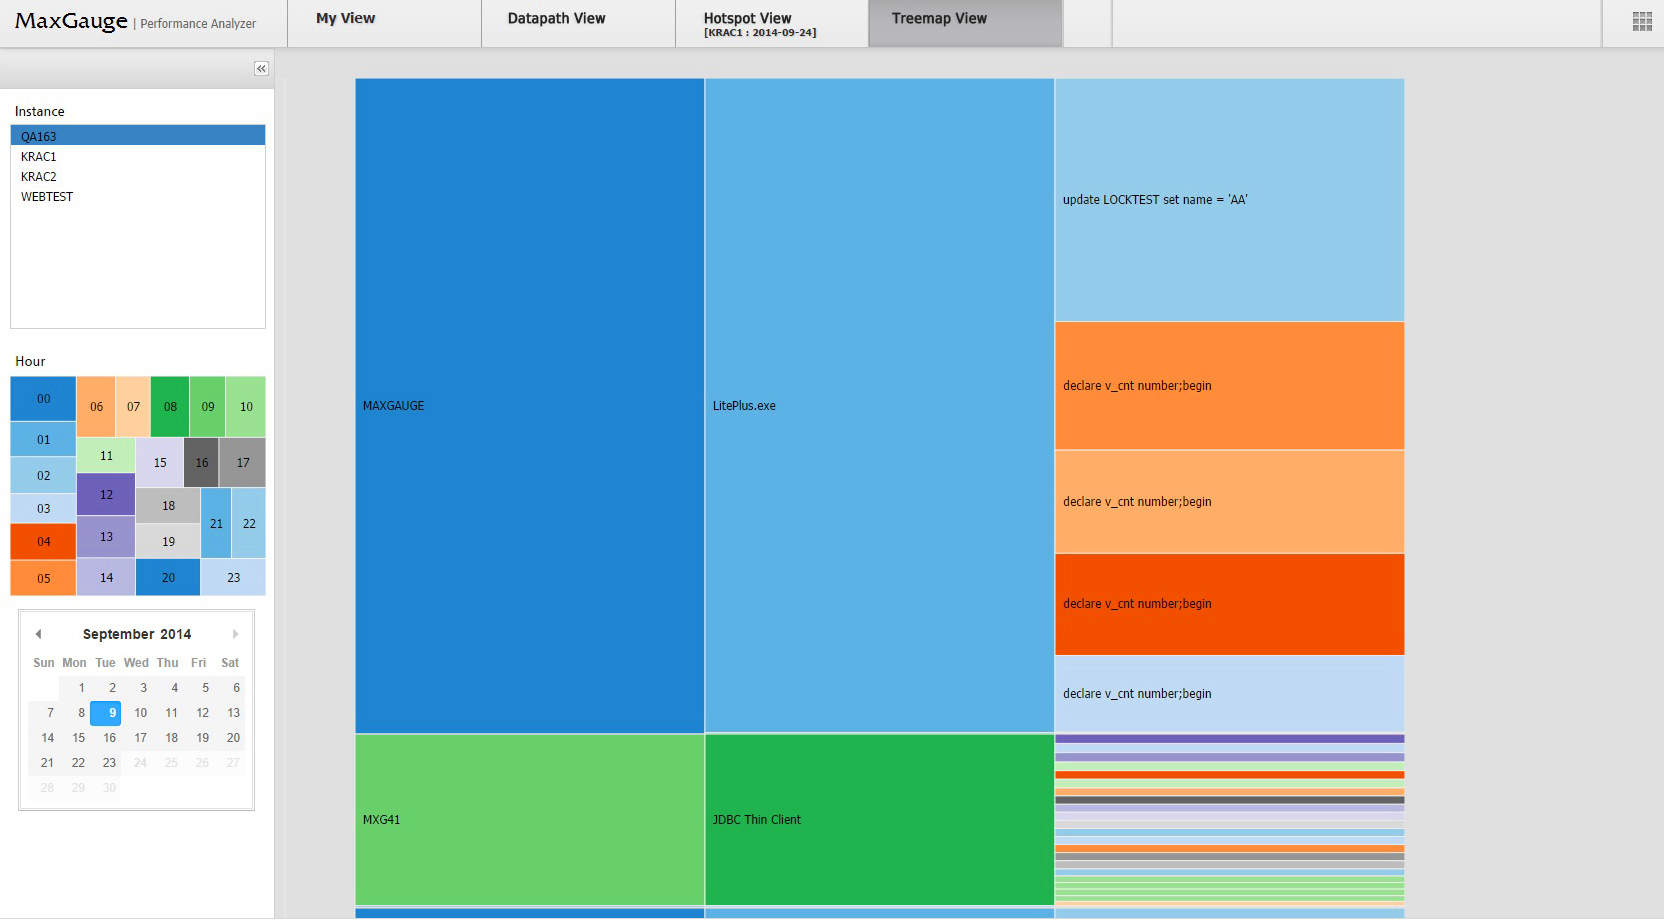
Treemap View provides time-based analysis in hierarchical squares and also hourly comparison of SQL elapsed time. In order to visualize this view, tree mapping visualization has been used.
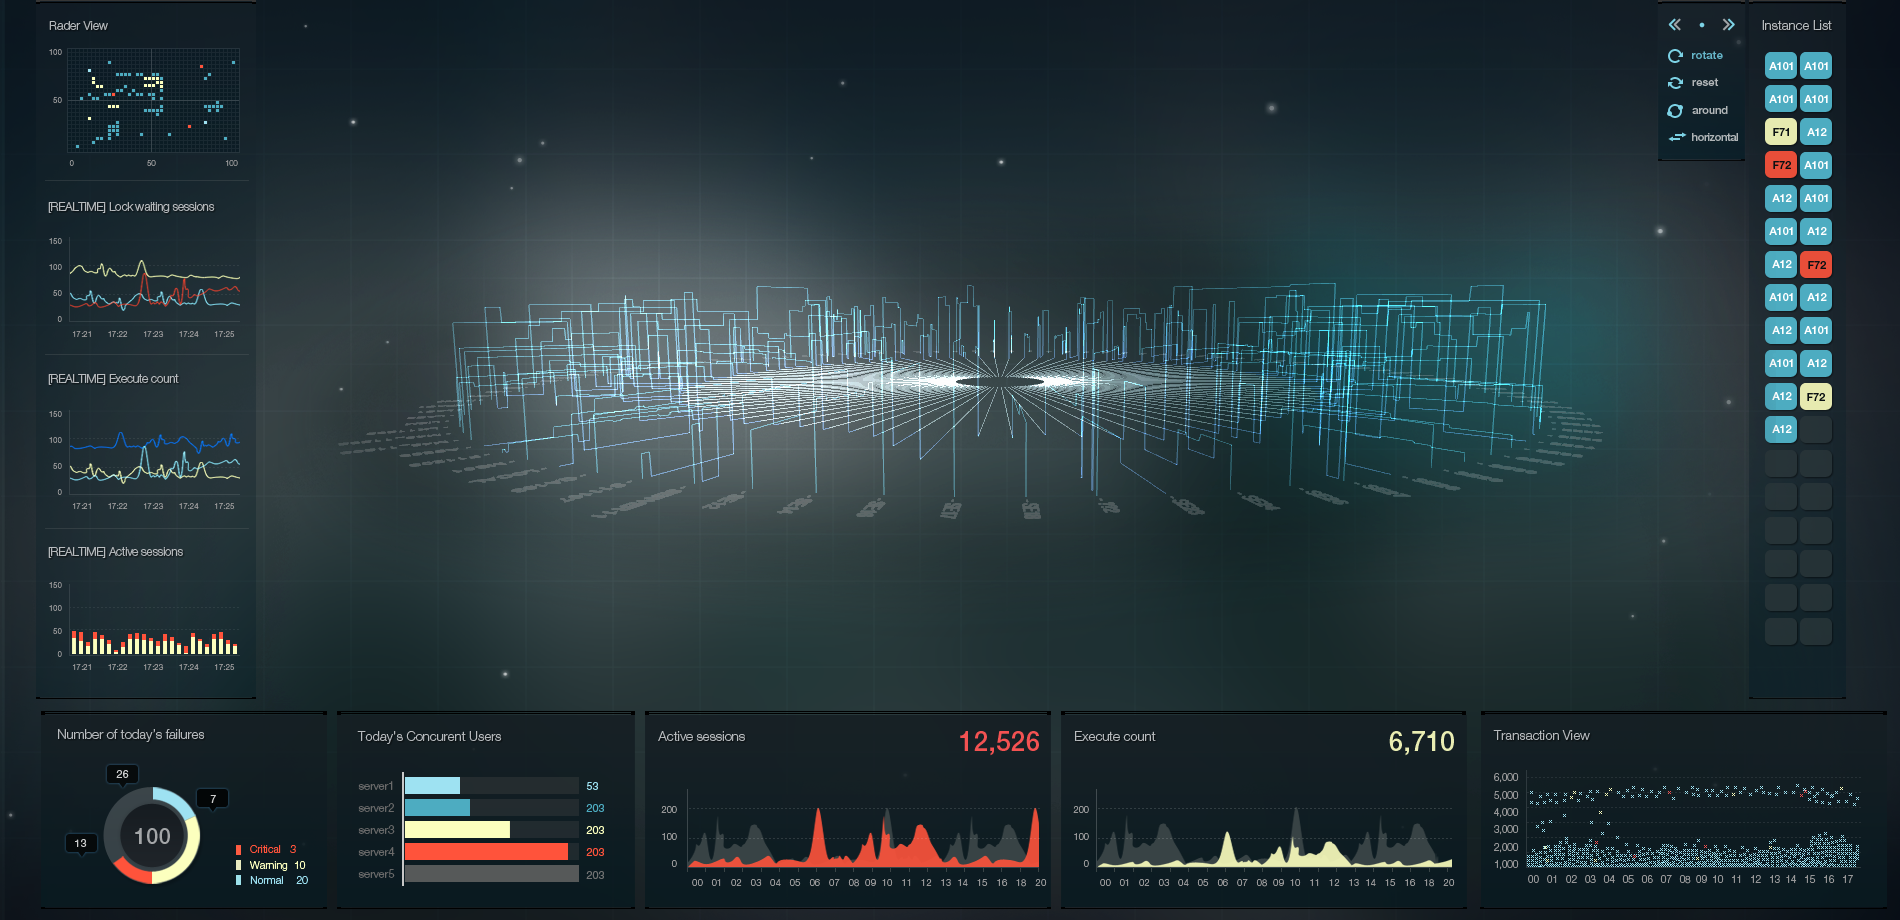
MaxGauge for Dashboard gives you comprehensive and integrated monitoring on hundreds of different databases (ORACLE, DB2, SQLServer, My SQL).
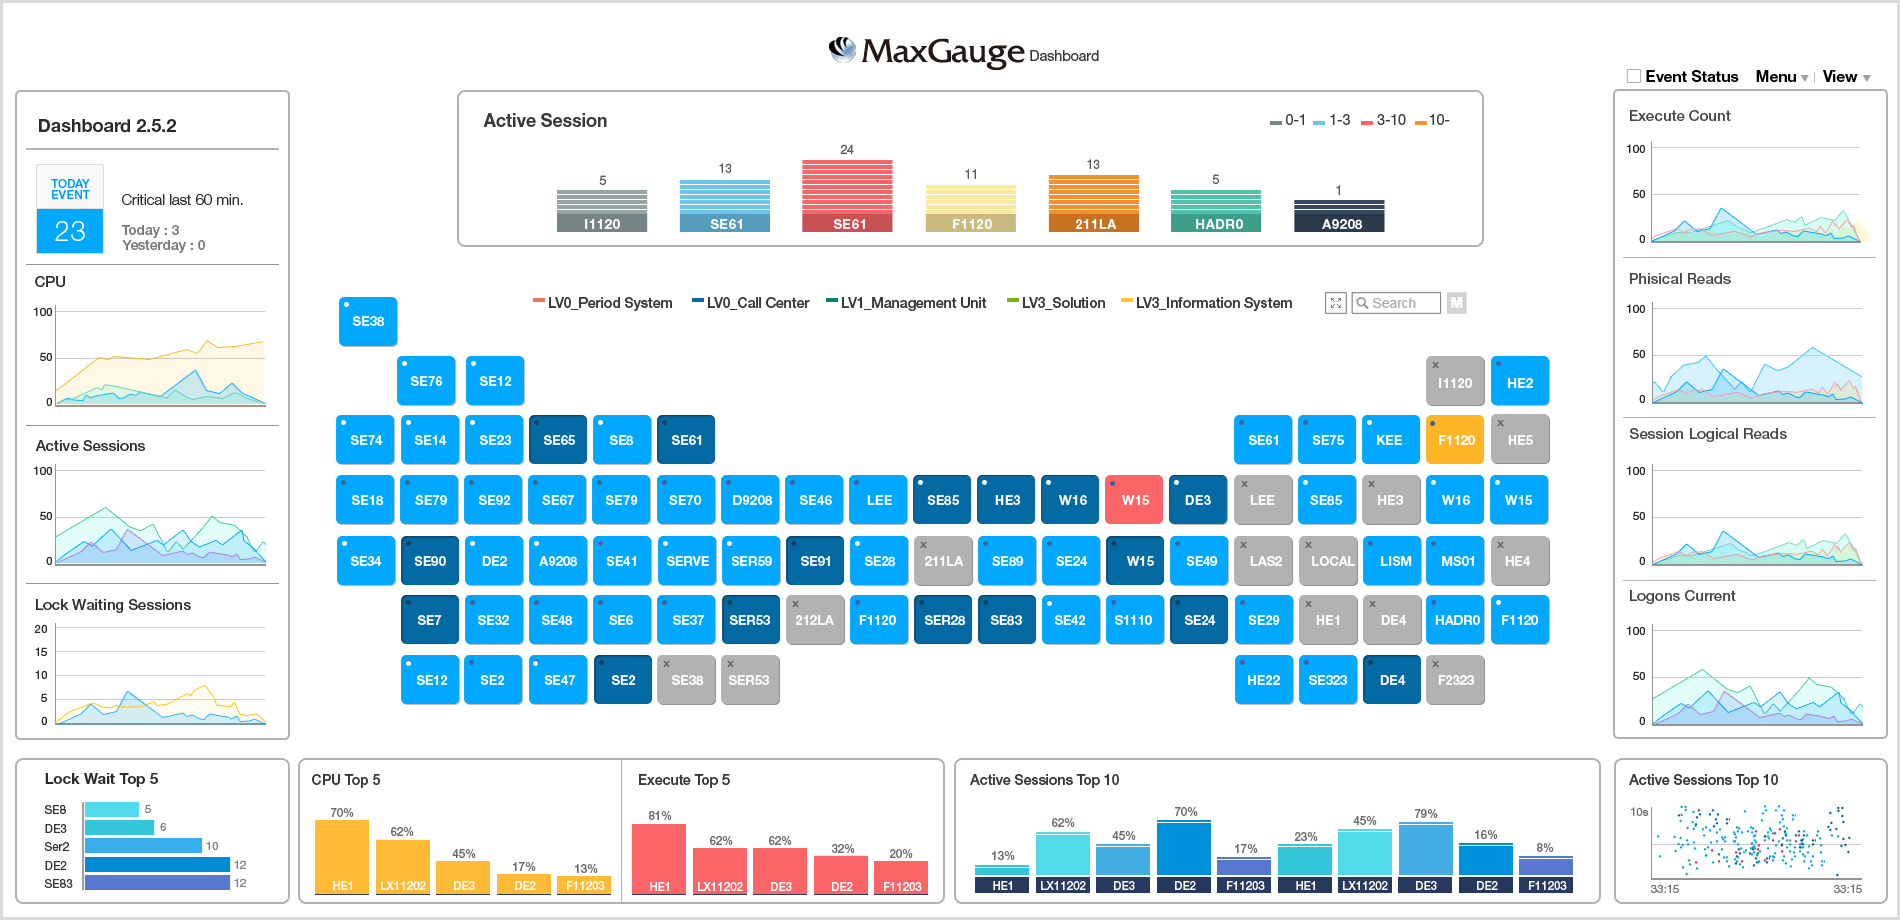
MaxGauge for Dashboard gives you comprehensive and integrated monitoring on hundreds of different databases (ORACLE, DB2, SQLServer, My SQL).