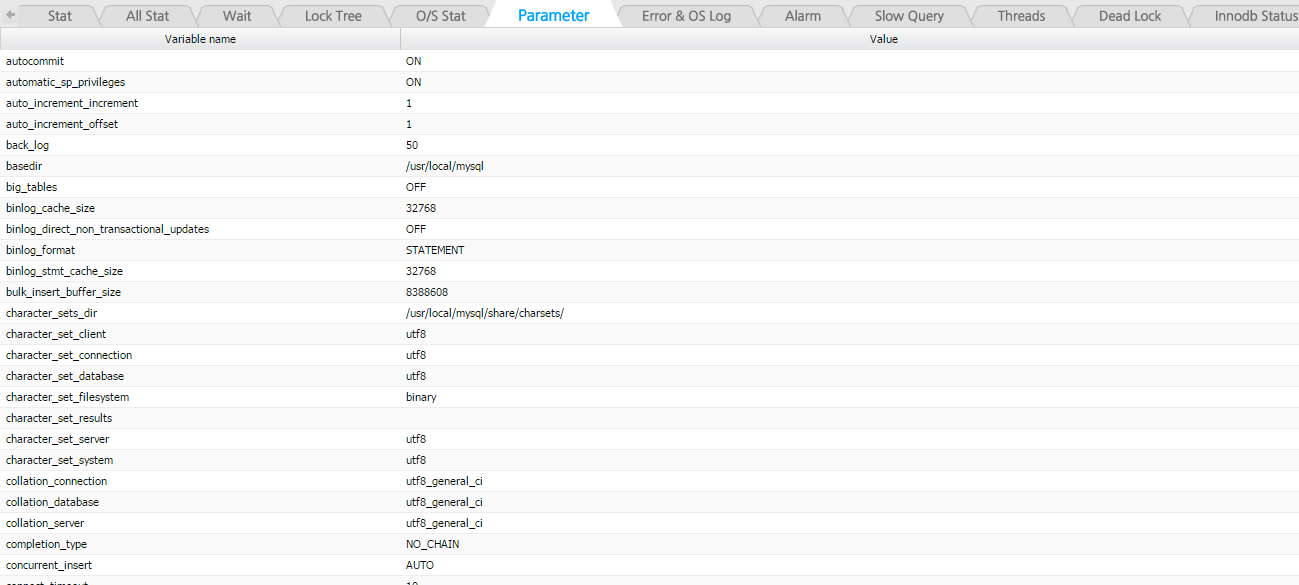
Parameter
Provides parameter information. Parameter information is logged once a day.
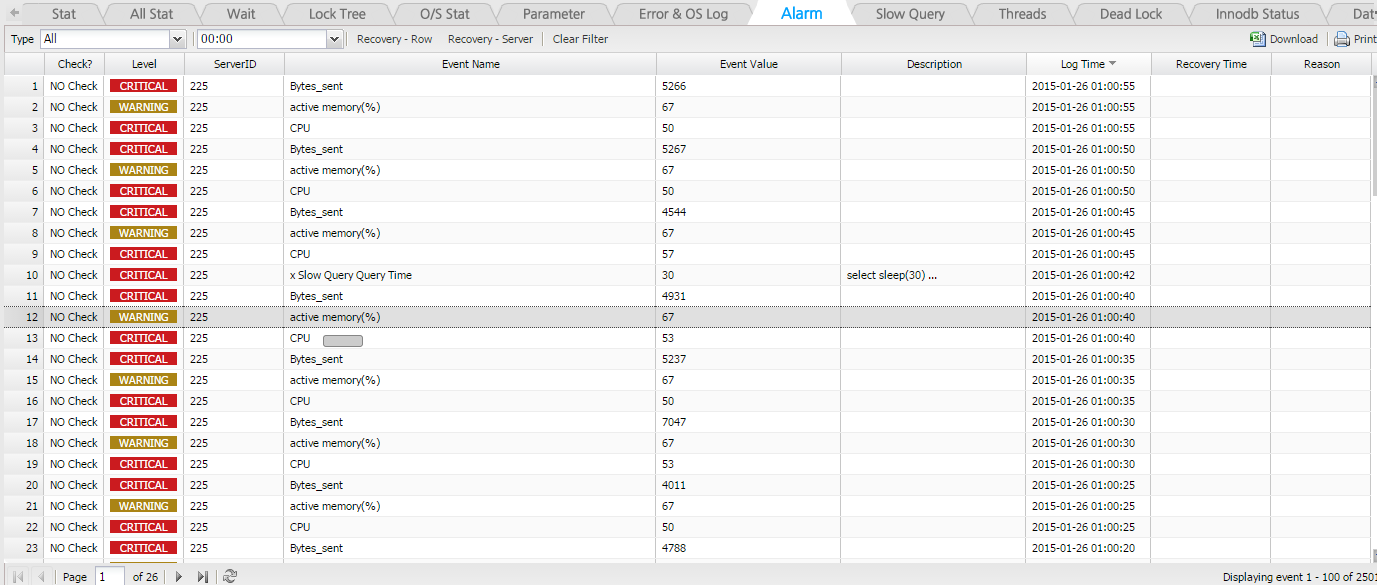
Alarm
In the event alarms are generated for the indicators for which threshold values have been set up in the Admin’s Alarm Setup, the alarm details of the corresponding time will be logged. You can check the alarm time and details through the Performance Analyzer.
- When you find red (or yellow) points on the graph, it means that alerts have been generated for the corresponding time according to the threshold values set by the user.

- Click on the corresponding time and go to the Alarm Tab and you will find the details of alarms generated as shown below.
Slow Query
Provides the Slow Query information. Displays the slow queries within the 1 minute of the time period searched with an X symbol. You can select a specific segment with a mouse drag and navigate to its details to use the Plan and Thread Tracking function.
( X-View : Slow query 1minute Data )
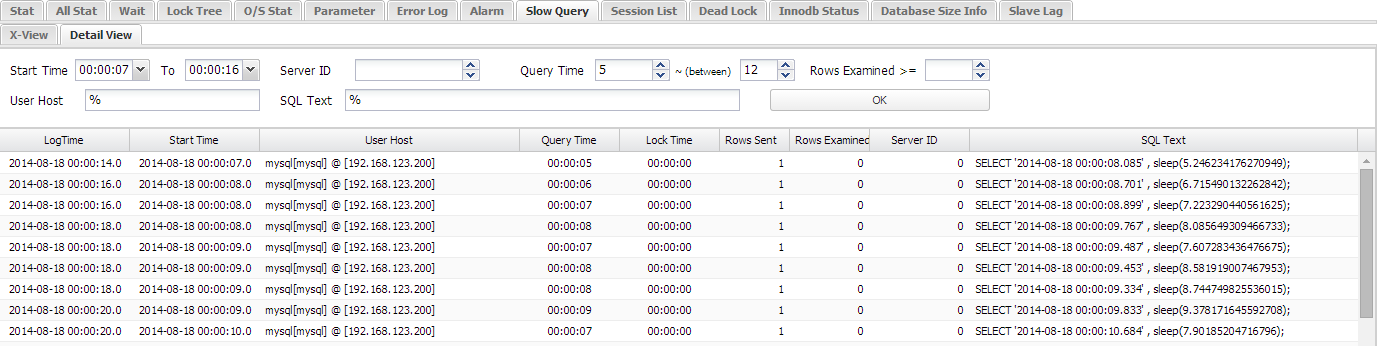
Details View Screen
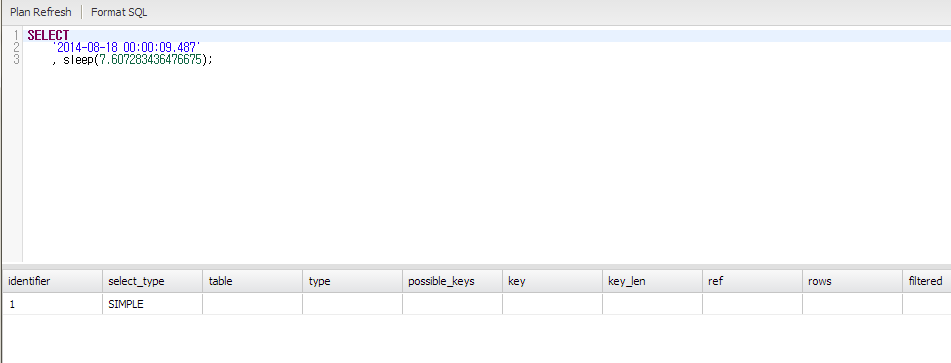
( Double-Click to see Real-Time Plan View )
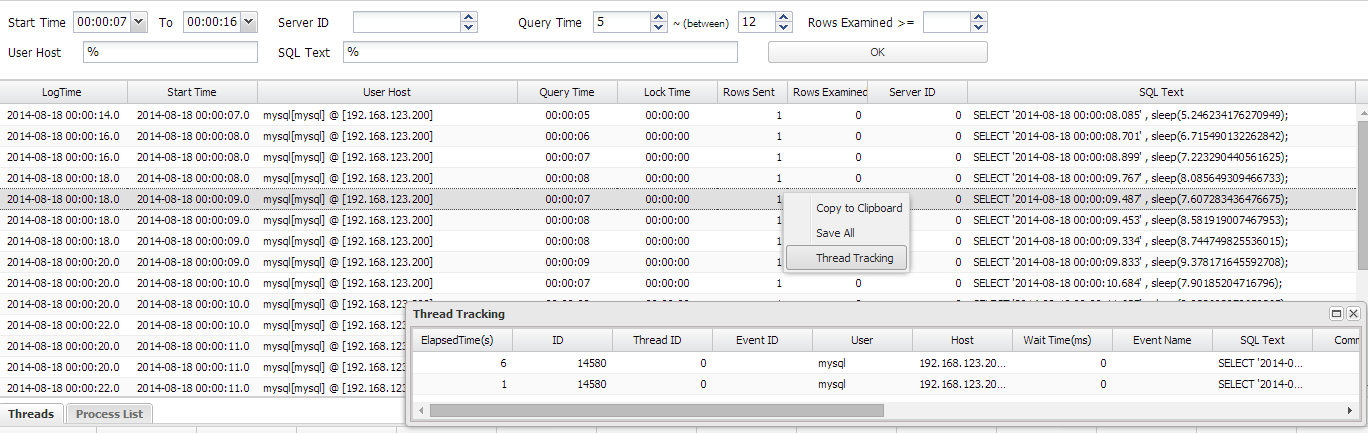
( Thread Tracking function on the Mouse Right-Click Menu능 )