When a Full GC occurs, the application run will temporarily pause and if it is prolonged, then it can cause a delay in the entire services. Because GC has a direct impact on the service, the GC Status Data is one of the important indicators in monitoring applications.
Analyze the service delays or pauses in JVM due to Full GC.
Image1. Analysis of Service Pauses Due to Full GC
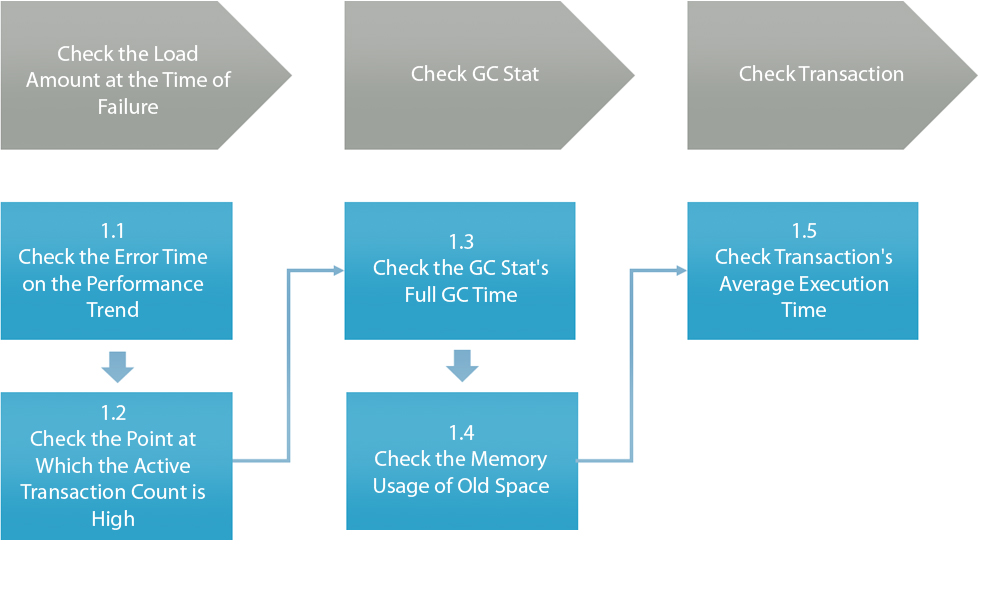
Step1.1 Check the Error Time on the Performance Trend

Step1.2 Check the Point at which the Active Transaction Count is High

Step1.3 Check the GC Stat’s Full GC Time
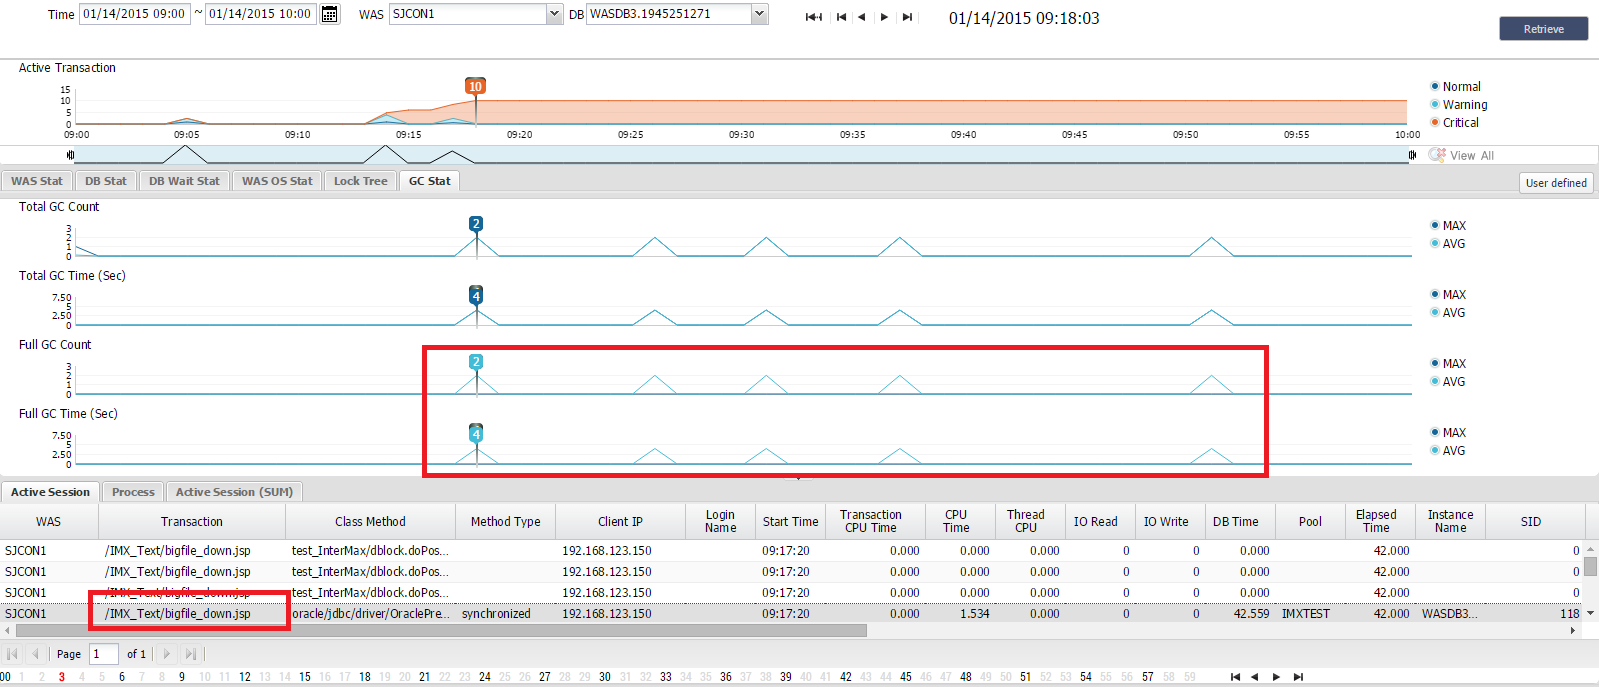
(!) Check Results:You will see that since the increase in the active transactions load, the Full GC of about 4 seconds GC Time is occurring frequently.
Step1.4 Check the Memory Usage of Old Space
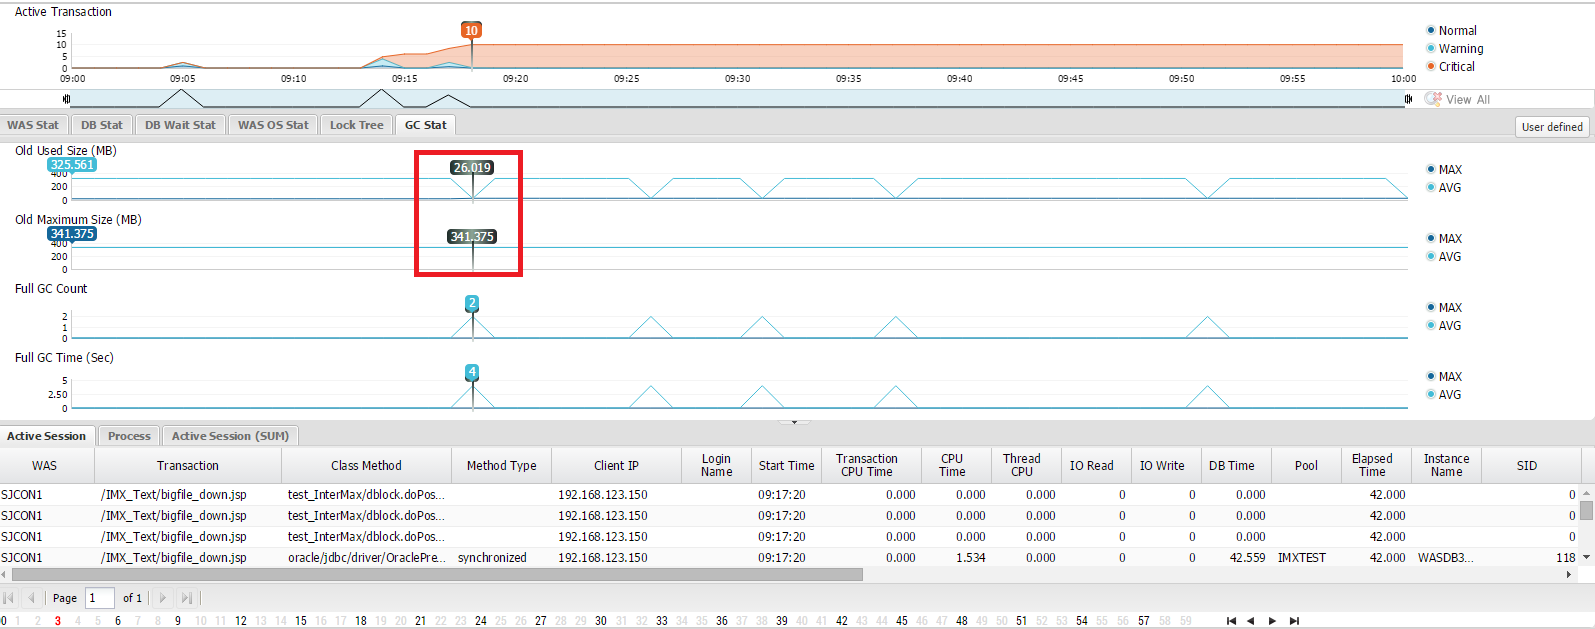
(!) Check Results: You can know that JVM old area’s memory usage has almost reached the maximum limit, and though the occurrence of Full GC freed up the memory, however, it went back up to the limit.
Step1.5 Check the Transaction Average Execution Time
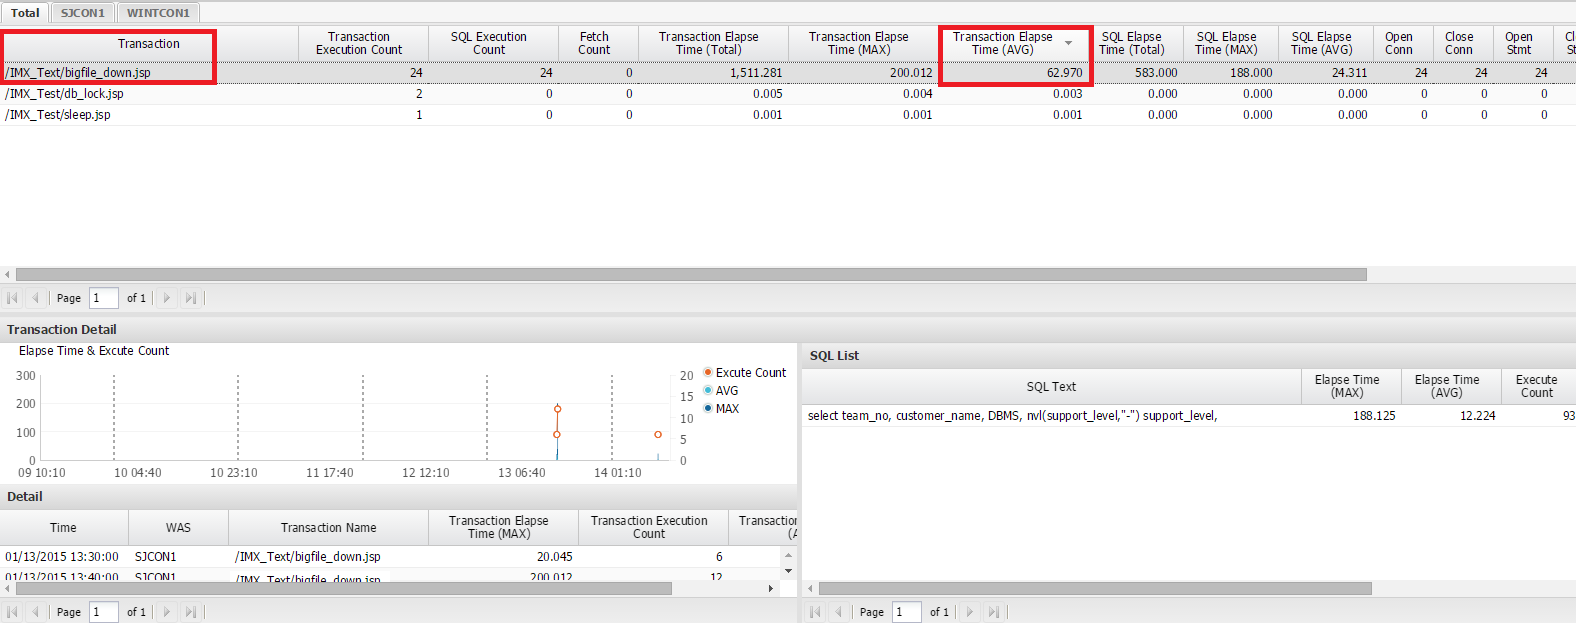
(!) Check Results: You can discover that Bigfile_down.jsp’s average execution time is relatively higher than other transactions within the same time frame.
Among the transactions that occurred during the time of analysis, a list of transactions whose average execution time exceeds 3 seconds were retrieved. As a result, a pattern of transactions such as — I/O related transactions (File Up/Download), transactions whose SQL execution time is long, and transactions affected by the GC pauses — were identified. The increase in GC Time due to the lack of JVM Heap Memory was resolved by increasing the JVM Heap Memory from 1024M to 1280M. And to reduce the GC Time, the CMS (Concurrent Mark and Sweep) option was added on the JVM Options. (CMS option may increase the CPU, therefore, it is necessary to check the CPU Usage Trend after setting.)