After the use of JDBC connection, if the connection is not returned, then the corresponding connection does not get returned to the pool and becomes inaccessible for other service requests. Furthermore, the number of available connections in the pool will gradually decrease and will be exhausted at a particular point which may lead to delays in running the applications.
Check the flow of pool usage at the time of error by looking up the Connection Pool in Application Server Stat. And identify the transactions whose connections have not been returned by using the statistics.
Image1. Analysis of Service Delays Due to Unreturned Connections
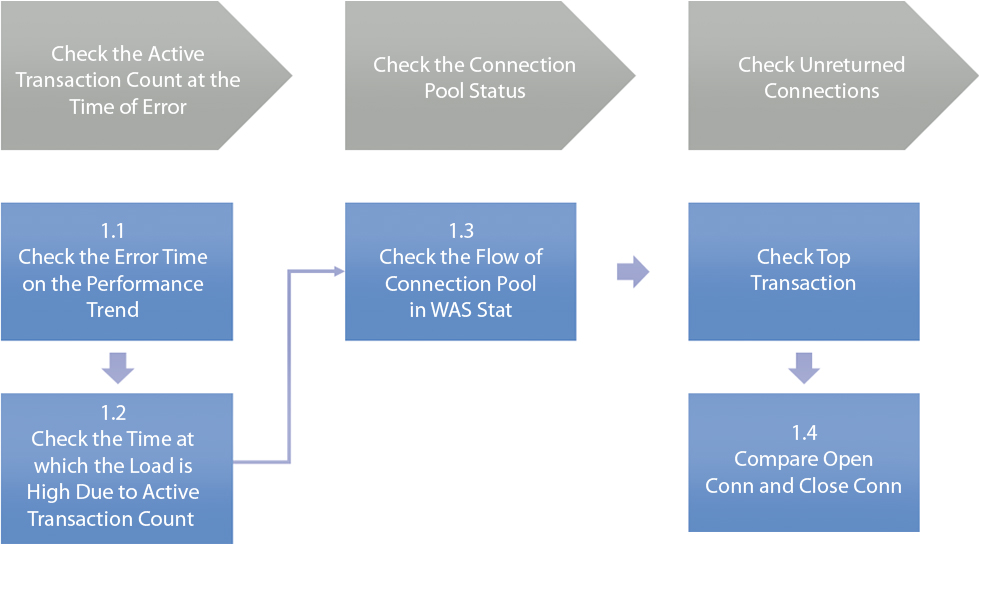
Step1.1 Check the Error Time on the Performance Trend 
Step1.2 Check the Time at which the Load is High Due to Active Transaction Count 
Step1.3 Check the Flow of Connection Pool in Application Server Stat 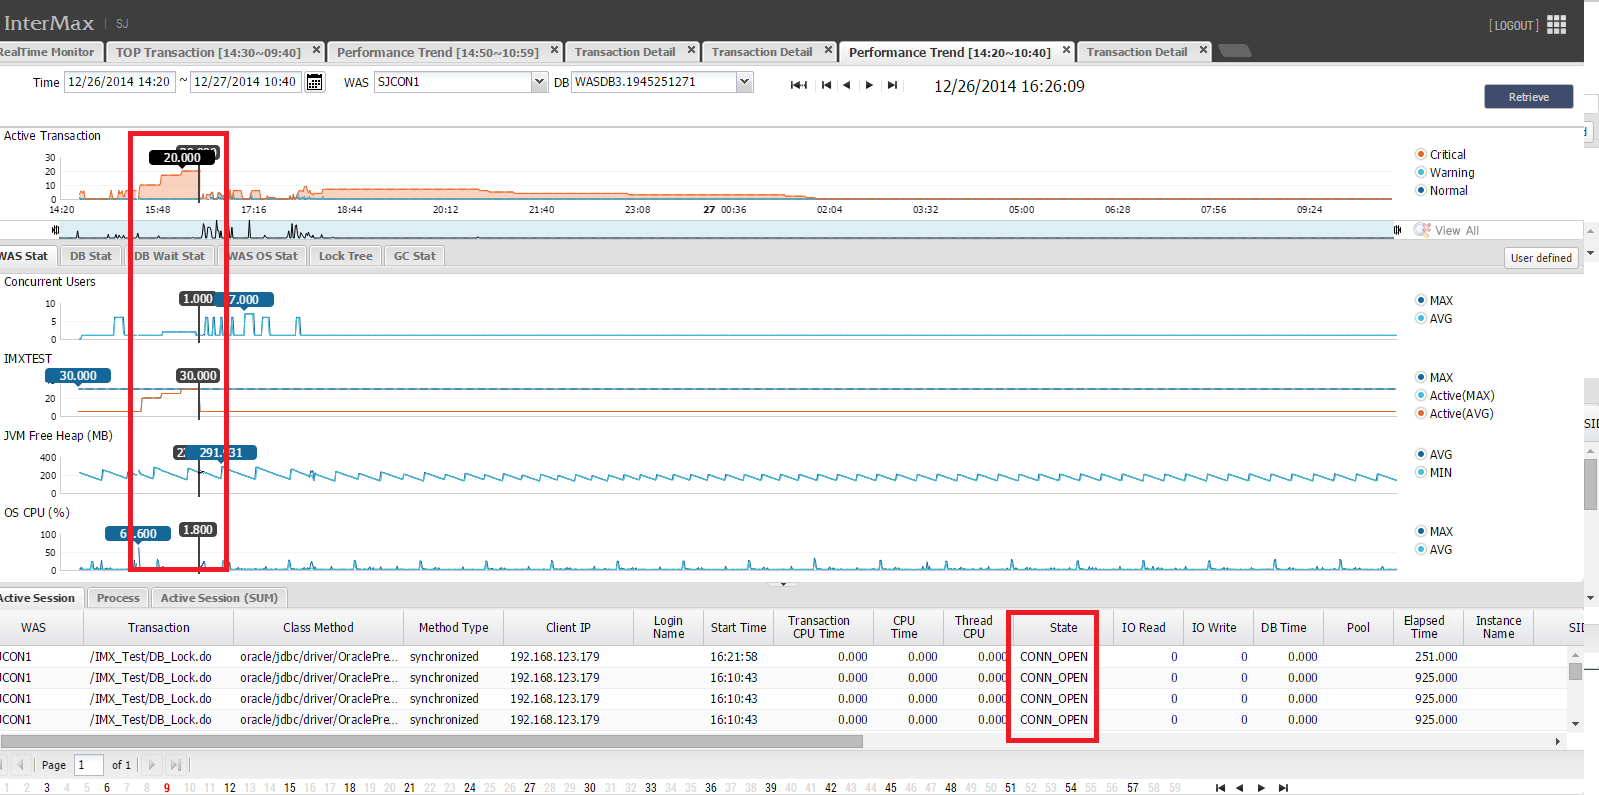
(!) Check Results: After checking the error time on the Performance Trend, you can identify the period in which the active transactions have piled up, and note that all transactions in the problematic time point are in CONN_OPEN(connection open) status.
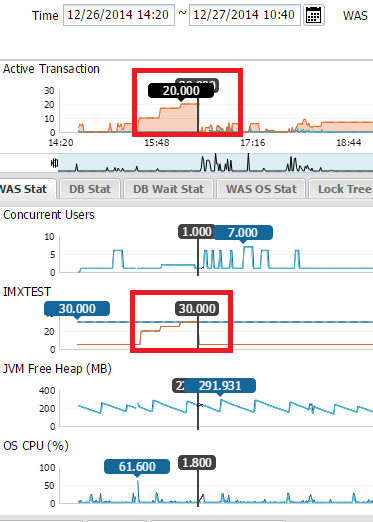
(!) Check Results: When you look at the Connection Pool Stat in Application Server Stat, you will discover that the connection pool usage has been continuously increasing to its maximum from the time at which the error occurred.
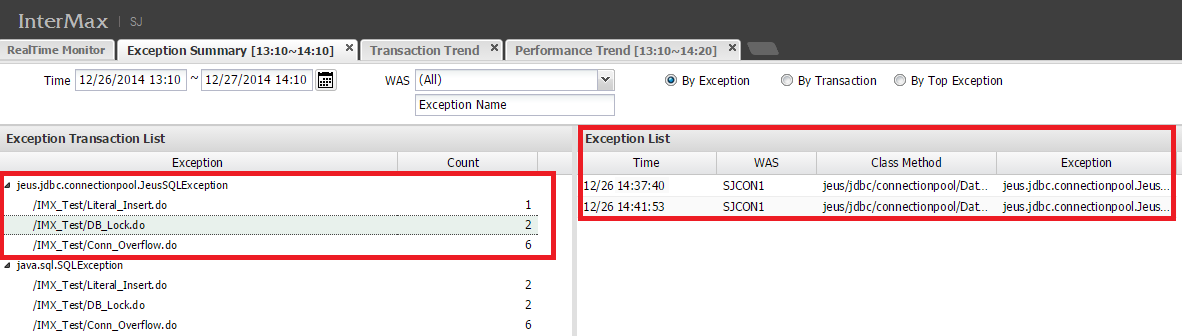
(!) Check Results: In the Exception List generated at the corresponding time, you can see there is a log indicating a shortage of available connection pool for Application Server.
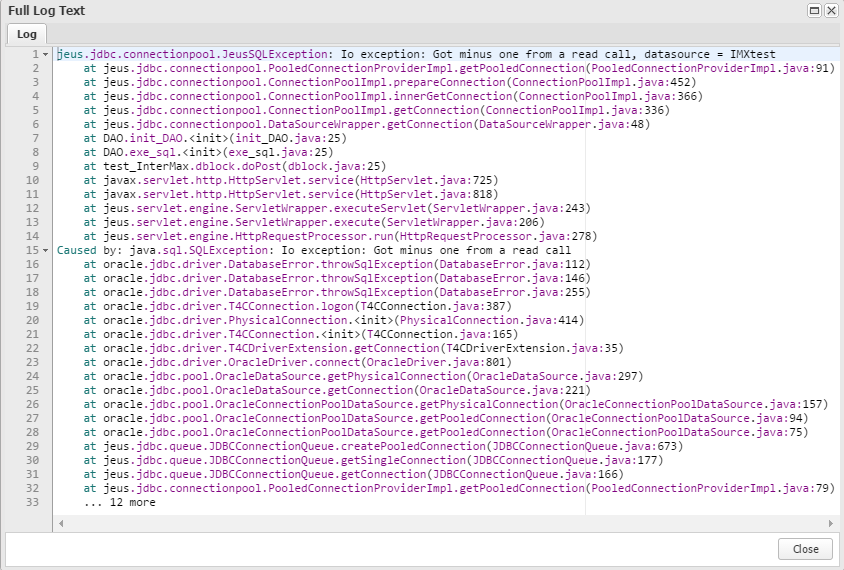
(!) Check Results: You can check the Full Log Text on Application Server regarding the jeus.jdbc.connectionpool.JeusSQLException which is generated when there is a shortage of pool in Application Server.
Step1.4 Comparison of Open Conn and Close Conn 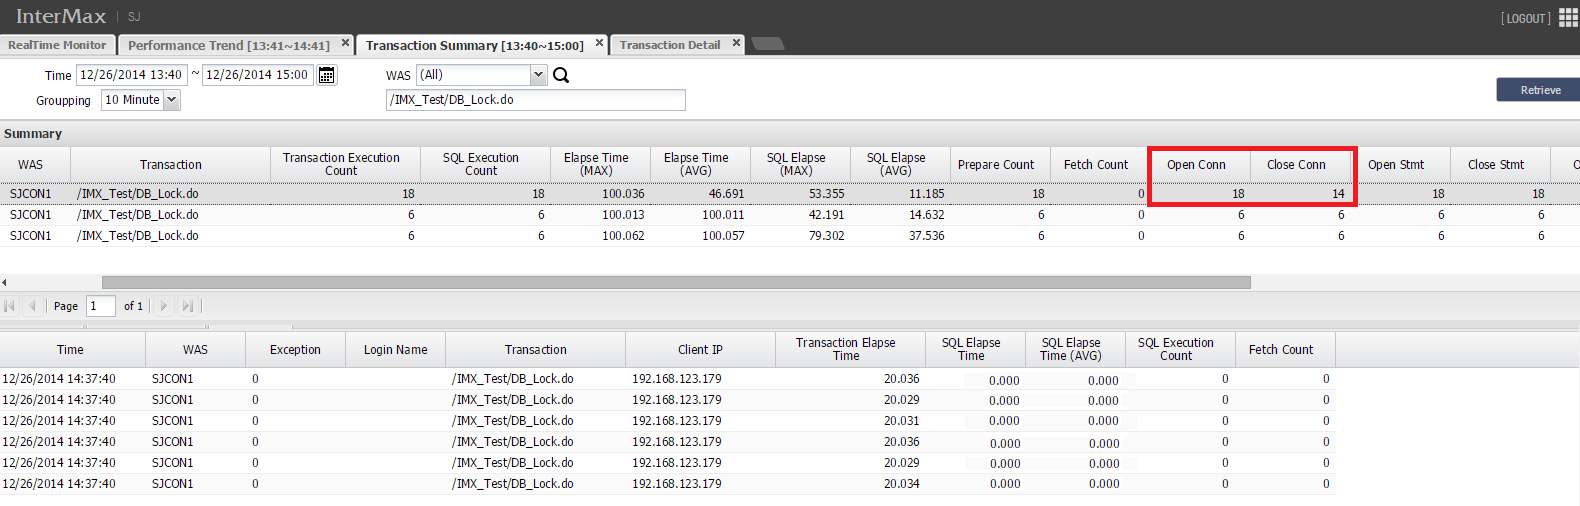
(!) Check Results: To obtain an accurate analysis of the cause of error, a search for connection leaks has been executed on the Transaction Summary screen. You will note that the Connection Object Open Conn Count and the Close Conn Count are not consistent with each other.
It has been discovered that in the event the load is high, after a certain amount of time, it results in a no response or an extended execution time. As it turns out, it had been set to wait 10 seconds in the event it reaches the maximum set in the JDBC Pool due to unreturned connections by a particular application. From the moment all available pool connections were exhausted, all requests were put on hold for 10 seconds which in turn has instantly delayed the response time of numerous applications and also increased the number of active services. To resolve this issue, we have identified the application not returning the connection and modified the logic.