
| Architecture | Provides Web UI |
| Provides observation of Agent which is for data collection | |
| Stores Performance data in DBMS | |
| Provides Mobile UI (Android) | |
| Alarm and SMS Connection | Provides Alarm of MySQL performance indicators |
| Provides Alarm of Main OS Performance indicators | |
| Provides Alarm of File system usage rate | |
| SMS connection of Alarm which is set | |
| Management of SMS Sending Number and Receivers | |
| Provides Alarm occurring records | |
| User Management | Provides permissions for each user to manage different function |
| Enter IP through which access will be allowed by each user | |
| Provides user ID lock function | |
| Admins Menu access rights for each user |
| Convenient Monitoring | Monitoring multiple MySQL database and instance on a single screen |
| Provides instance currently being monitored in different groups | |
| NDB Monitoring Function | |
| Resource Monitoring | Provides CPU, Memory usage rate monitoring |
| Provides real-time Performance Indicators Trend of MySQL | |
| Thread and Process Monitoring | Provides Threads that are currently active which you can search in different conditions |
| Provides detail monitoring of Active Thread | |
| Provides SQL Elapsed Time of each active thread and Threads within the group | |
| Provides Lock holder, Threads, waiter relationship in a tree structure | |
| Provides query kill in Thread Detail | |
| SQL Monitoring | Provides Threads Details Menu including SQL Texts |
| Provides Slow Queries based on the end elapsed time in a Scatter Chart | |
| Provides performance information and SQL plan |

| Daily Performance Analyzer | Provides daily Performance indicators trend |
| Provides Dead lock information | |
| Provides InnoDB status information | |
| Provides Replication delay information | |
| Provides Slow query information | |
| Provides usage rate of different Database and File system | |
| Performance degradation Analyzer | Provides Active Thread information every 5 seconds |
| Provides O/S Top Process information | |
| Provides Lock holder, Threads, waiter relationship in a tree structure | |
| Provides SQL text and Plans which executed in active Thread | |
| Parameter | Provides daily variables information |
| Alert | Provides several MySQL logs and Alarm records |
| Backup | Provides daily backup record information |
| Report | Provides daily and weekly report of main indicators |
| Performance Data Type | Monitoring Cycle Time | Logging Cycle Time | Description |
| MySQL Performance information | Every 1 min | Every 1 min | Cycle time is changeable Maximum 1 second ( Monitoring, logging ) |
| Thread | Every 1 min | Every 1 min | |
| SQL | Every 1 min | Every 1 min | |
| Alert | When Alert occurs | When Alert occurs | Follow Alert rules |
| Performance Data Type | Monitoring Cycle Time | Logging Cycle Time | Description |
| System Resource | Every 1 min | Every 1 min | – |
| O/S Process | Not for real-time Process list | Every 1 min | Not for O/S Process through CloudWatch |
| EC2 indicators | RDS indicators |
| CPUUtilization | CPUUtilization |
| DiskReadBytes | WriteLatency |
| DiskReadOps | WriteIOPS |
| NetworkIn | ReadLatency |
| NetworkOut | ReadIOPS |
| NetworkPacketsIn | NetworkTransmitThroughput |
| NetworkPacketsOut | NetworkReceiveThroughput |
| StatusCheckFailed | FreeableMemory |
| StatusCheckFailed_Instace | FreeStorageSpace |
| StatusCheckFailed_System | DiskQueueDepth |
| DatabaseConnections | |
| BinLogDiskUsage |
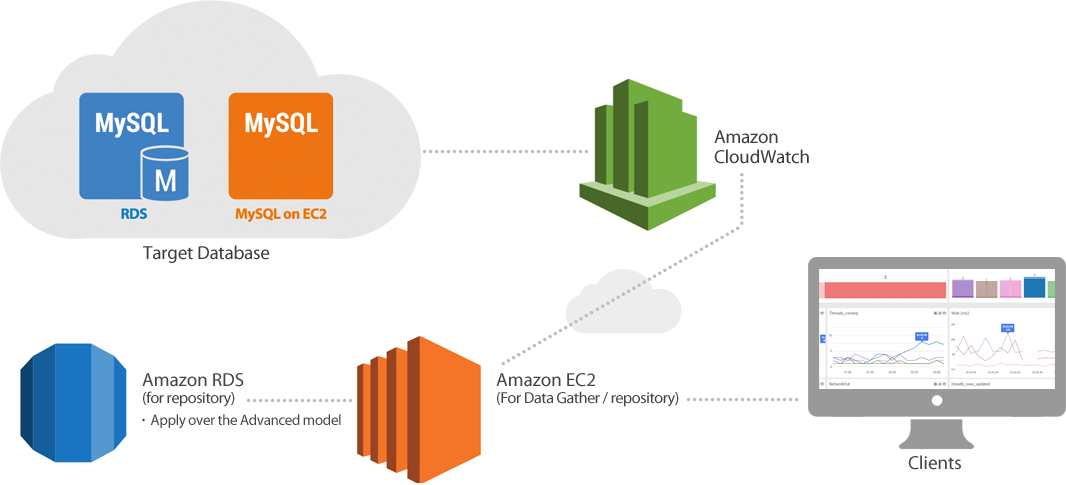
MaxGauge for MySQL(MariaDB) supports both MySQL as a RDS running on AWS
as well as the MySQL installed on EC2.