MAIN) 1. Product Overview
MaxGauge is a performance management tool designed to support an effective performance management and fault management of each component which make up the computer system including the database, system, applications, and etc. In respect of a system administrator who oversees the system operation, the three tasks shown in the diagram below are essential to performance management, and each task must be carried out on the basis of a mutual interworking relationship.
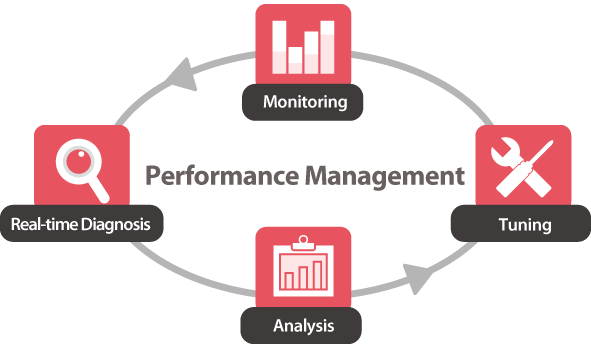
MaxGauge supports system administrators or database and application administrators who oversee the performance management and fault management, to be effective in real-time monitoring, diagnosis, and analysis. And through the real-time monitoring feature, it allows the administrator to easily and quickly identify in which database or server the error occurred or the performance degradation occurred, among the many servers and databases. In the event of an error or performance degradation, it easily identifies exactly in which part by what factors the problem occurred through a diagnosis process, ensuring a real-time resolution as much as possible, and it further investigates the root cause of the error or performance degradation through a post-analysis so that appropriate troubleshooting actions may be taken.
Back To Top
Main Functions
Let us explain about the functions which MaxGague provides for the performance management of MySQL database. The functions can be largely divided into real-time monitoring and diagnosis section and the post-anlysis section. We will briefly explain the functions provided by each section. MaxGauge provides functions which checks the current performance status of MySQL database, monitors if any indicator has exceeded the predefined threshold values, and tracks down the root cause of the problem in the event of performance issues. These functions allow the MySQL DBA or performance administrators to recognize potential performance issues and make corrections to prevent problems before they occur. And the activities which occur during the database operation are logged in detail and made available by date and time as a resource for identifying the problems.
Integrated Monitoring Function
By monitoring multiple MySQL databases on a single screen, you can easily identify and resolve the MySQL performance issues scattered across the system network. You can also monitor by comparing the data of several databases in respect of one particular indicator.
Session Monitoring Function
By monitoring the current wait information and SQL information of a particular session from a single screen organically, you can identify the current performance status of a session in real-time.
REPLICATION Environment Monitoring Function
You can monitor replication delays and replication fails of a database configured with replication in real-time.
Session Query Function
You can search for several sessions connected to a single database by conditions and simultaneously monitor the aggregates of sessions which meet the conditions. You can query a session’s ID, Thread ID, User Name, Host Name, and the SQL Text currently executing.
LOCK Tracing Function
You can trace the wait relationships of locks generated in MySQL database in real-time. You can analyze the the session holding the lock and the waiting sessions organically through a tree format, and monitor dead locks in real-time.
Cloudwatch metrics monitoring feature
By providing information provided in Cloudwatch such as the server’s CPU Utilization, Freeable Memory, etc., it allows the user to effectively monitor even more performance metrics.
Wait Indicator Logging Function
Provides logging data of all the wait indicators generated in MySQL for the user’s convenience in analysis.
Active Thread Logging Function
According to the logging cycle defined by the user, it provides the details of all the active threads executed during the period and the currently executing SQL Text.
Lock Logging Function
According to the logging cycle defined by the user, it provides the logging data through which you can analyzethe lock and the lock holders generated during the period in a tree structure.
Parameter Logging Function
Logs parameters once a day and is provided to the user.
Deadlock Logging Function
Logs InnoDB’s deadlock information taken every minute.
Innodb Status Logging Function
Logs InnoDB’s status information taken every 5 minutes.
Threshold Values Alarm Function
Besides the collected indicators, it also provides alarms for the monitoring server’s Disk Free Size and the Replication information.
Back To Top
MAIN) 2. Maxgauge Daemon & Client
Back To Top
MaxGauge Startup and Shutdown
MaxGauge For MySQL is by default driven by the Real-time Client.
Back To Top
SUB) MaxGauge Real-time Client Startup
Back To Top
SUB) MaxGauge Real-time Client Shutdown
Back To Top
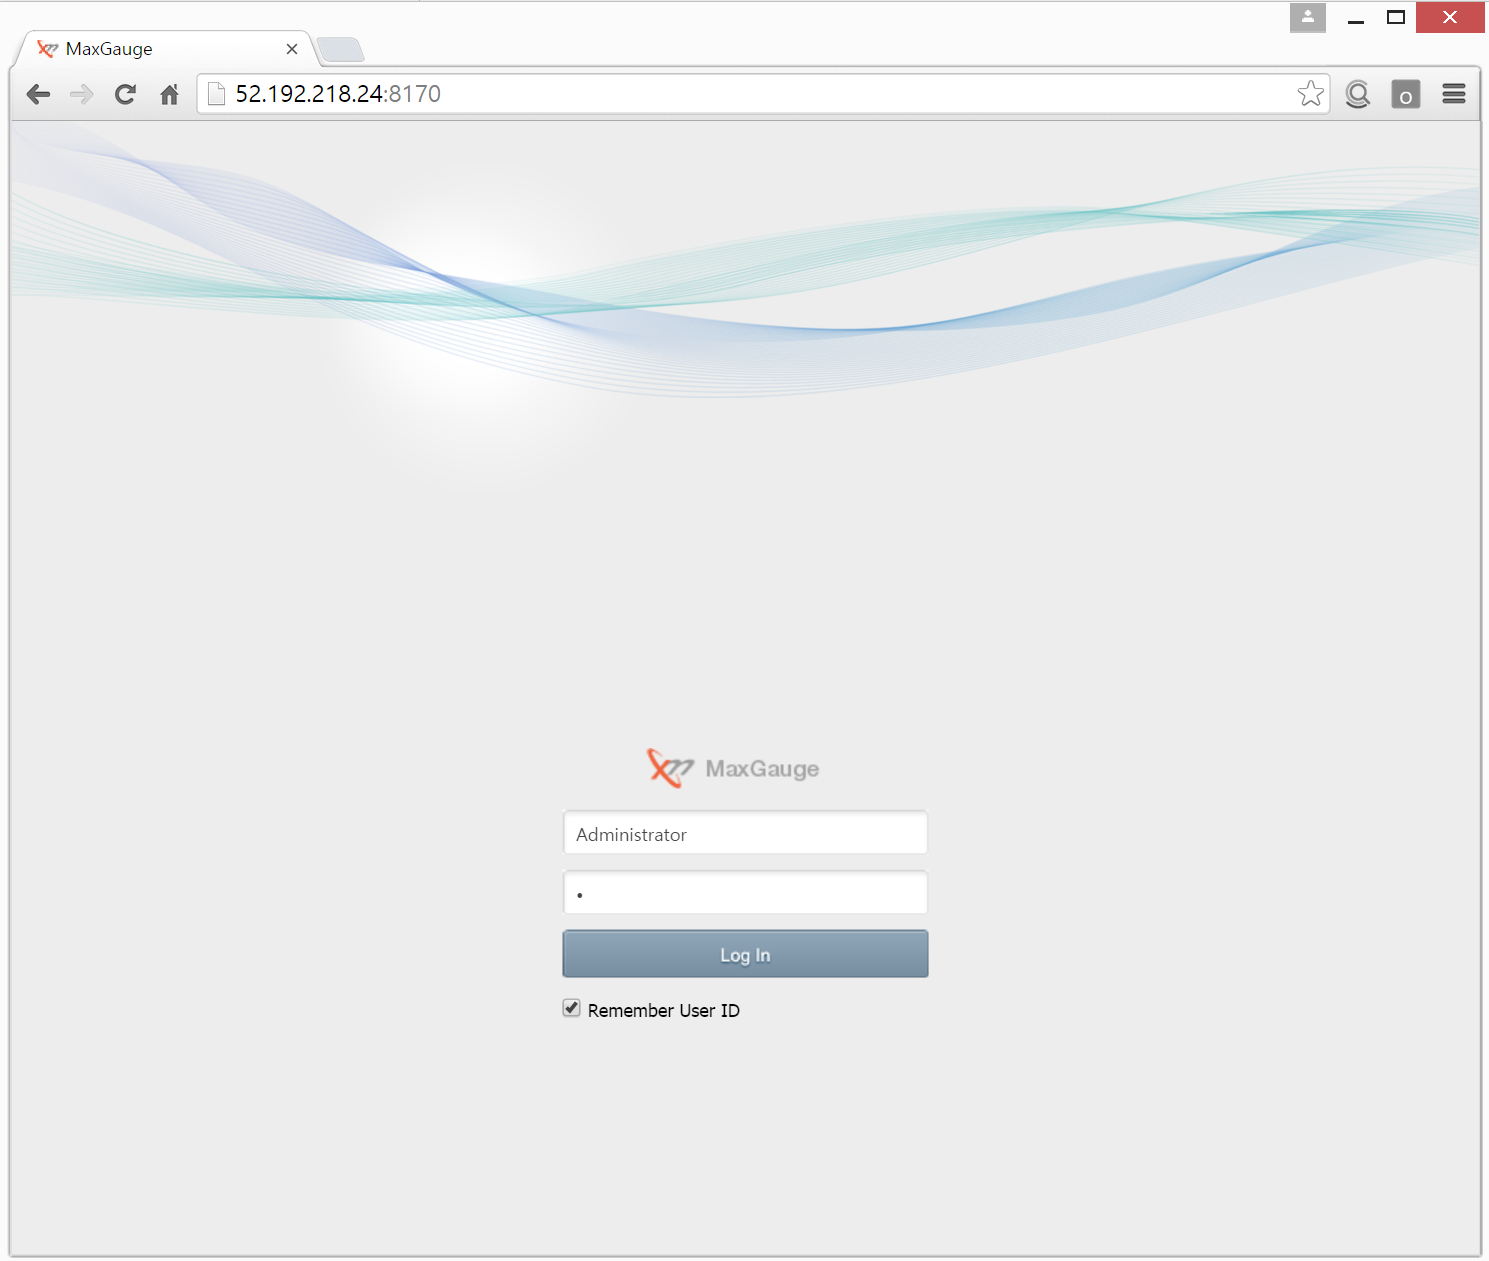
SUB) Login
Open the Chrome browser and enter the IP’s WAS Port (ex. 52.192.218.24:8170) which is currently in service.

( Default Account : Administrator / Password : 1 )
Back To Top
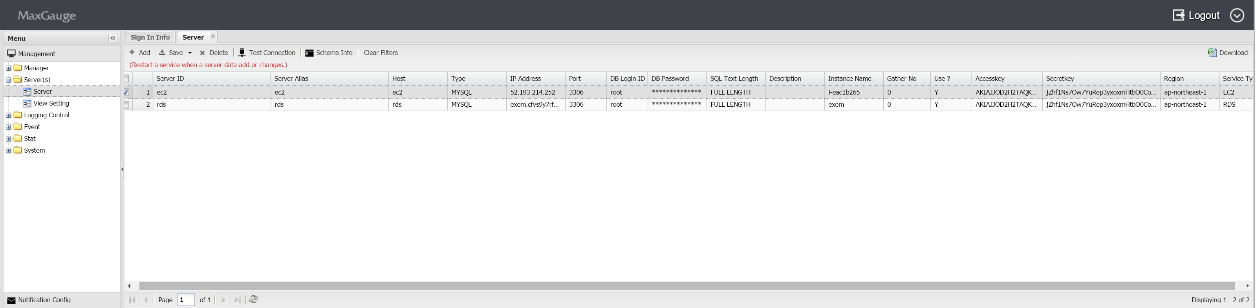
SUB) Monitoring Server Registration ( Admin > Server(s) > Server )
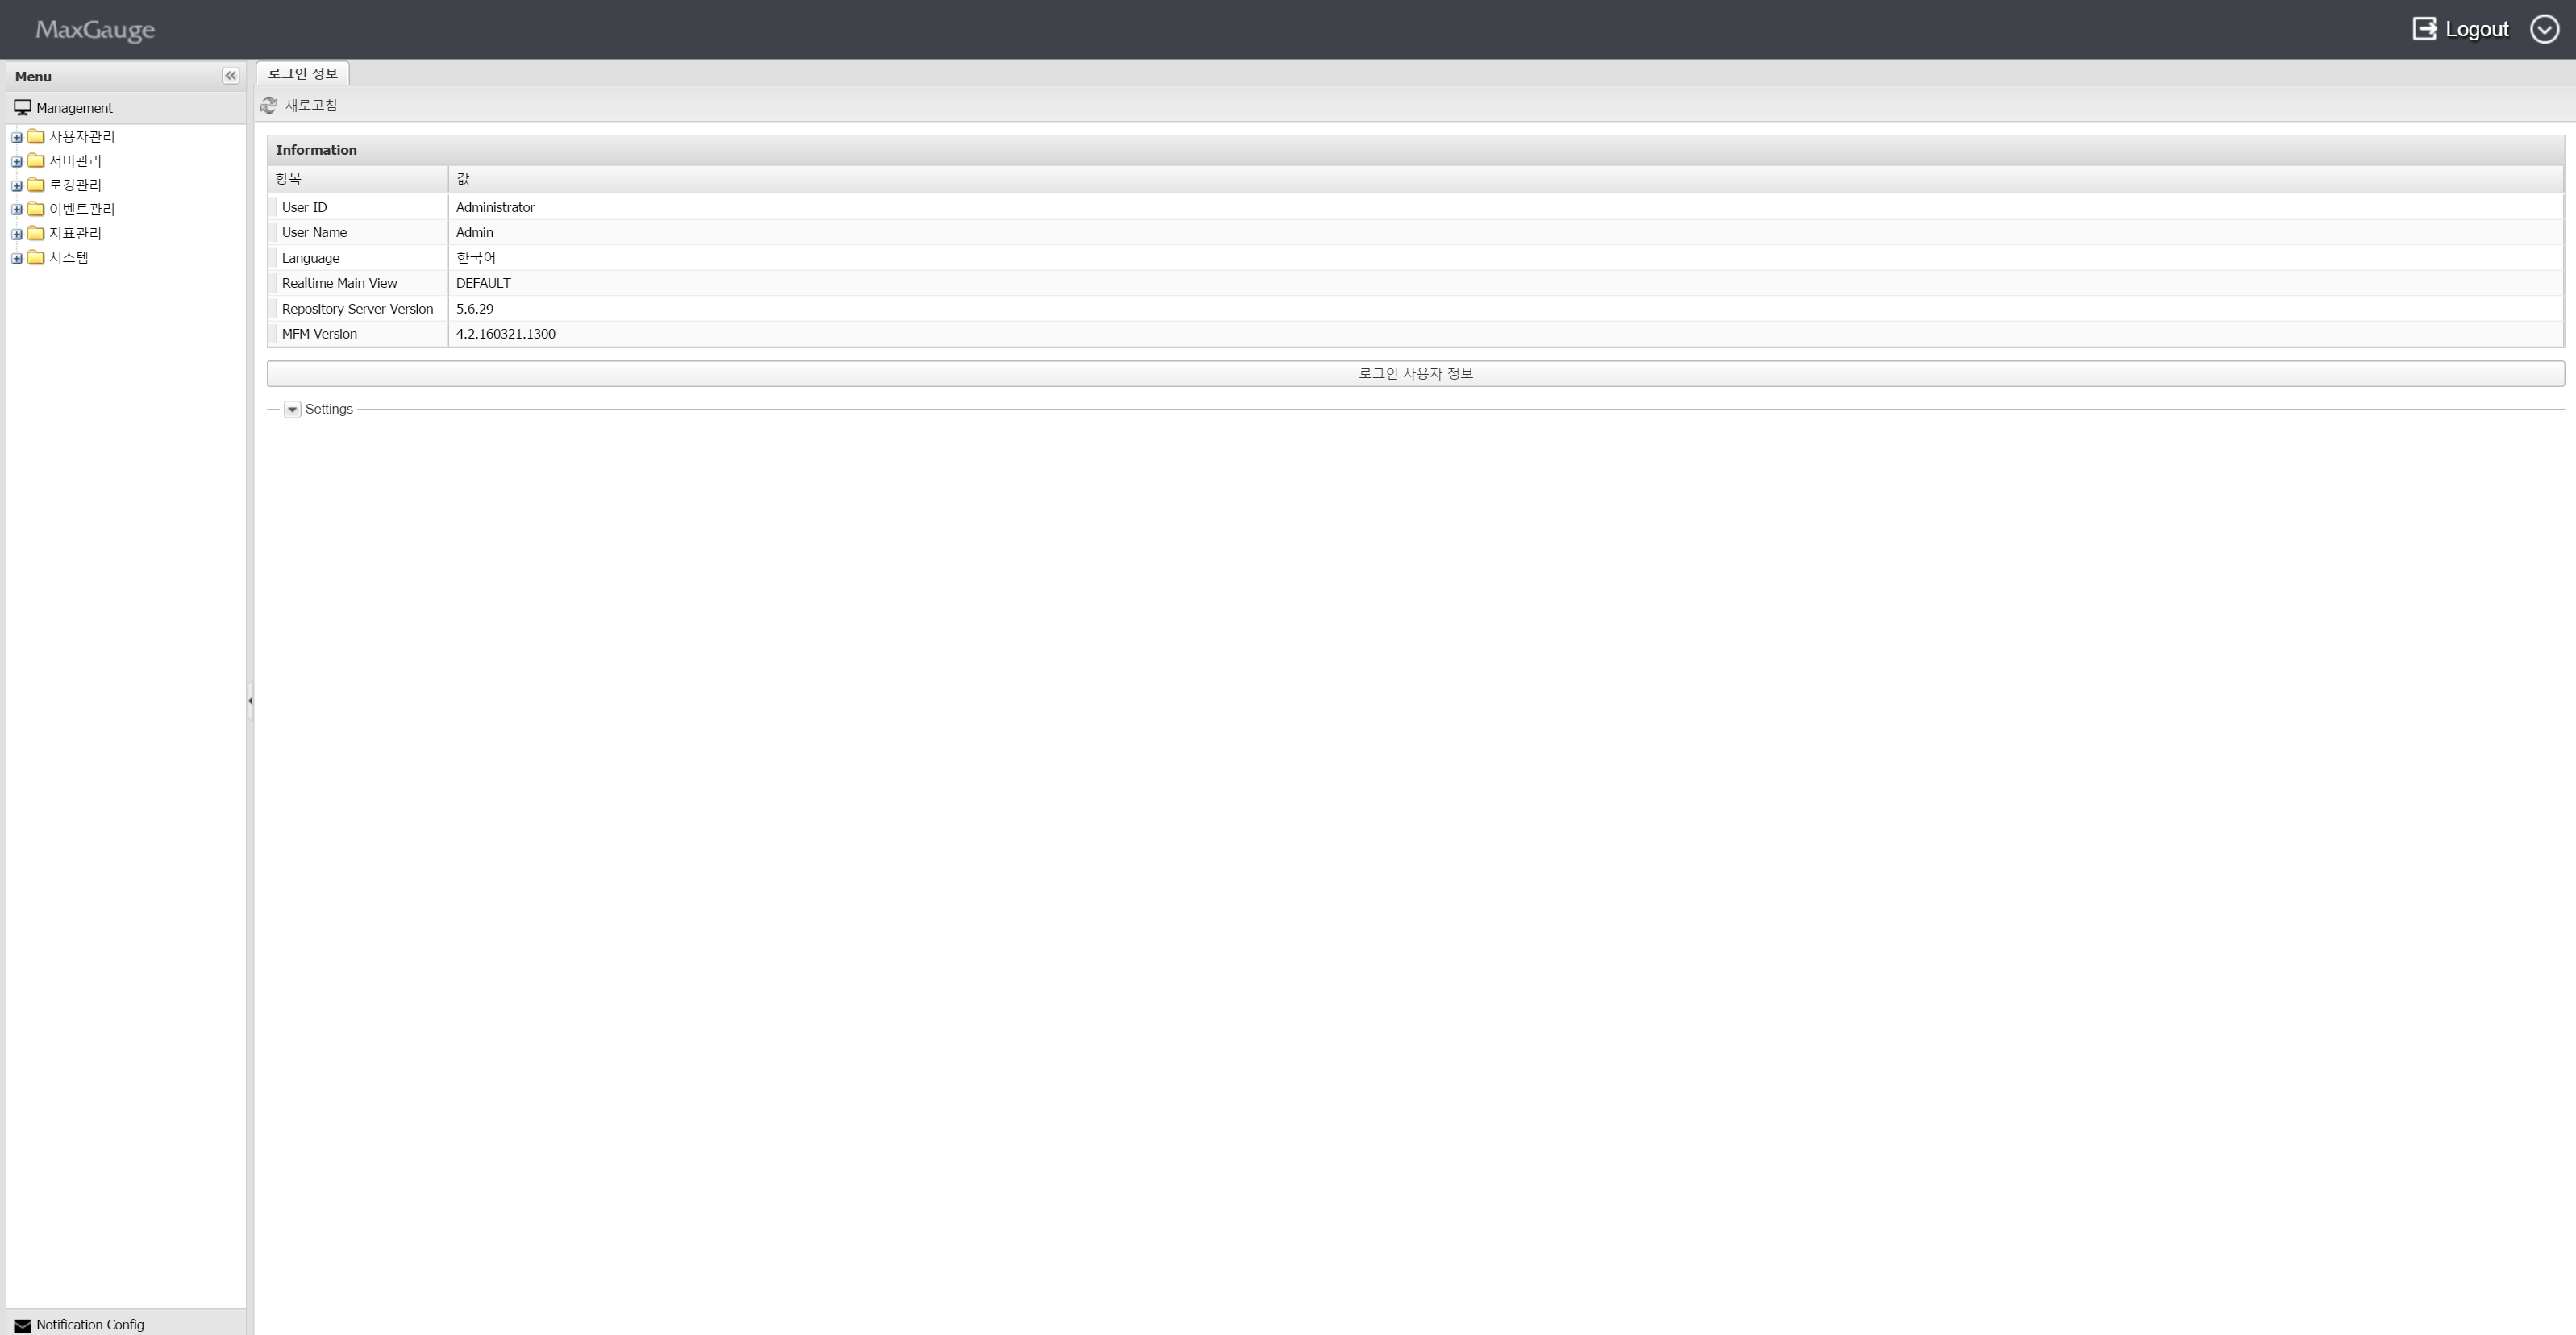
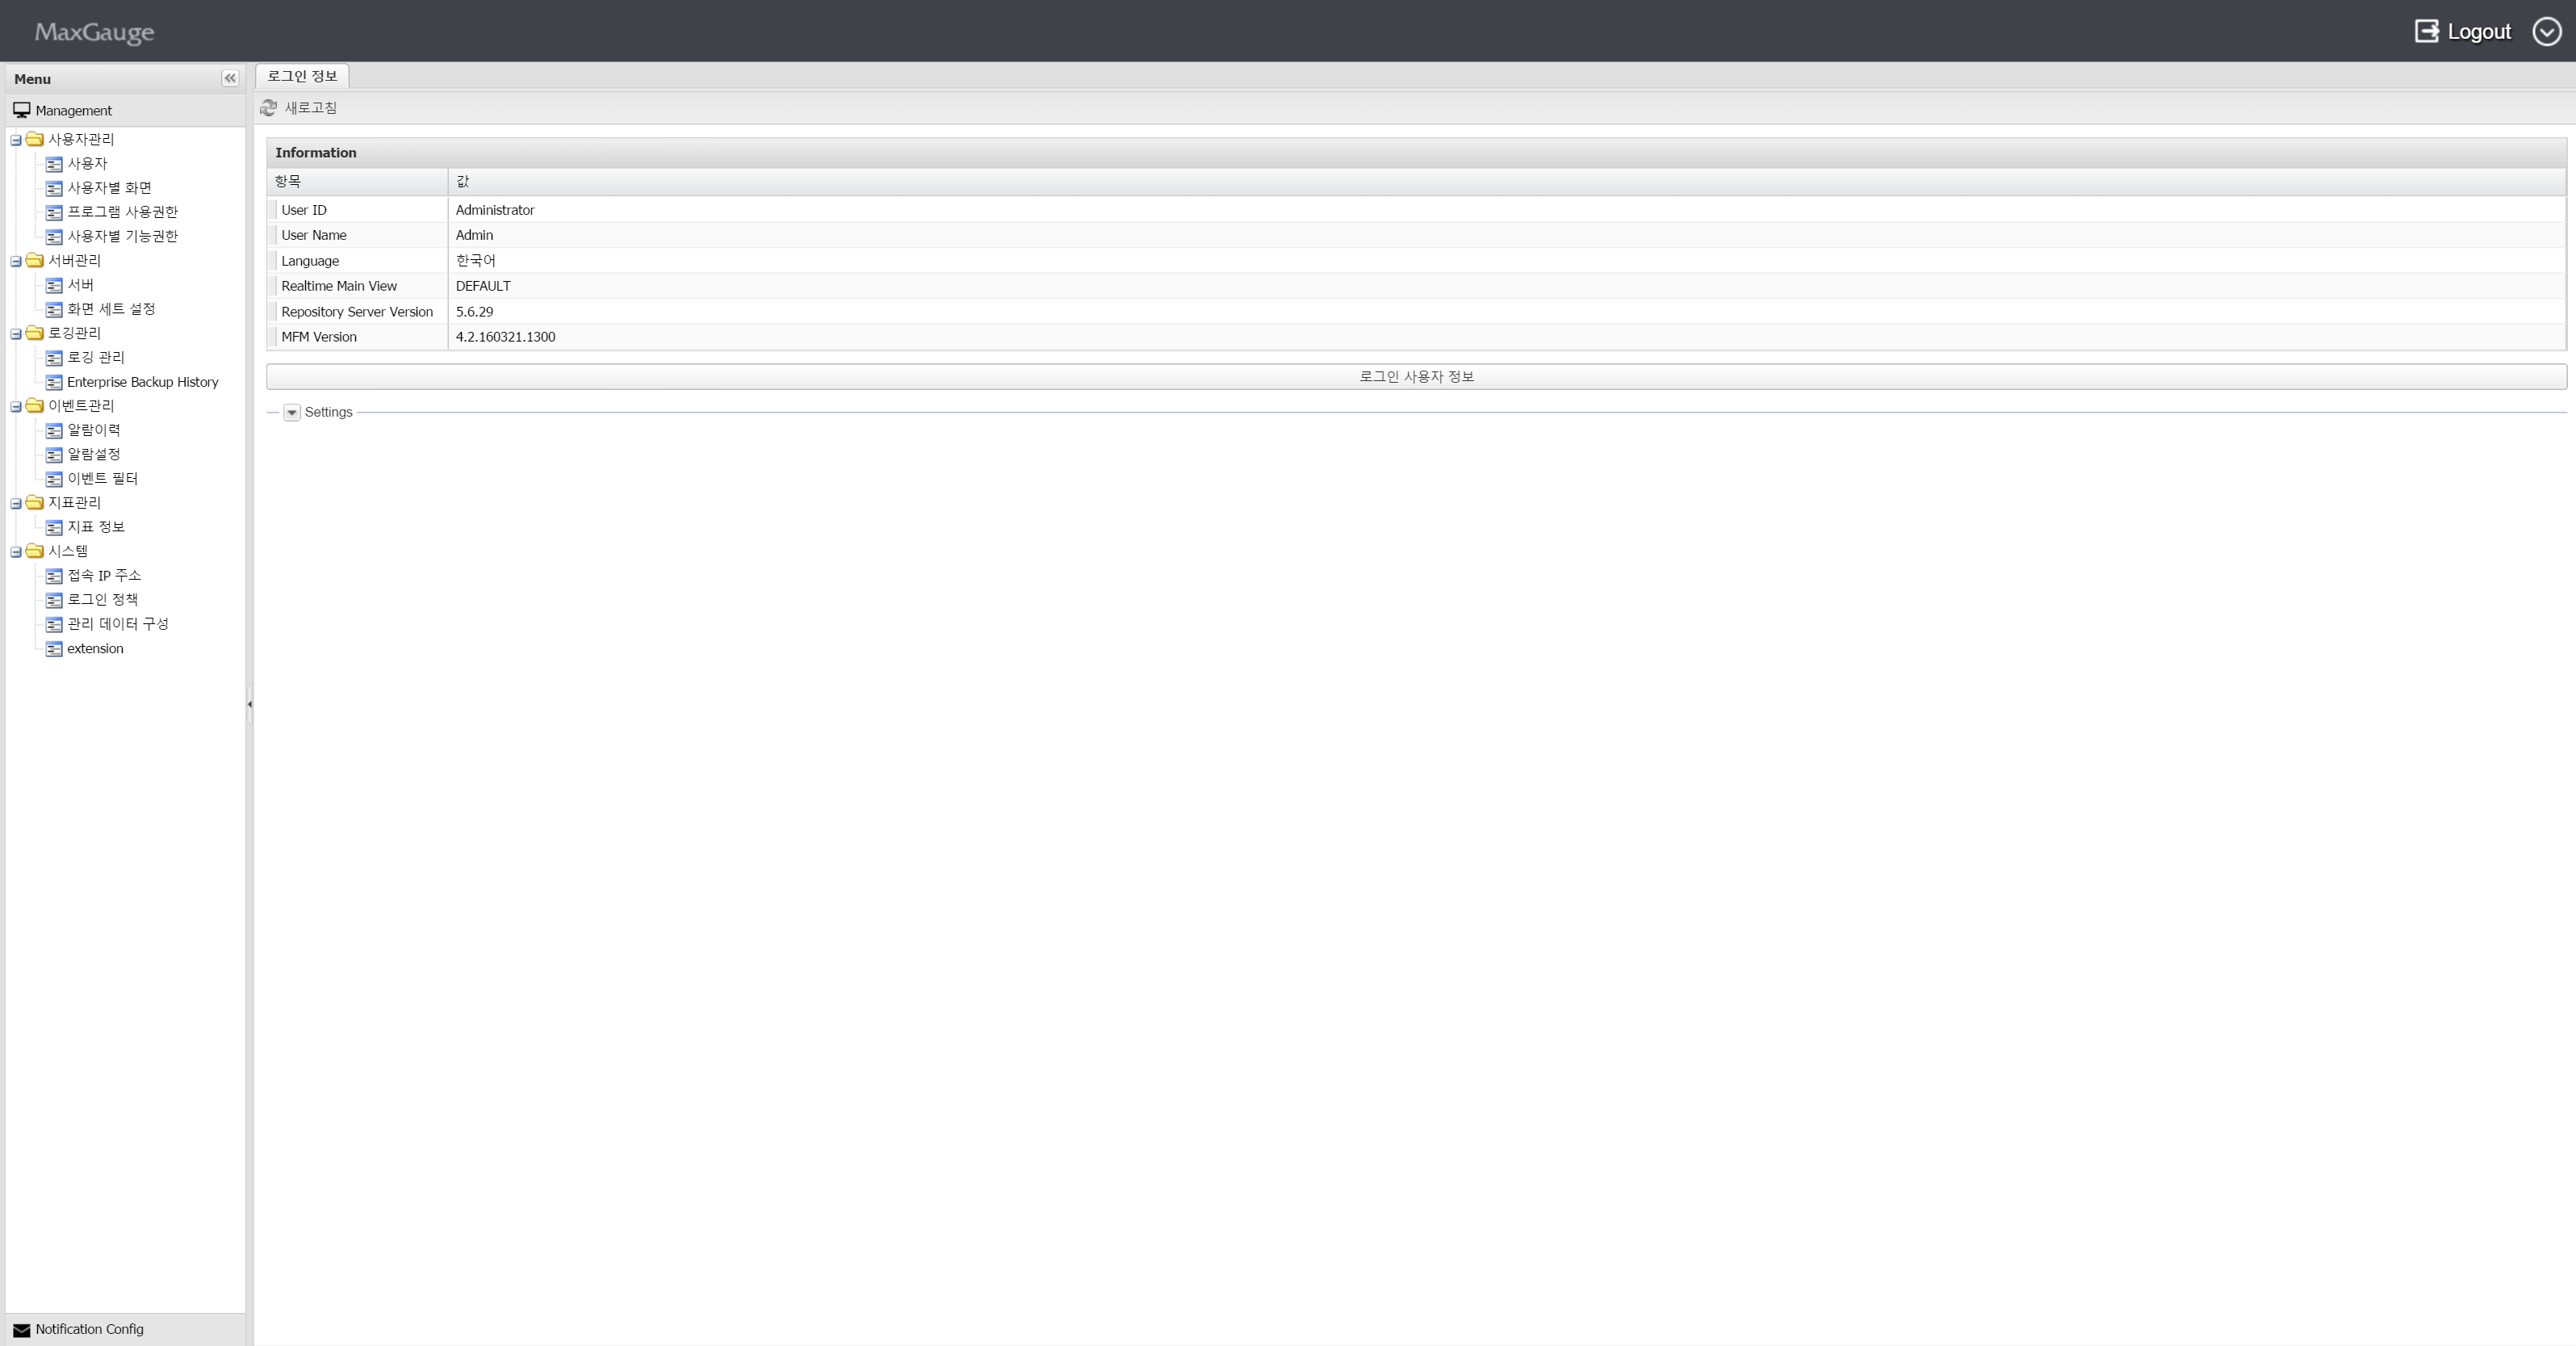
‘Server’ is a screen for registering and managing the connection information of the monitoring target database.
Administrator Menu Location
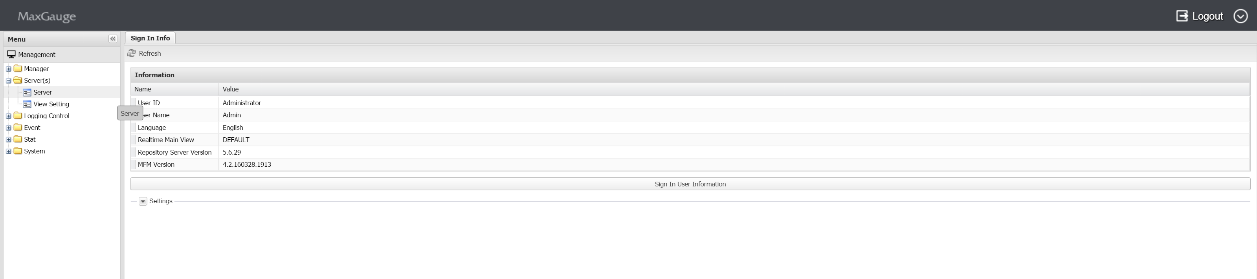
After login, reference the image below to go to the administrator screen.
Connection Information Registration
To register the connection information, click the ‘Add’ button on the ‘server’ screen.
1. Click  button on the server window. button on the server window.
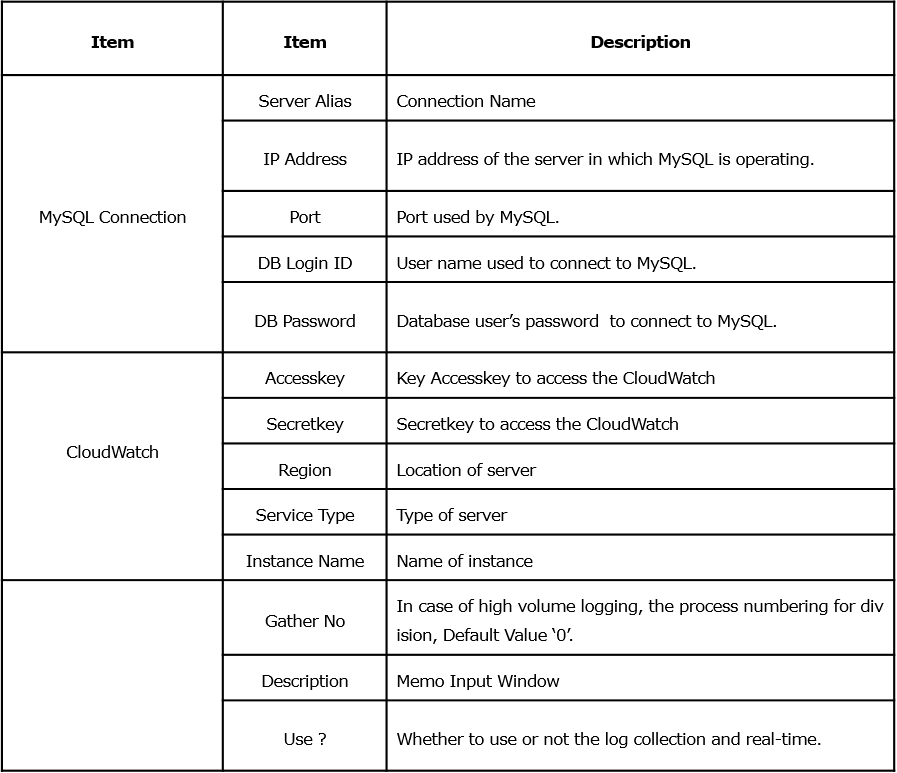
2. Input Connection information
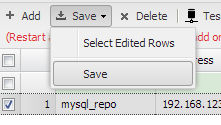
3. After checking the items entered, click the Save button to save information.

Edit Connection Information
To edit the connection information, click on the server you wish to edit on the ‘Server’ screen.
- Select the connection information you wish to edit and edit the information.
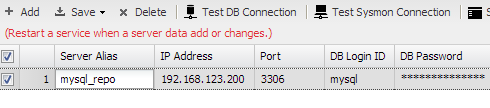
2. When finished, click Save.
Delete Connection Information
To delete connection information, click the ‘Delete’ button on the ‘Server’ screen.
1. After checking the connection information you wish to delete, click the  button on the Instance Manager screen. button on the Instance Manager screen.
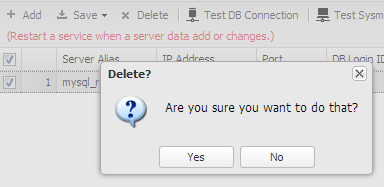
2.Click ‘Yes’ button on the confirmation window.
Start Log Collection and Monitoring
Only ‘Y’ from the following items will become active for log collection and monitoring. will become active for log collection and monitoring.
From the EXEM Maxgauge for MySQL screen, when you click Process > All STOP , START to reflect the changed server information, you can check the collected data in Real-time and Performance Analyzer.

Open Chrome browser and enter “52.192.218.24 “.
( Default Account : Administrator / Password : 1 )
( Integrated Real-time )
Back To Top
Types of Real-time Views
MaxGauge For Mysql products can be categorized into two types – Real-time and Threads.

(Integrated Real-time )
(Thred)
Back To Top
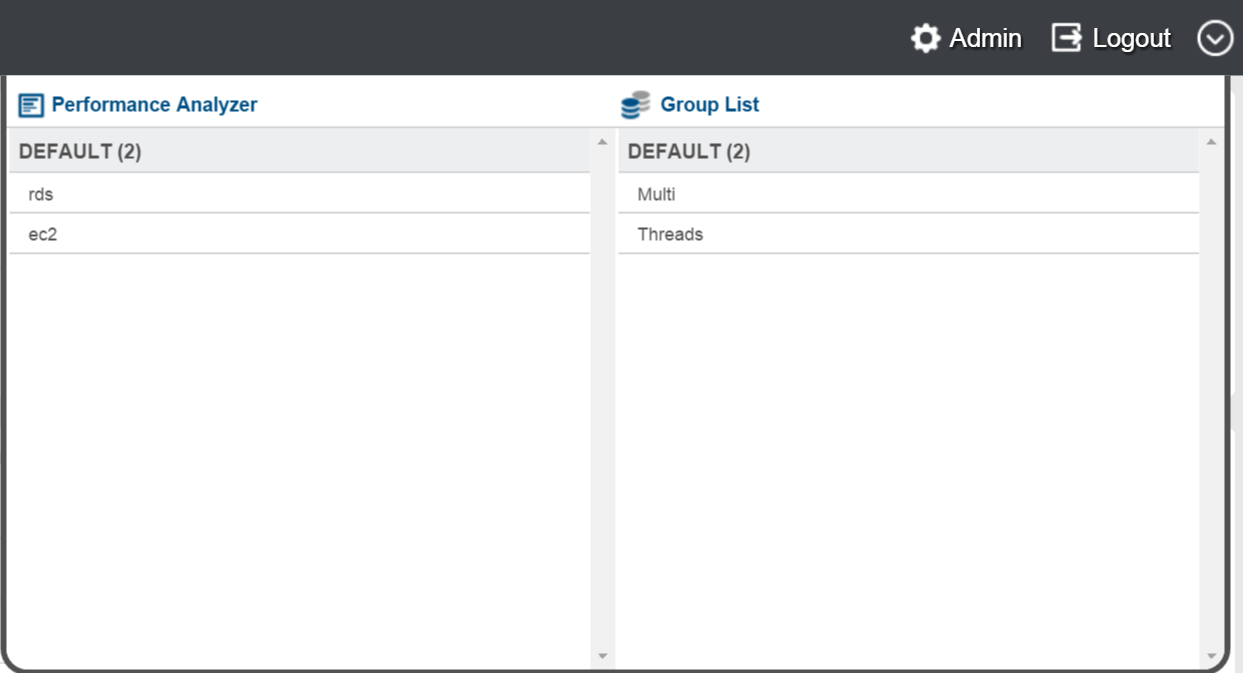
SUB) Product’s View Shift
You can shift between products using the configuration at the top of the product as shown below.

( Integrated Real-Time ) ( Shift Menu )
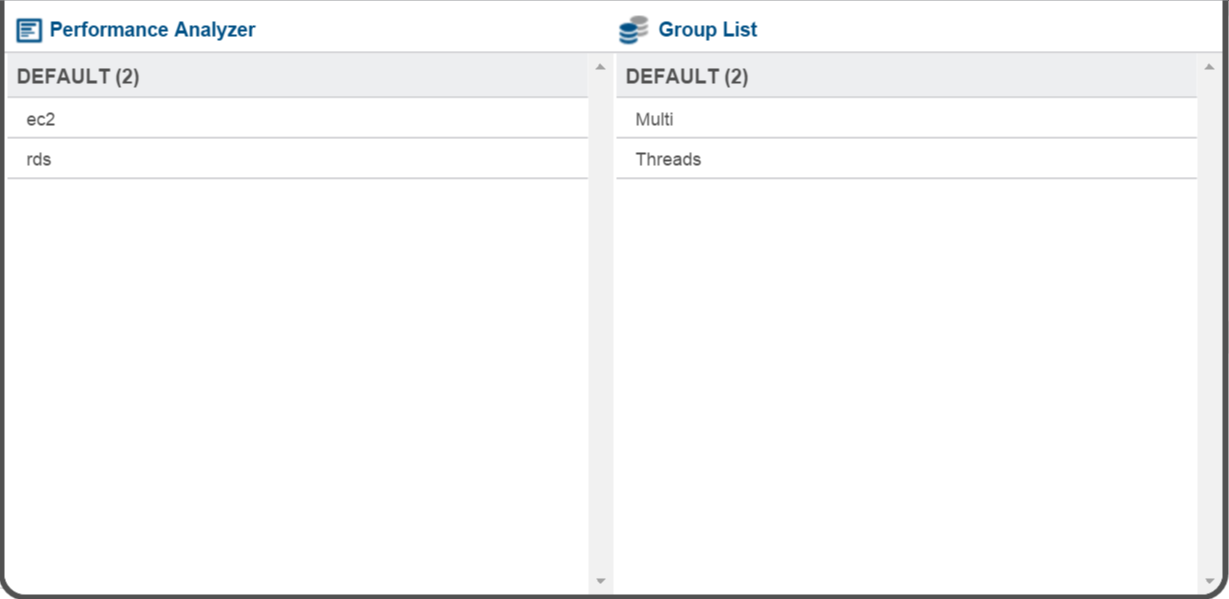
Performance Analyzer
You can easily move to the Performance Analyzer which is Maxgauge for mysql’s post-analysis tool.
View Change
Changes the current group’s view. It shifts to Threads.
Admin
Shifts to the ADMIN page on which you can manage users and monitoring servers.
Log Out
Ends the session to which you were logged and shifts to the login page.
Back To Top
MAIN) 3. MaxGauge Main Features
Back To Top
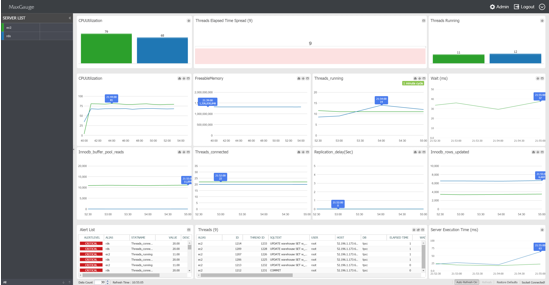
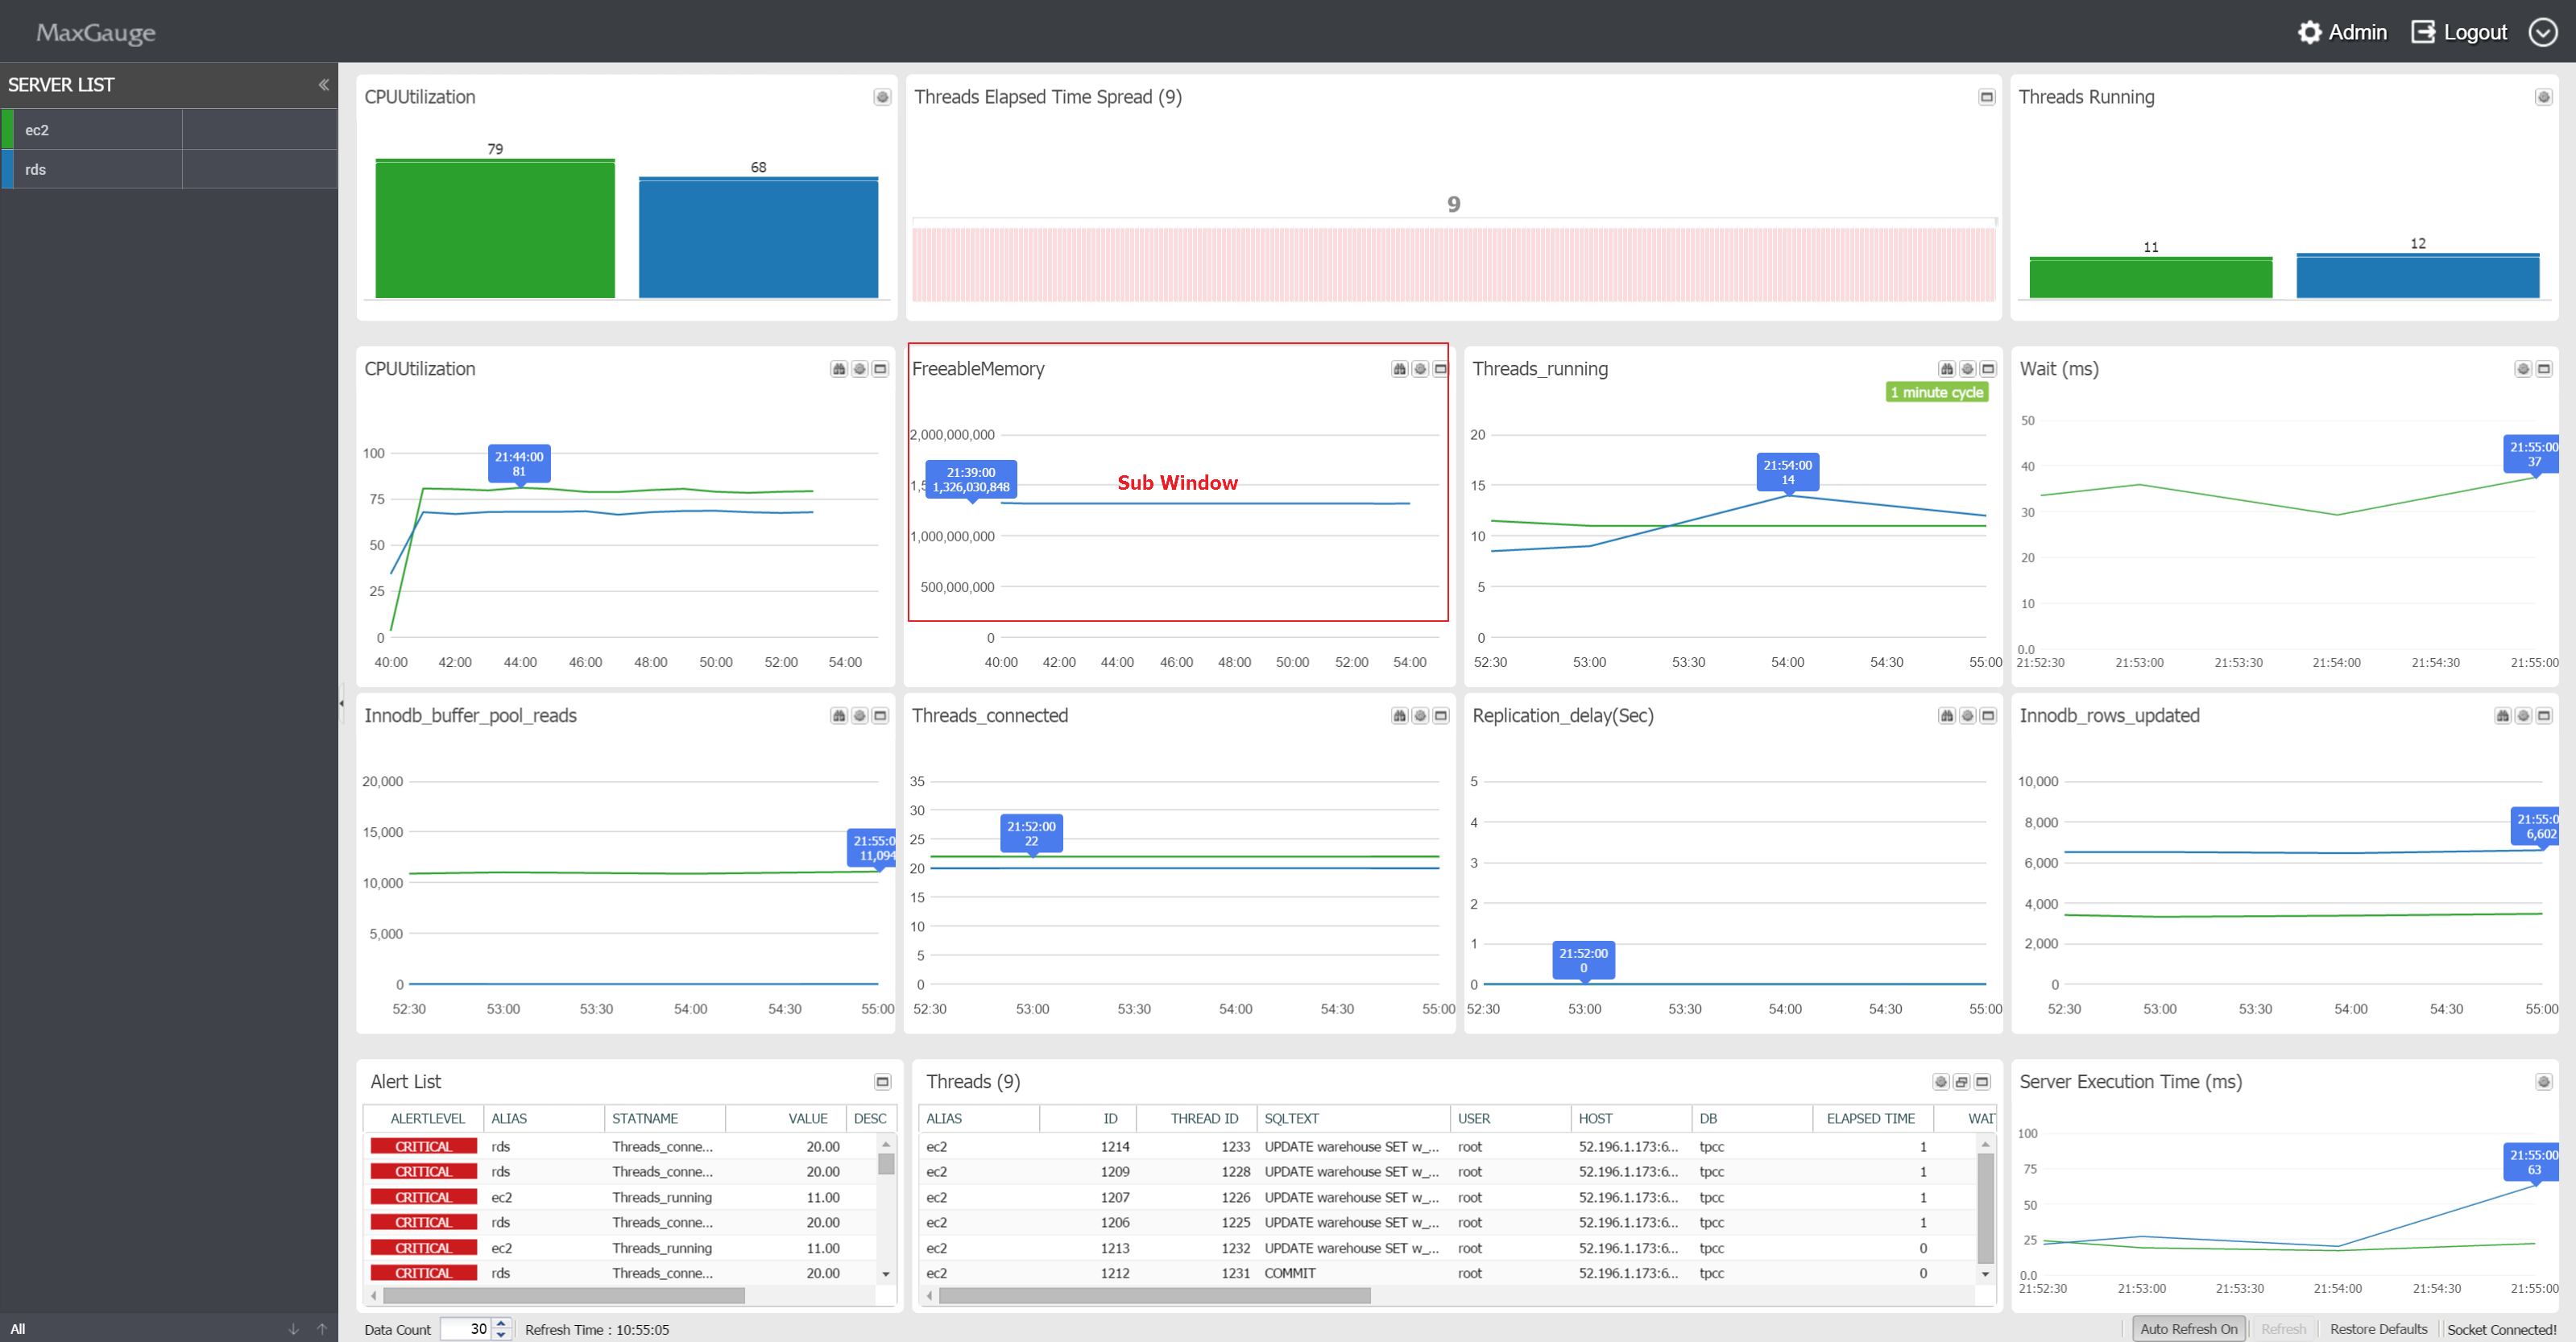
MaxGauge Main Screen Configuration (Multi Real-time View)
MaxGauge’s main screen monitors the performance issues of multiple MySQL database simultaneously, from the system’s overall perspective on a single screen, to ensure quick and effective real-time performance management of MySQL database.

MaxGauge For MySQL’s DBMS performance information collects data using the query method, and you can immediately start monitoring after installation without the database’ downtime. Also, through the integrated monitoring of multiple databases on a single screen, in the case of performance degradation and faillures in the database, you can quicklly and effectively trace the the session and the SQL identified as the root cause of the problem.
Back To Top
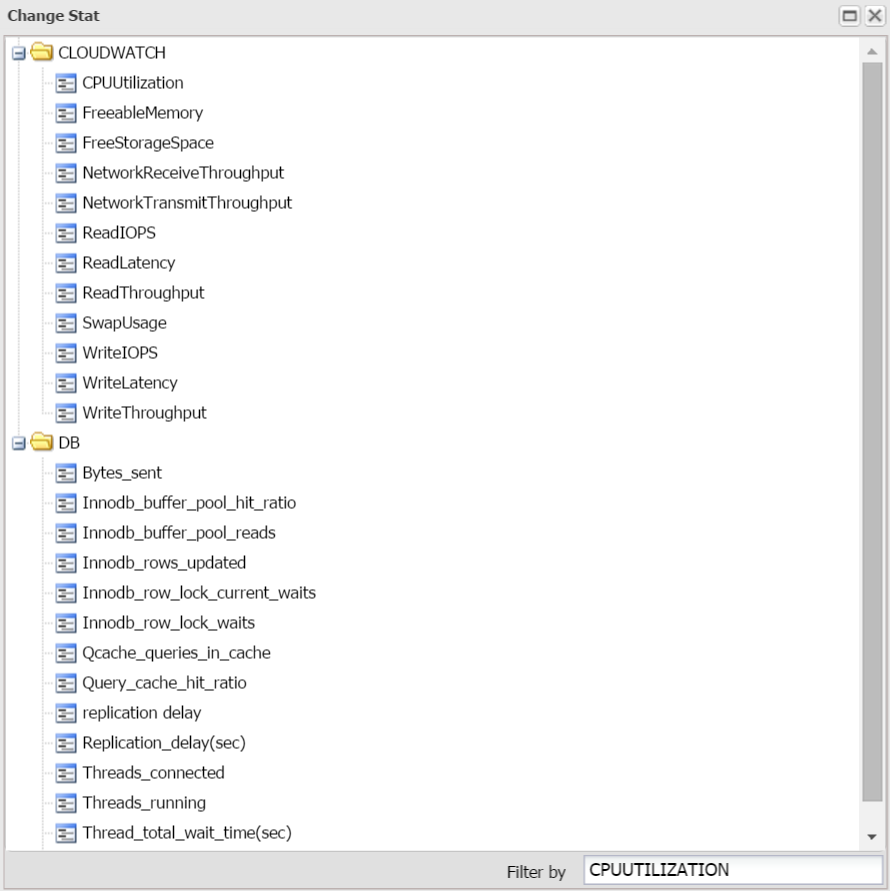
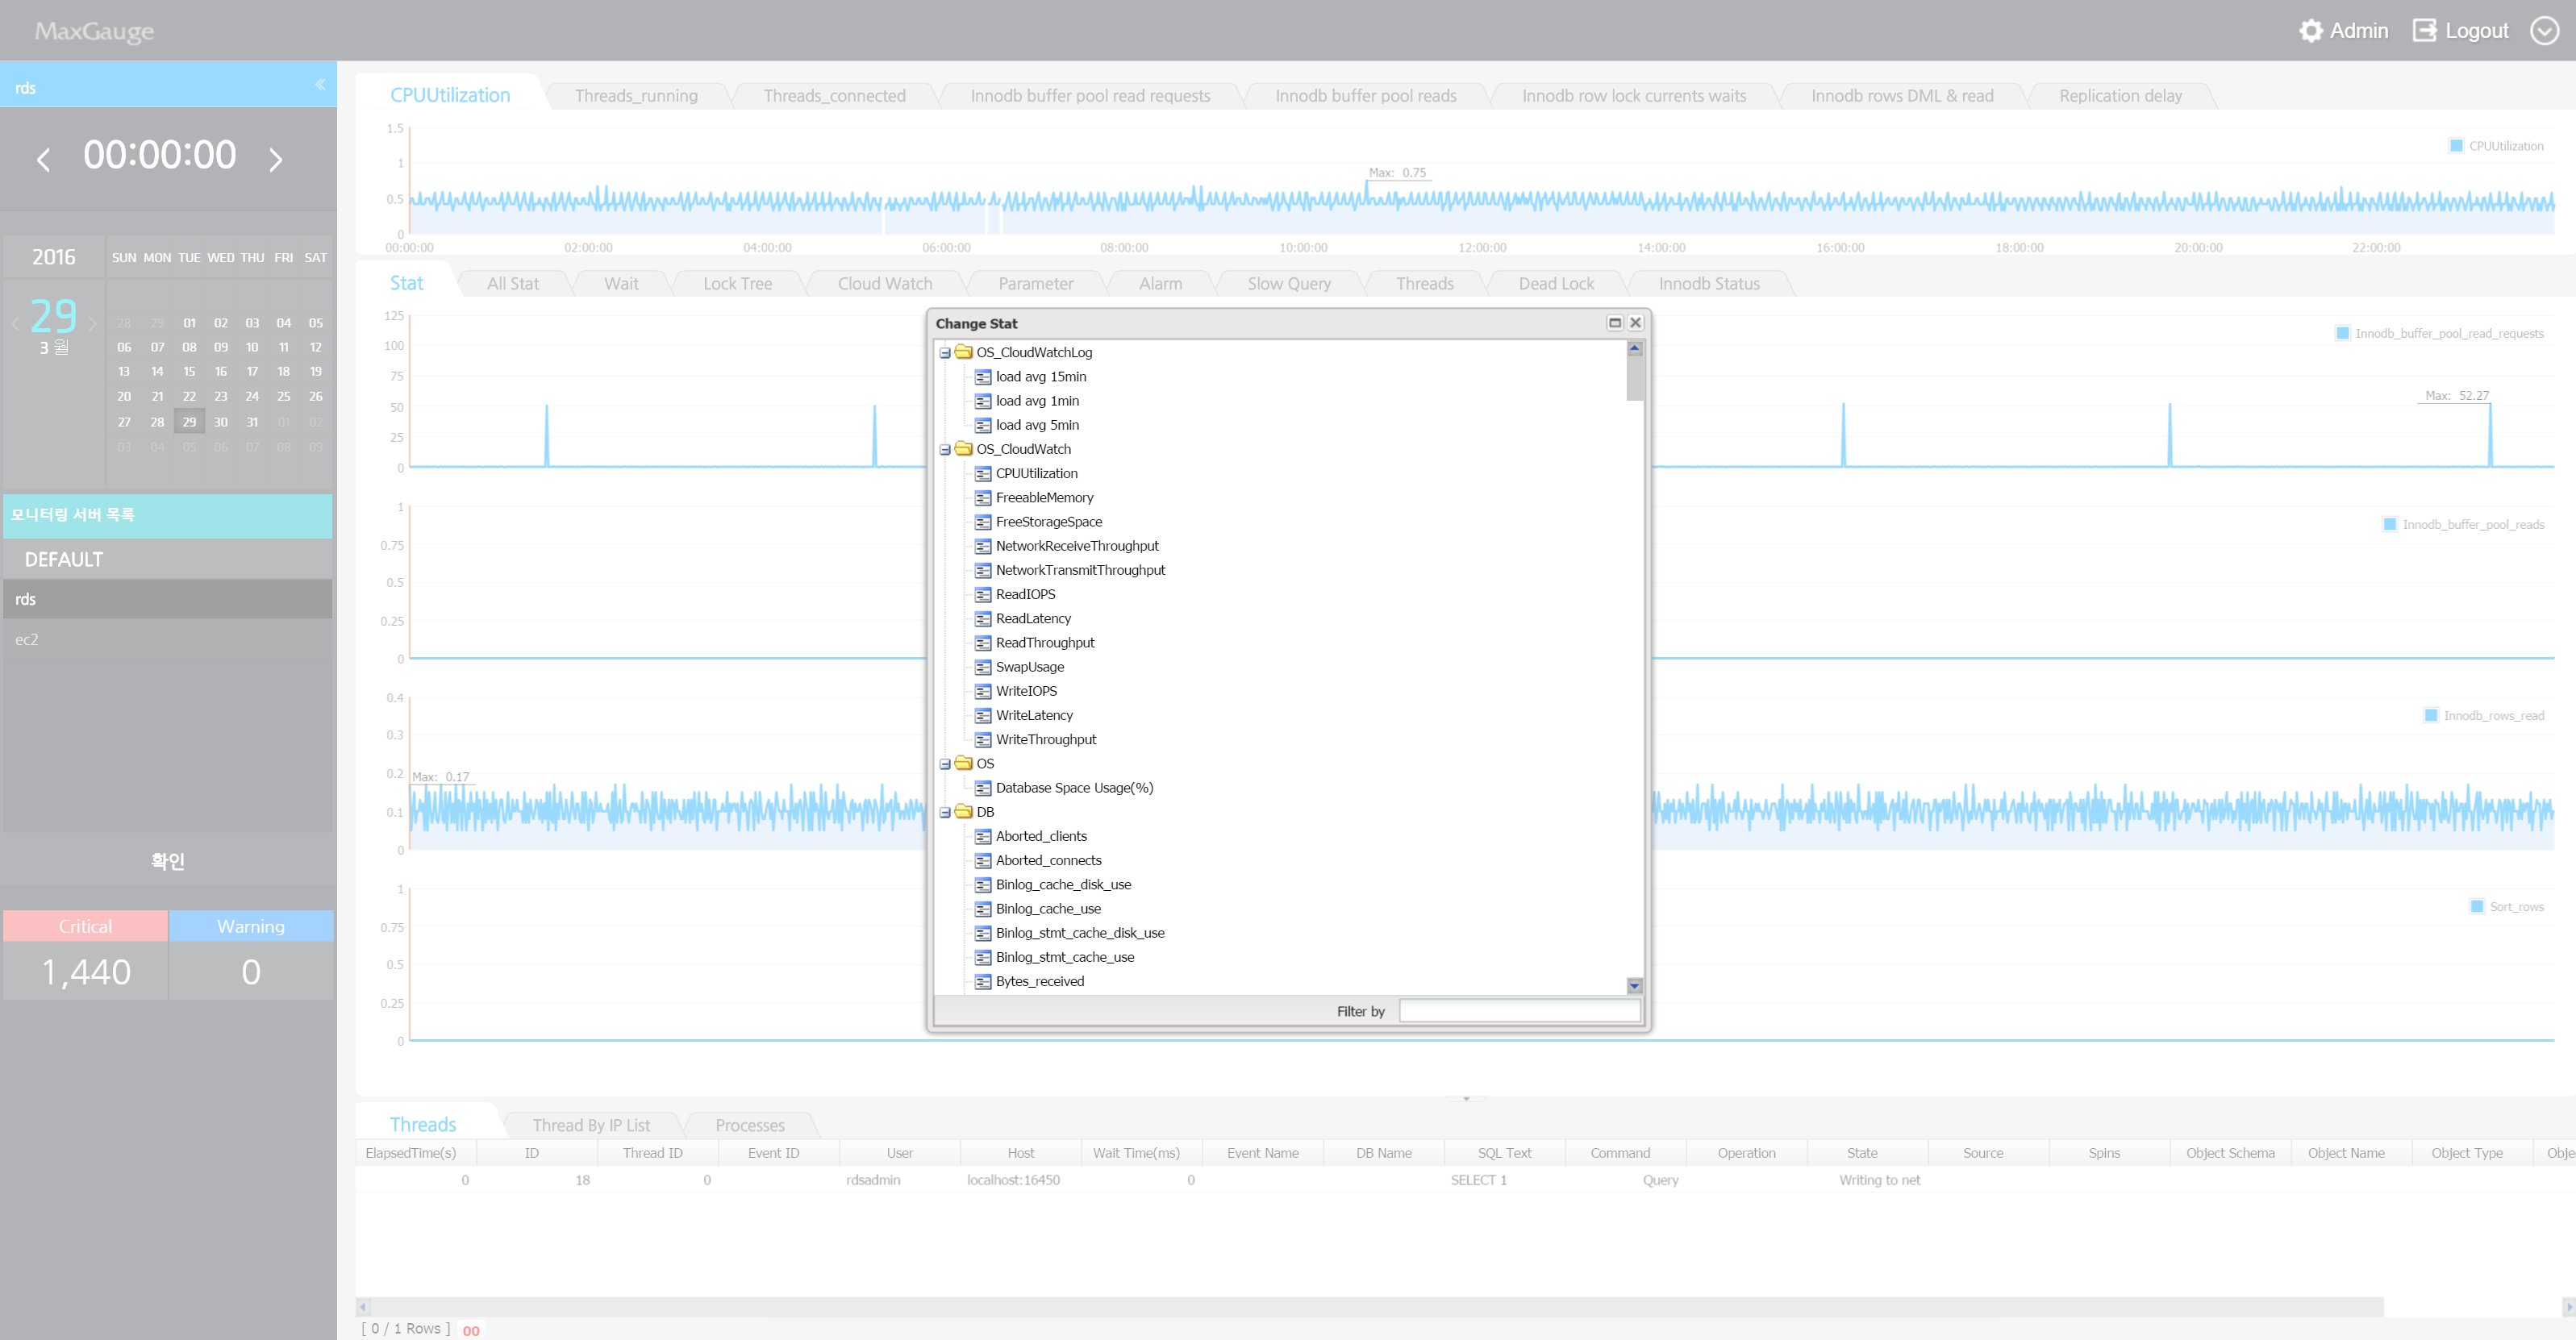
SUB) To Change the Monitoring Indicator Items
- The monitoring indicators displayed on MaxGauge’s Multi Monitor Area may be changed according to user’s preference. To change the items, click on the
 button on the right. button on the right.
2. Outputs a list of items you can change. Click the indicator you wish to change.
MAXGAUGE FOR MYSQL transmits only the pre-selected indicators to the Real-Time View. If you do not need to change the indicators, go to ADMIN > Stat > Stat Info and change to Yes for Use, and you will be able to use the corresponding indicators on the Real-Time View.
Back To Top
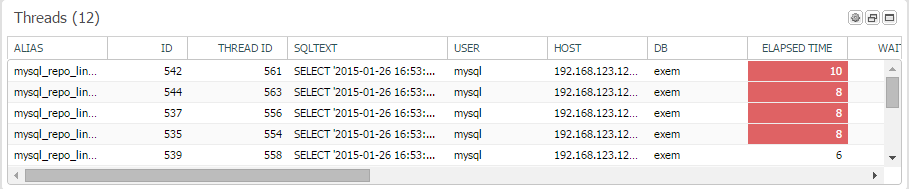
SUB) To View Threads
3. In the Threads area at the bottom, you will find a list of Threads that are currently active.
Back To Top
SUB) Multi Monitor Area
The ‘Multi Monitor Area’ of MaxGauge’s main screen is composed of 10 sub-windows, and the user can choose various information provided by MaxGauge such as MySQL’s performance indicator, CPU indicator, and the ratio indicator from each sub-window.
Back To Top
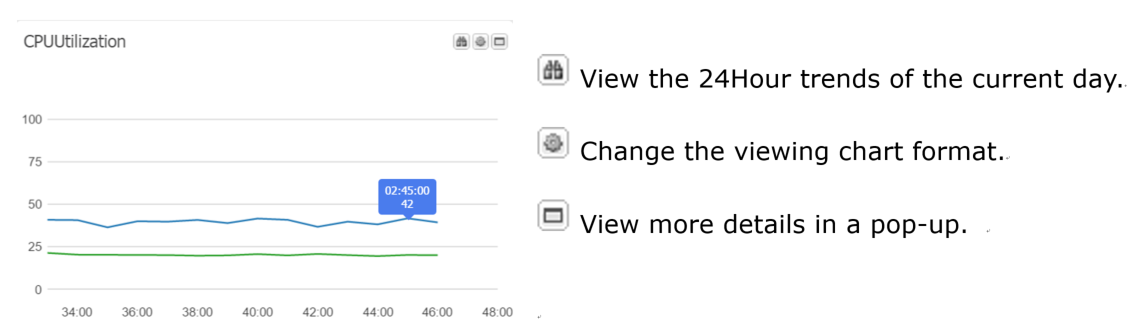
SUB) Monitoring Target Main Performance Indicators
- CPUUtilization
- FreeableMemory
- Threads running
- Innodb buffer pool reads
- Threads connected
- Innodb rows updated
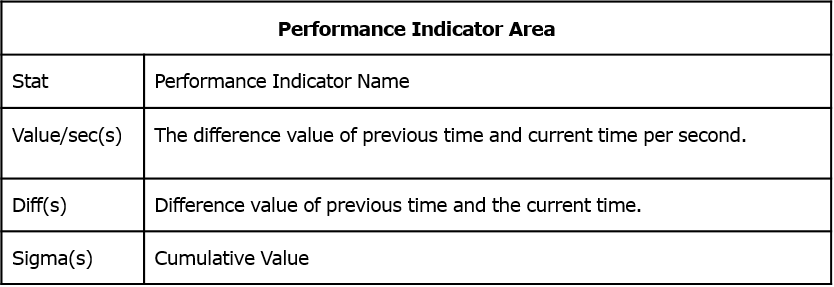
The Multi Monitor Areadisplays 6 performance indicators by default. The graph and the values displayed on the screen are defined as the average value per second of the difference value of the time (t) and the previous time (t-1) divided by the elapsed time (sec) in the case of performance indicators logging values in cumulative format; and the current values in the case of performance indicators logging current values.
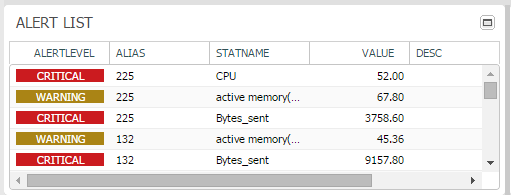
Alert Area
In the Alert Area, you can check the alarm history of the instance currently being monitored.
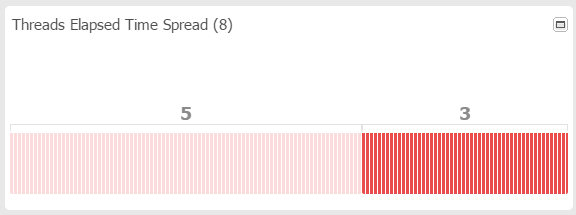
Thread Elapsed Time Spread Area
Checks the individual elapsed time of each active thread and indicates the thread count by each elapsed time segment.
Back To Top
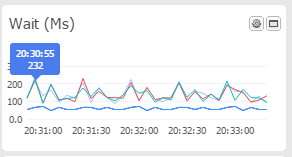
SUB) WAIT (ms) Area
Displays the average wait time of the monitoring target database.
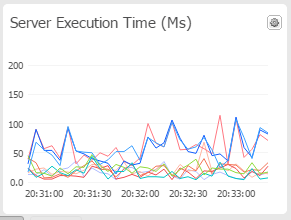
SERVER EXECUTION TIME (ms) Area
The Server Execution Time is an indicator which checks the elapsed time by continuously executing simple quieries as to know whether normal query execution is possible in the monitoring server.
Back To Top
Session Tracking by Top Down Method
ㆍTracking Top Sessions
Some of MaxGauge’s greatest advantages are the Top-Down approach method which allows you to track down the root cause of the problem from the main screen to the ‘Session Detail’, SQL Level’, and the ‘Execution Plan Level’, and the ability to collect all the necessary performance information in a short period of time to investigate the root cause of the problem.

( Thread -> Session Detail -> Sql Mini )
Back To Top
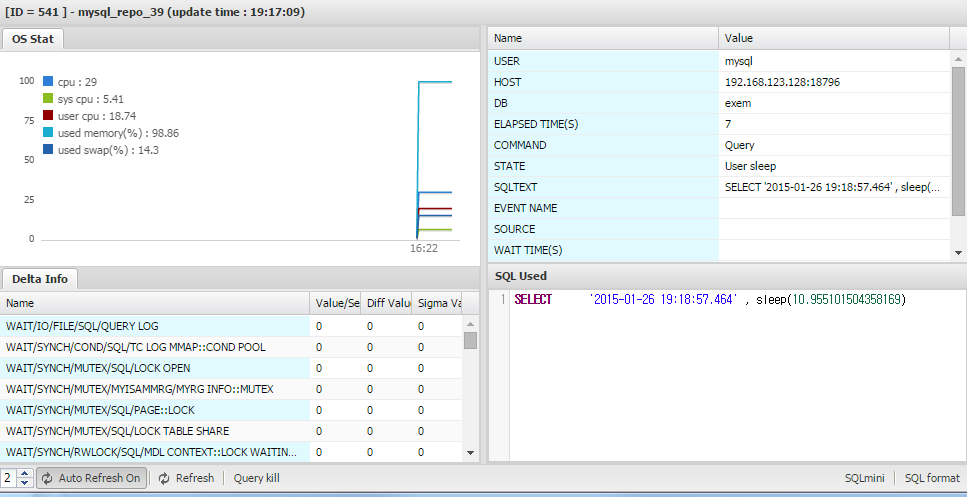
SUB) Thread Detail
ㆍThread Detail Overview
The THREAD Detail can provide detailed information about a particular thread in the database system and has the following functions.
- Wait indicator’s content and activity amount from the time of connection to an individual thread until now.
- Wait indicator’s content and activity amount between the current time and the previous time.
- Thread default information and the SQL text currently executing.
- Query Kill function
The following is the Tread Detail Initial Screen.
Back To Top
SUB) Thread Detail Description by Each Area
Thread Control Area

You can manually Refresh or Query Kill the threads actually operating.
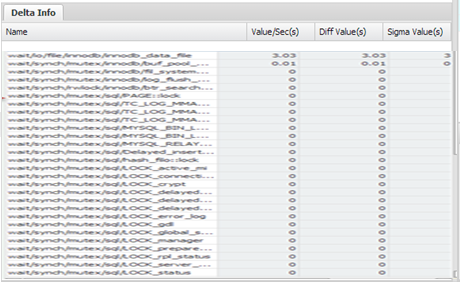
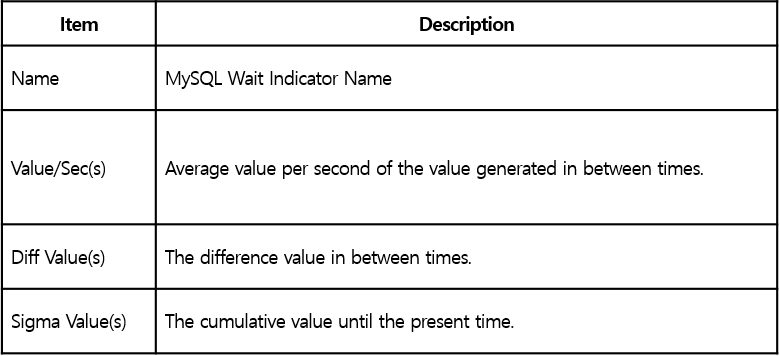
Detail Info Area
Displays the cumulative value (Sigma) and the Value/Se of the wait information about the corresponding session which has been waiting until the present.
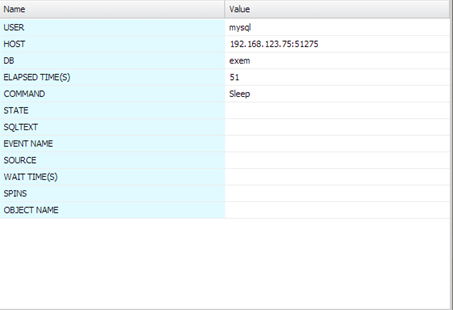
Session Basic Information and Current Wait Area
Displyas the User Name, Host Name, DB Name, Elapsed Time Information and the Current Wait Information.
SQL Used Area
The is the area where the currently executing used SQL text is displayed.
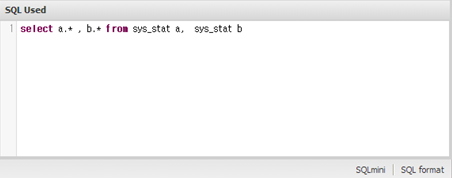
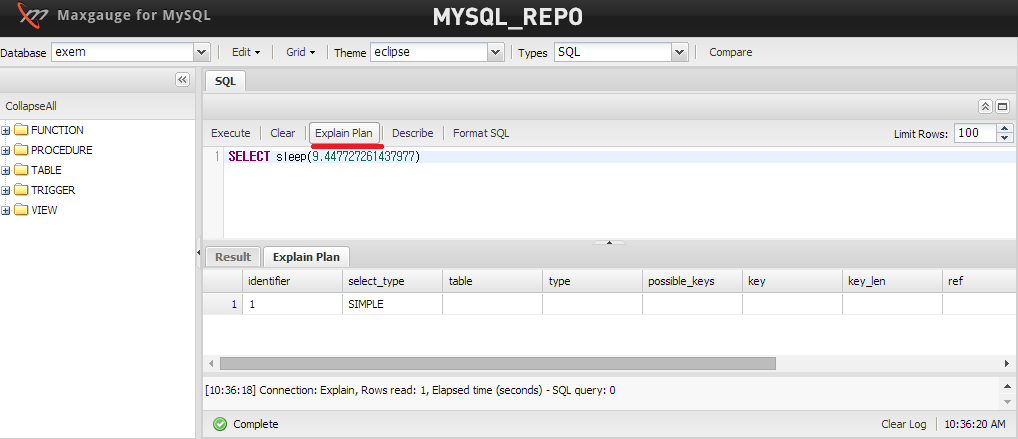
To see the execution plan of the SQL Text, click on the SQLmini button located on the right bottom.
If the SQL text is not readable due to long length, use the SQL formatting function. Click the Format SQL button at the bottom of the window.
Back To Top
SUB) Thread Detail Drive Method
To drive the Thread Detail, use the following methods.
- From MaxGauge’s main screen’ Thread Tab, double-click on the session.
- From MaxGauge’s Threads Manager screen, double-click on the session.
- From MaxGauge’s Lock Tree screen, double-click on the Thread.
Back To Top
Refresh Function
For most of the windows monitoring the performance information including MaxGauge’s main screen, once the initial installation is complete, the Auto Refresh Time is set for every 5 seconds, and the user may adjust the Refresh time as necessary. The Auto Refresh Time can also be adjusted by the user as necessary, and the interval should be a minimum 5 seconds.
Back To Top
SUB) Collection Cycle Settings
- Admin > Logging Control > Logging Manager.
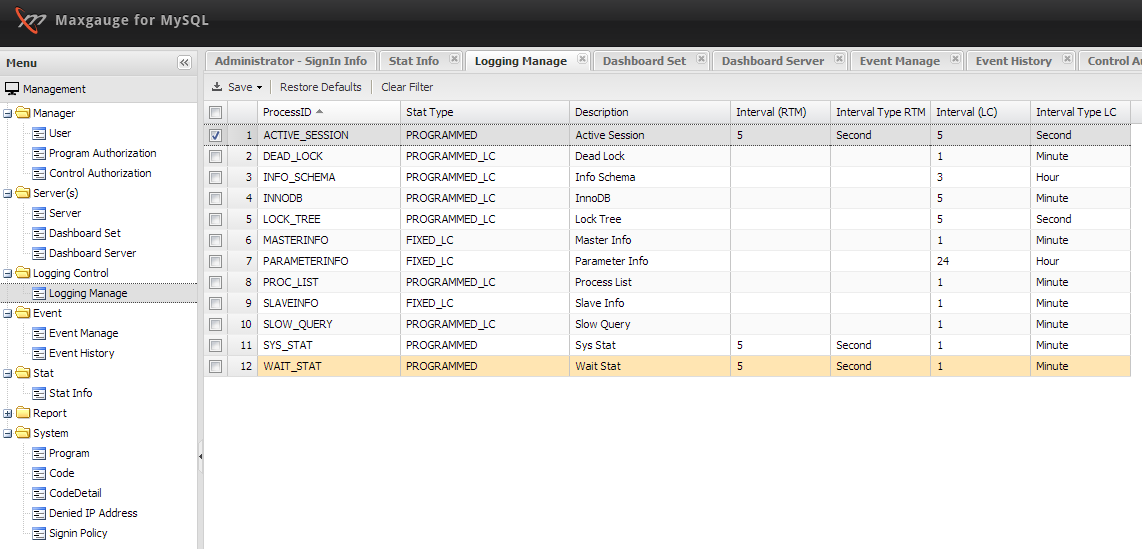
(Full View Shot)
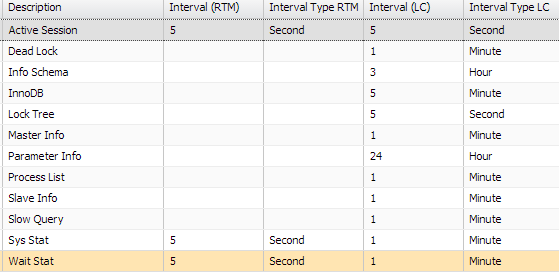
(Configuration)
You can configure the Real-Time and Logging collection cycle. Once the changes have been made, you must restart the product ( all.stop.sh -> all.start.sh ).
Back To Top
MAIN) 4.Main Functions
Back To Top
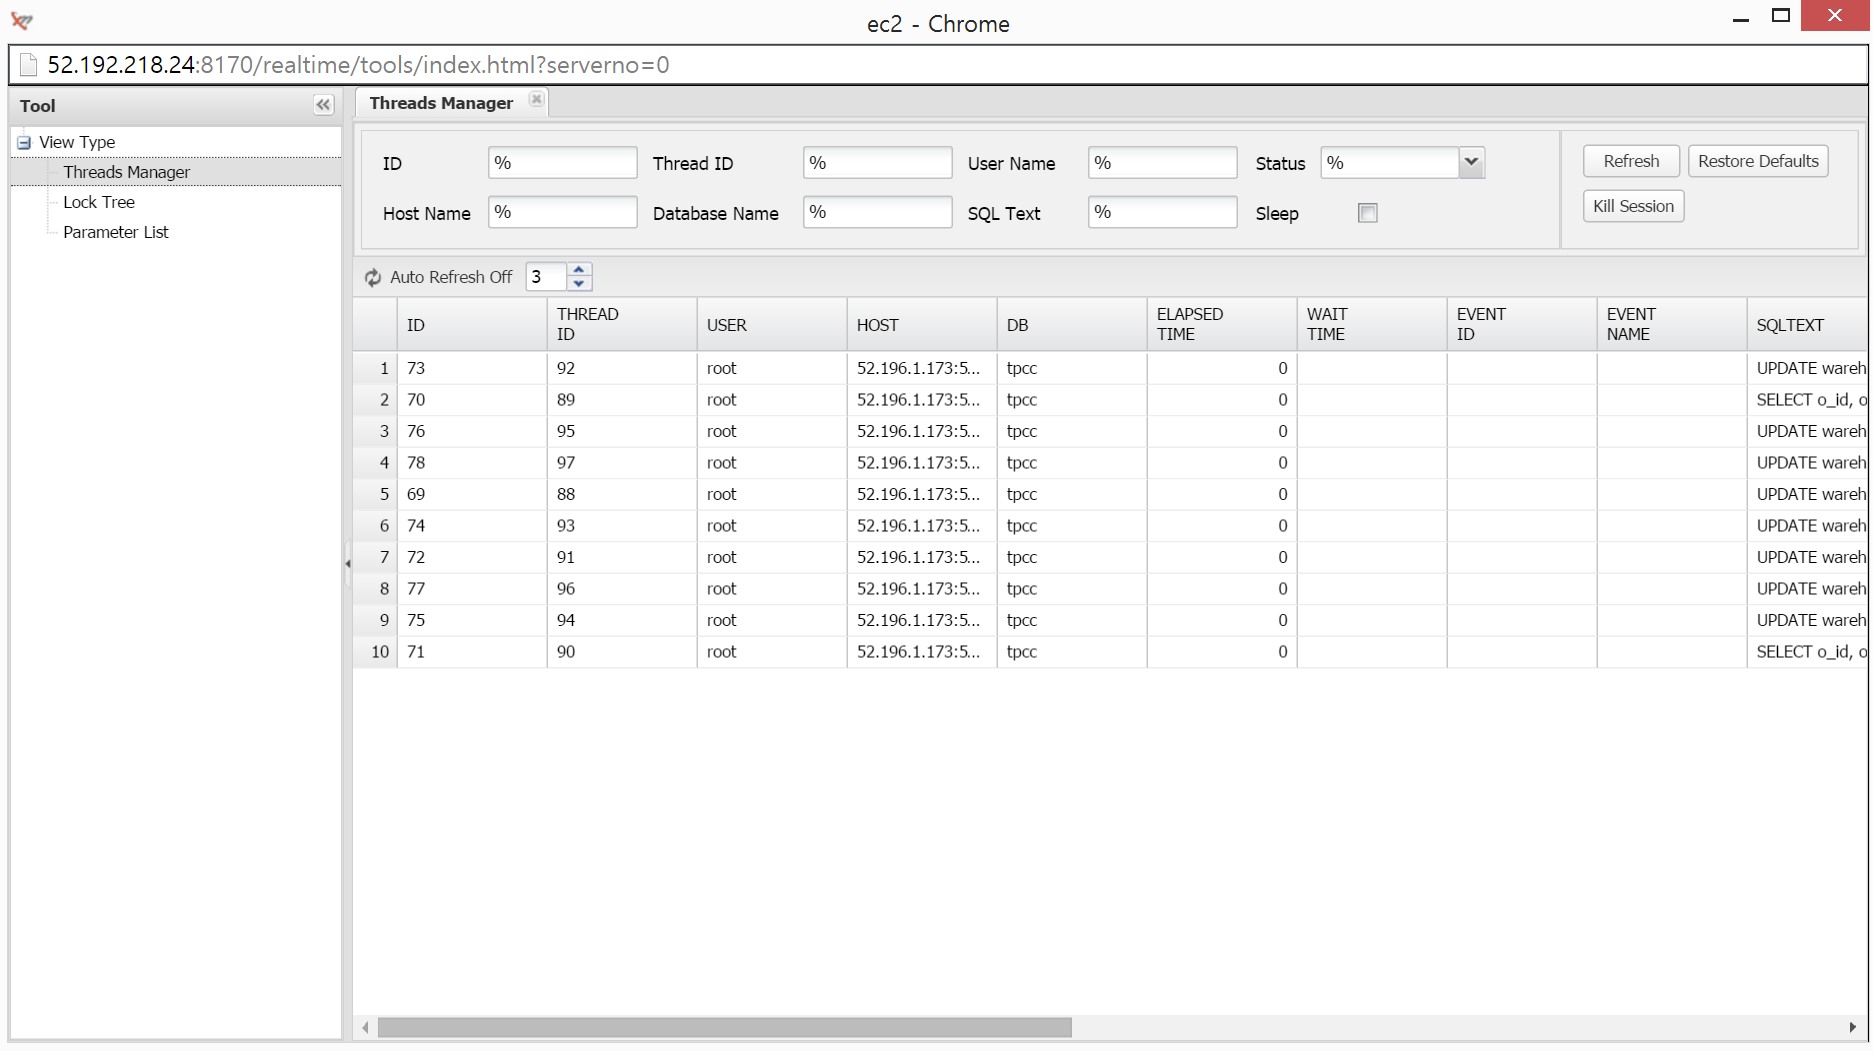
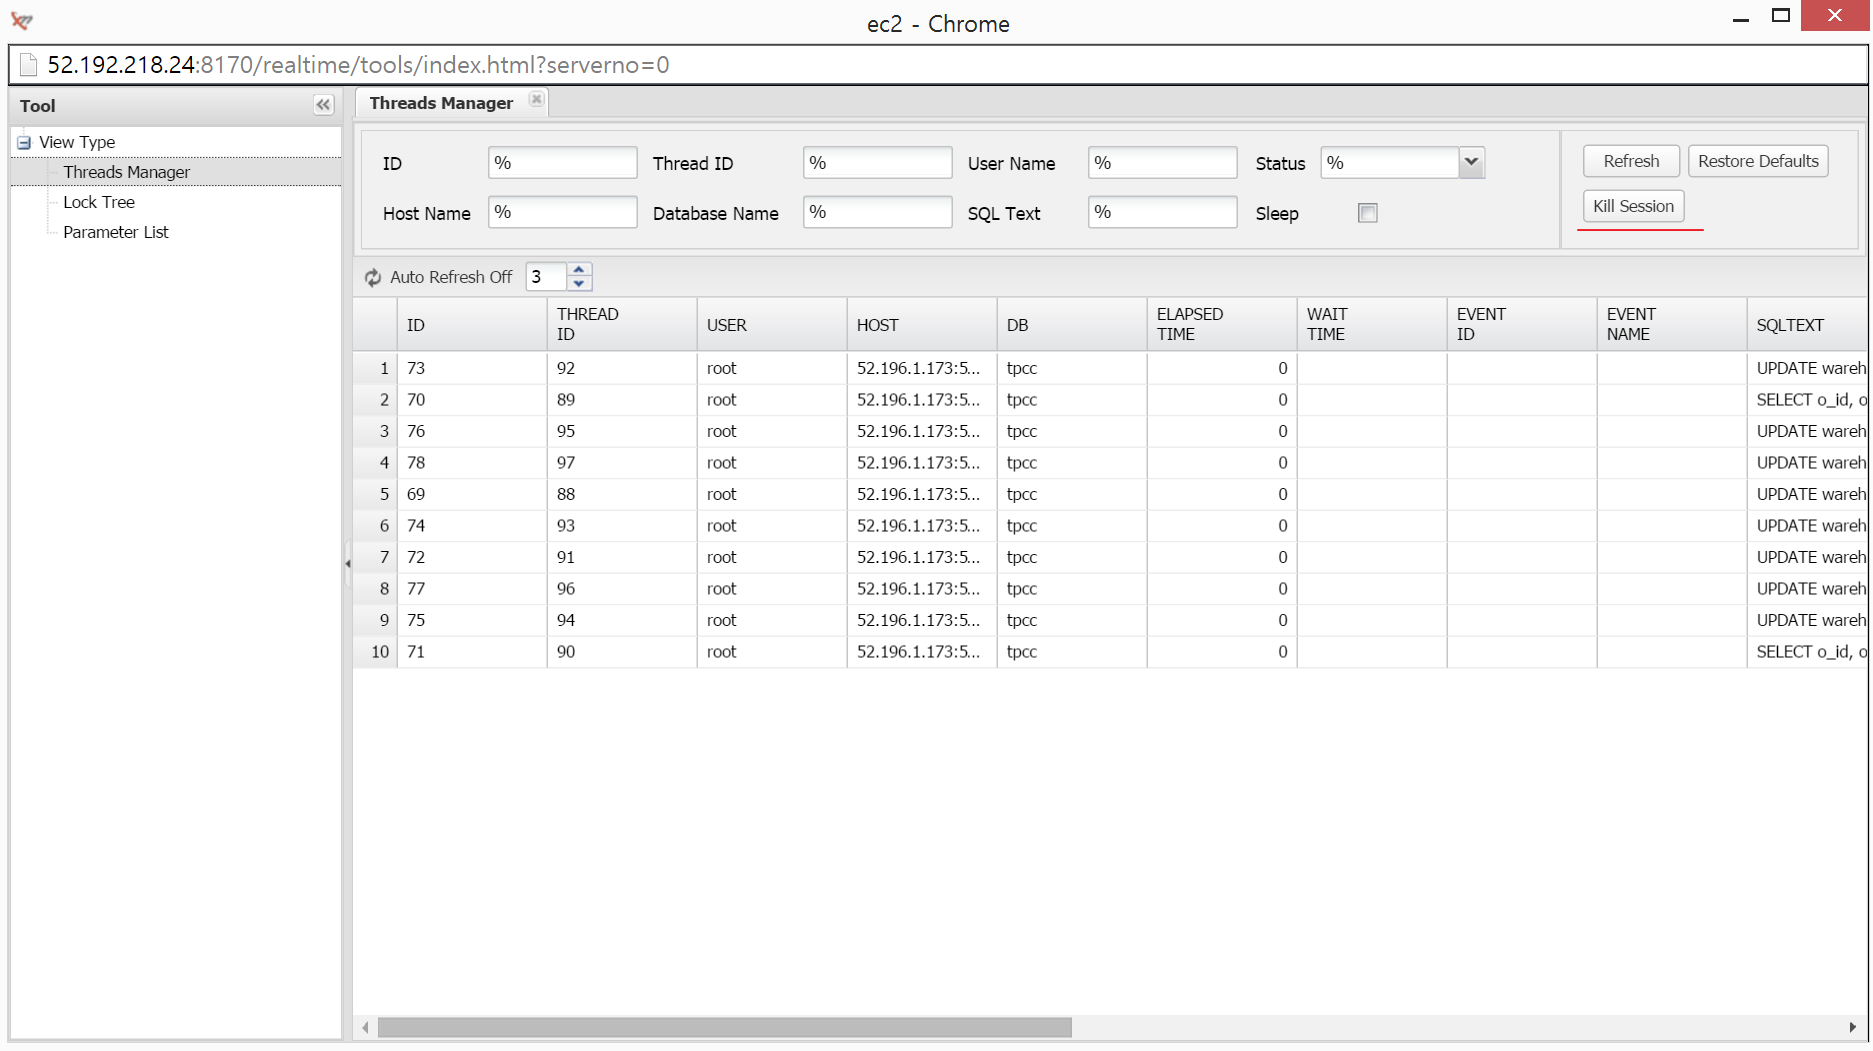
Threads Monitor
THREADS Manager is intended for monitoring the sessions that are connected to the database and currently running, and helps to find the sessions you want to look up through several conditions.
Back To Top
SUB) Drive Threads Manager
Go to Tool of the Server you wish to monitor.
- On the Server List on the left, mouse right-click and go to Tool -> Threads Manager.
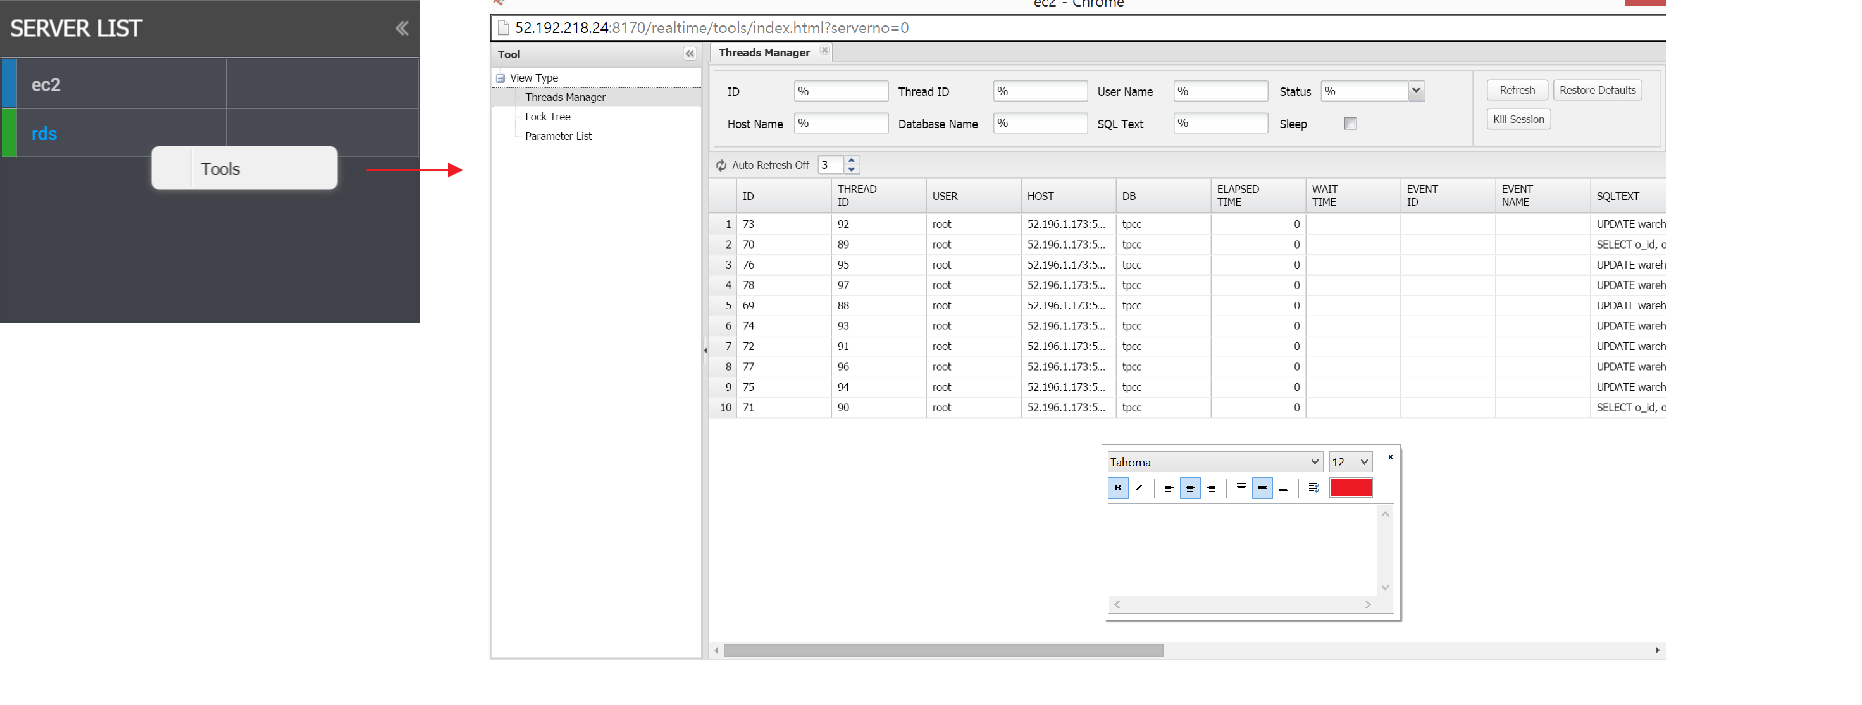
2. When the corresponding database’ Threads Manager window opens, it will show the information of all the sessions currently connected to the database.
Back To Top
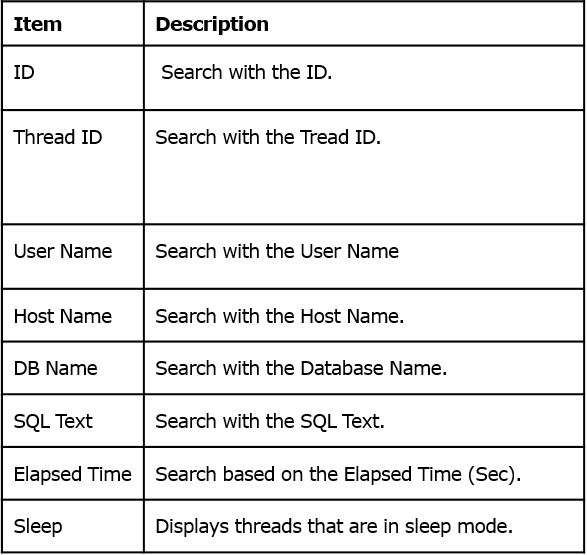
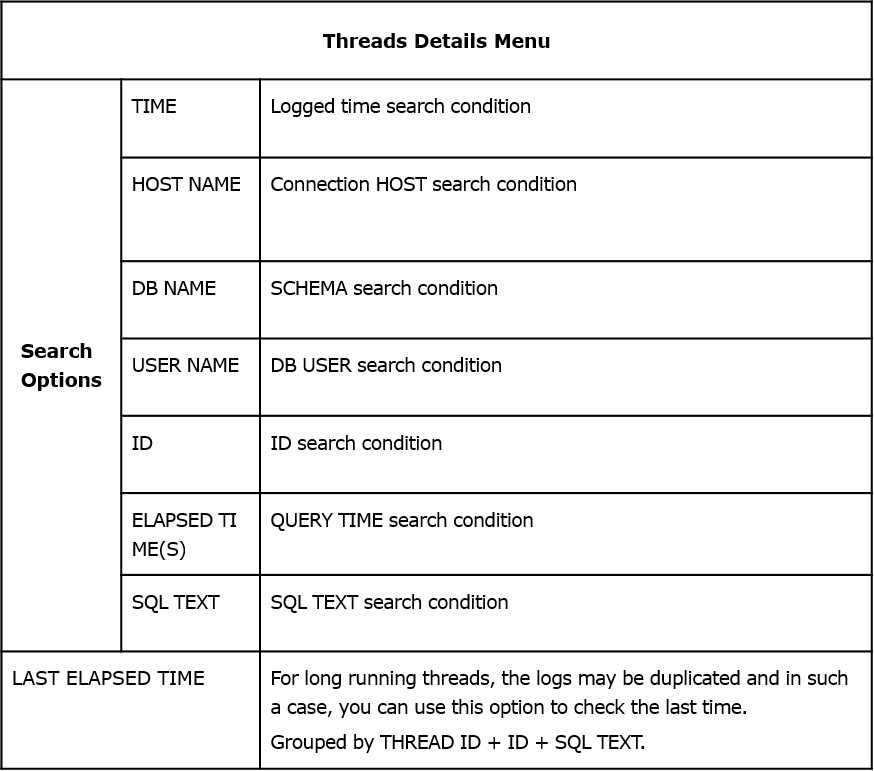
SUB) Search Thread
The user can pull up specific threads from the total list by entering certain values in the conditions input box located at the bottom of the Threads Manager.
The following provides descriptions of items used in search condtions.
Back To Top
SUB) Kill in Threads Manager Results Window
The sessions displayed on the Threads Manager Results window may be selected by using the direction arrow keys, and the session is highlighted when selected.
When in selected mode, the kill function which forces the session to end may be executed and hence, it must be handled with caution.
Back To Top
Lock Session Trace (Lock Tree)
The Lock Tree screen displays the information about sessions waiting on the Lock and the sessions which caused the lock, among all the sessions currently connected to the database system.
- Tools > Select Lock Tree
- Lock Tree window of the corresponding database.
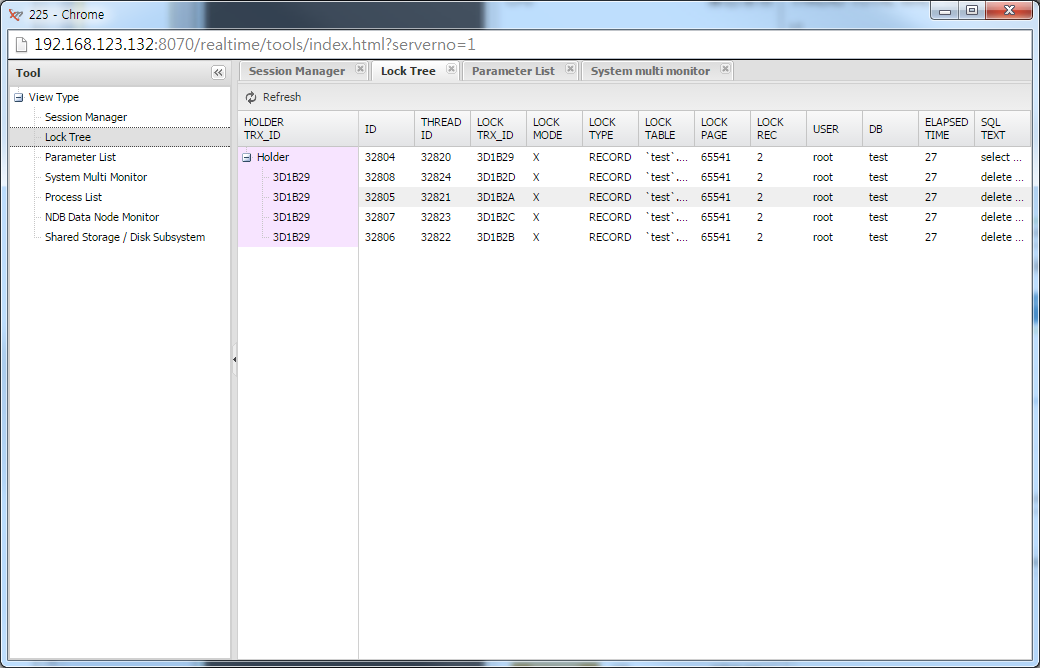
The Lock Tree screen displays the selected database’ lock holder and the requests relationship in a layer structure, which allows you to quickly distinguish the lock relationships among the sessions.
Back To Top
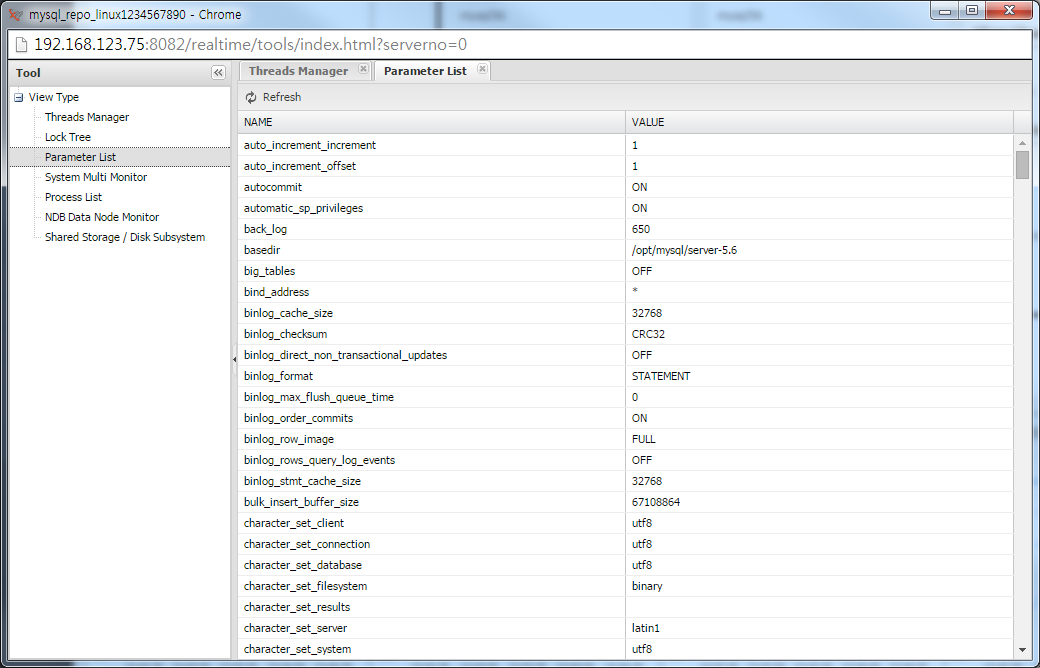
Parameter
You can check the current database’ parameter values.
- Tools > Select Parameter
- The corresponding database’ Parameter screen
Back To Top
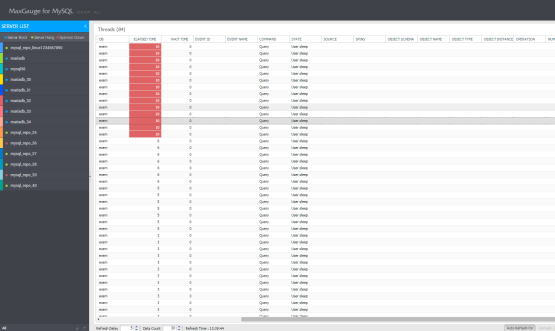
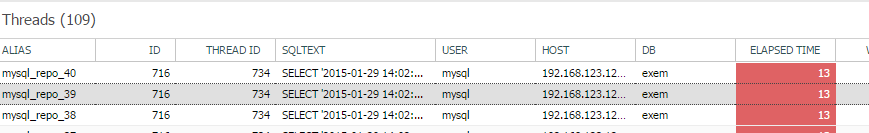
MAIN) 5. Intensive Monitoring Window ( Threads )
You can do an intensive monitoring of THREADS and SLOW QUERIES from the Real-Time Monitoring window.
(READS Window )
Back To Top
Threads
Back To Top
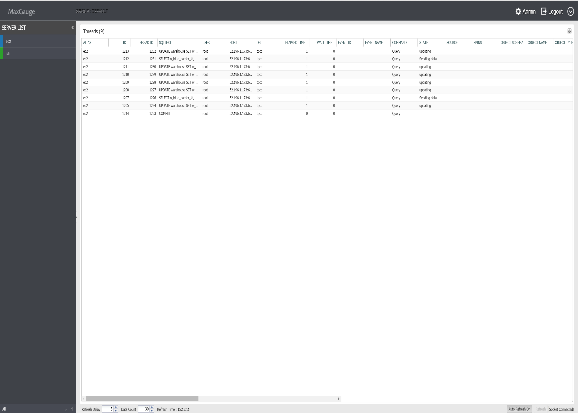
SUB) Threads Window
The Server List of the corresponding group will be on the left, and the THREADS within the GROUP will be output on the right.

(THREAD Window)
Back To Top
SUB) Advanced Filter by ELAPSED TIME
Do an advanced filter of threads by ELAPSED TIME >= ?
Back To Top
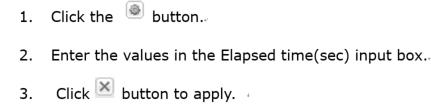
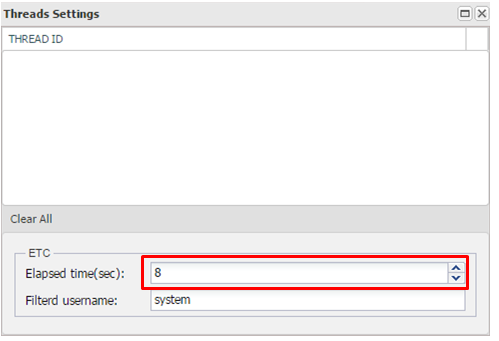
SUB) Configure Advanced Filter by ELAPSED TIME
Back To Top
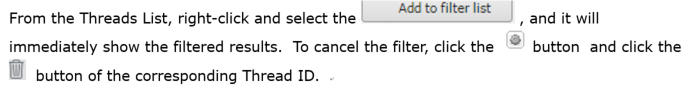
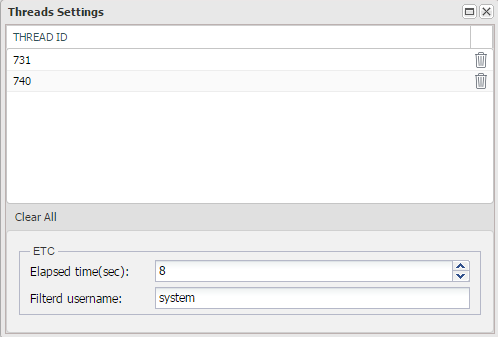
SUB) Filtering by Specific THREAD ID From the THREADS List
Back To Top
SUB) Single Server View
Back To Top
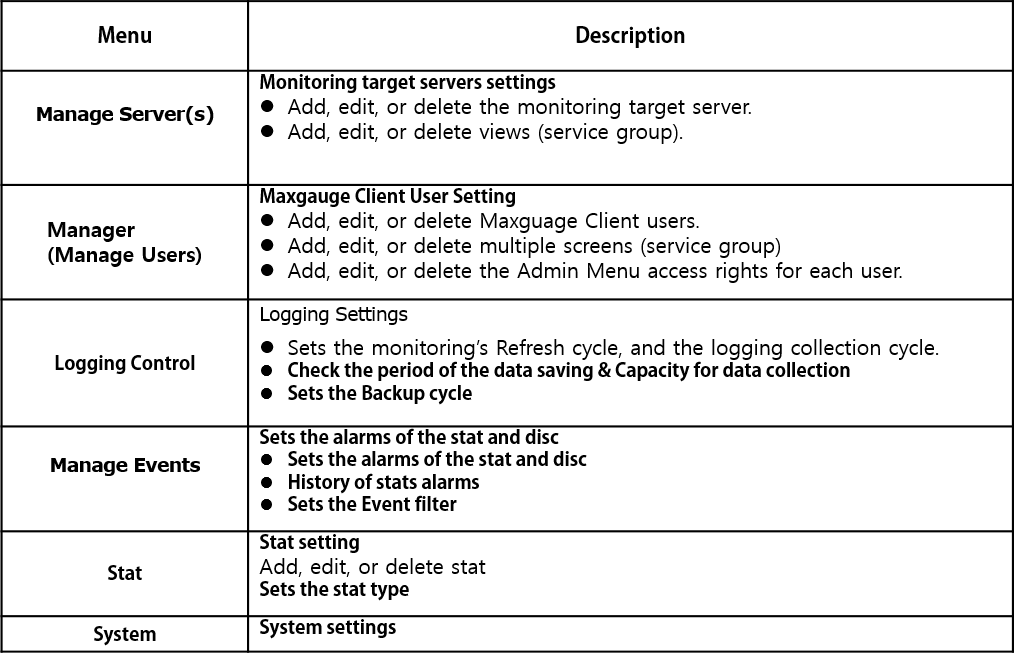
MAIN) 6. Manage Functions
Configures detailed items in Maxgauge product. For some of the features, after configuration, you must restart the Gather to reflect changes.
Back To Top
Admin Access
- Click on Admin.
Back To Top
Admin Screen
Back To Top
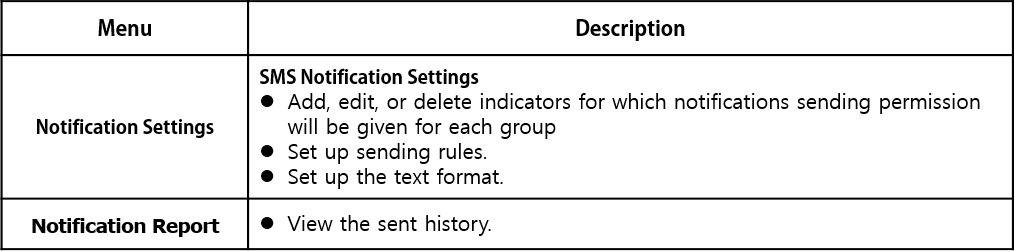
Manager Menu
Notification Config
Back To Top
MAIN) 7. Gather ( MaxGauge Logging ontroller )
Back To Top
Gather Overview
The limitation of real-time performance management is in that the problem diagnosis and resolution must be done in real-time. However, a DBA cannot work 24 hours around the clock at the workstation for real-time monitoring and diagnosis. And in the event performance issues arise, if we try to resolve the issues by rebooting the database, cancelling sessions by force, or program’s automatic shutdown, the source of data through which the root cause of the problem may be identified will be destroyed, making it impossible to further investigate the problem through a post-analysis.
MaxGauge logs various performance information collected from MySQL in a safe repository to support post-analysis of the performance issues, and it compensates for the timing limitation of real-time monitoring through log analysis.
Especially, it replays the past execution situations as if in real-time, and by rewinding back to a specific time in the past, the analyzing function of the sessions and SQL executed at the corresponding time can be a helpful resource in identifying the root cause of the problem and finding the solutions. MaxGauge also provides trends analysis function for a log accumulated over a period of several of days.
MaxGauge collects and logs MySQL ‘s performance information, session information, and lock information by using the queries. The DBA can set up the logging cycle and logging data through the Logging Controller program, and do an analysis with the Performance Analyzer program.
You can check the performance degradation and database error phenomenon generated in the system, after it has occurred. Since you can check the performance indicators trends of data for specific time period by using the Performance Analyzer, you can accurately and conveniently pinpoint the time at which overload occurred, and by migrating to that specific time, you can identify the sessions and SQL executed at that time.
Back To Top
Environment Configuration
MaxGauge saves the performance information to the Repository.
Back To Top
SUB) Repository Configuration
Repository Configuration is used to save performance information in MySQL DB.
The configuration file location is conf/properties .
- properties
Configure the information for Gather to access the Repository DB.
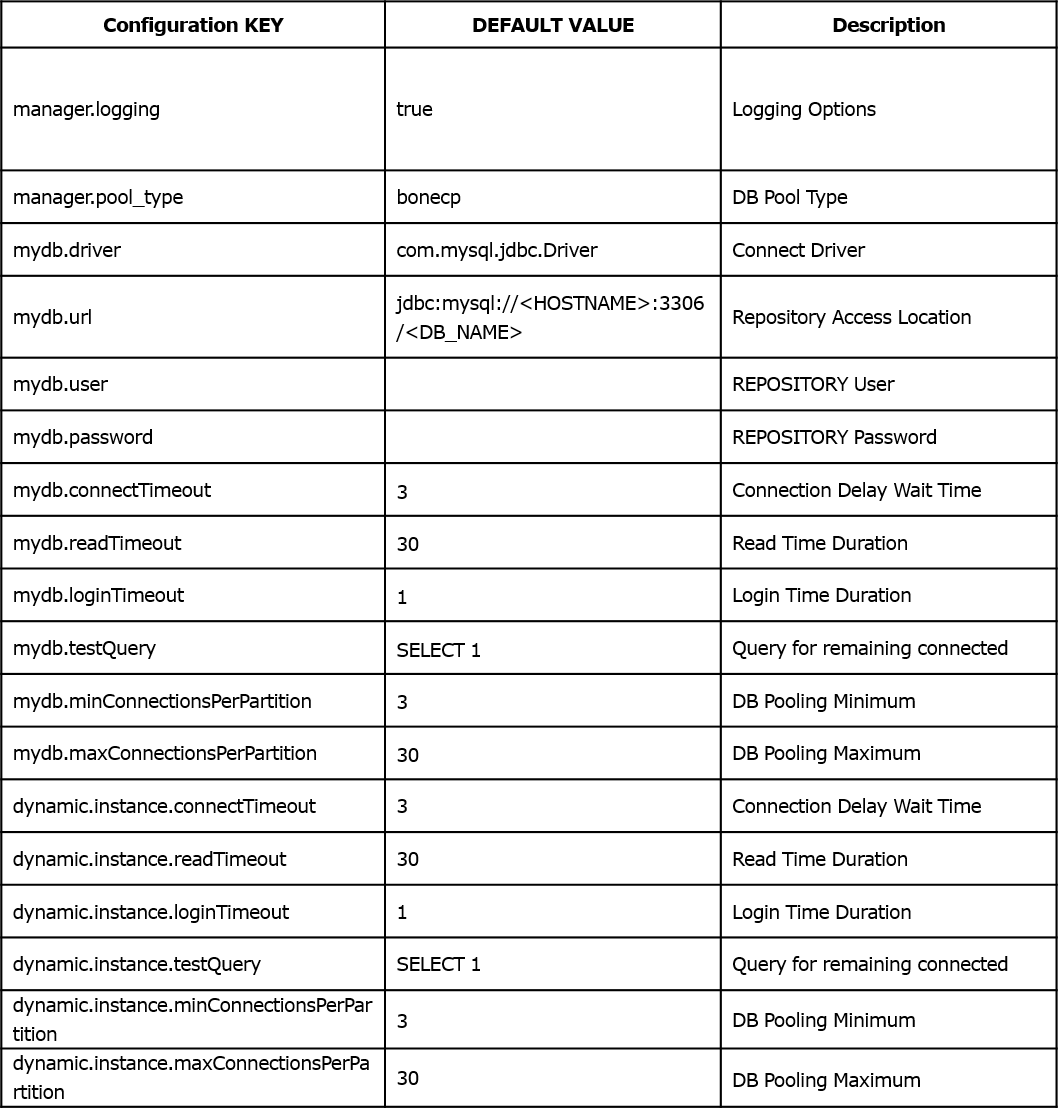
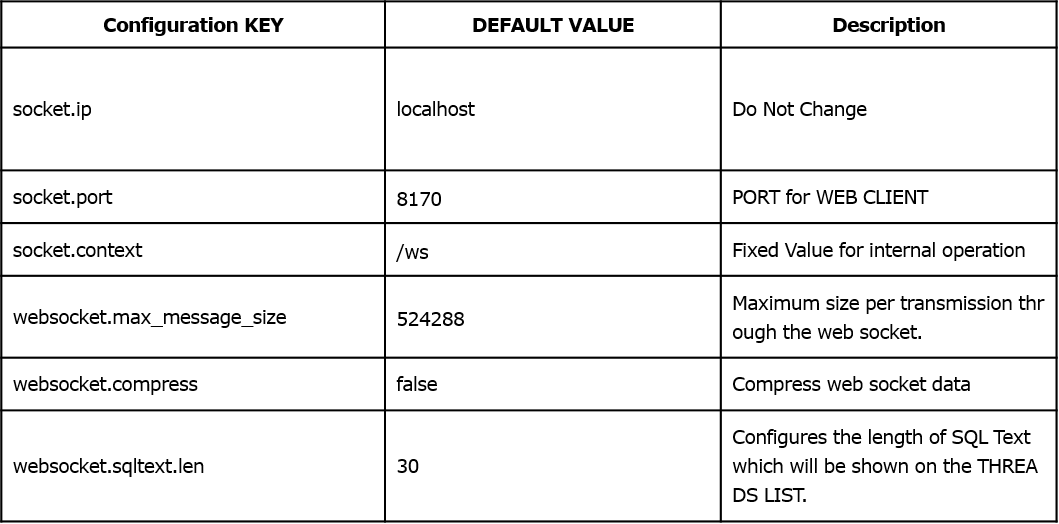
2. properties
Configure the Port the WEB CLIENT will connect to and other client related settings.
3. properties
Configure Gather details. In general situations, no changes are necessary.
4.properties
Contains the product version information. You can also check product version information from Admin’s Information area.
Back To Top
SUB) Gather Start and Stop
Once configuration is complete, execute Gather with all.start.sh.

You can stop Gather with ALL.STOP.sh.

Back To Top
Dashboard Support Function
You can connect to data in MAXGAUGE for MySQL and other house products from EXEM DASHBOARD.
There is no separate environment configuration in this product, but since a linking job is required on EXEM Dashboard, seek technical support for assistance in set up.
Back To Top
MAIN) 8. MaxGauge Performance Analyzer
Back To Top
Performance Analyzer Overview
The Performance Analyzer replays the performance indicators, Active Sessions, SQL Text and CPU indicator, and Top Processes saved to the repository by gather exactly the same as in real-time to analyze the performance and to identify the root cause of the problem in MySQL database.
Performance Analyzer is generally used most frequently for the following situations.
- To analyze performance issues throughout the overall system
- To analyze Peak Times of specific dates, problem sessions, and to trace SQLs.
- To analyze system resource usage type and trends analysis
Back To Top
SUB) Performance Analyzer Home Screen
Back To Top
SUB) Select Log
Repository is used as the supporting logging type for Maxgauge For MySQL. For the corresponding log, innodb engine and partitions are used and it is a database creating structure.
Back To Top
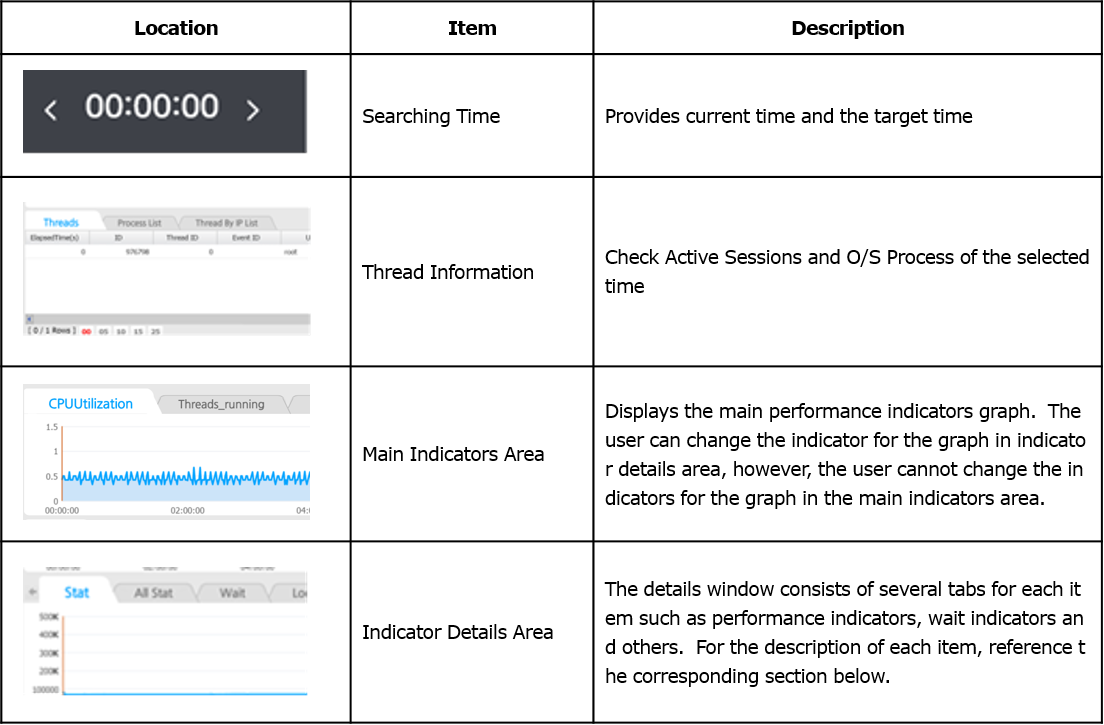
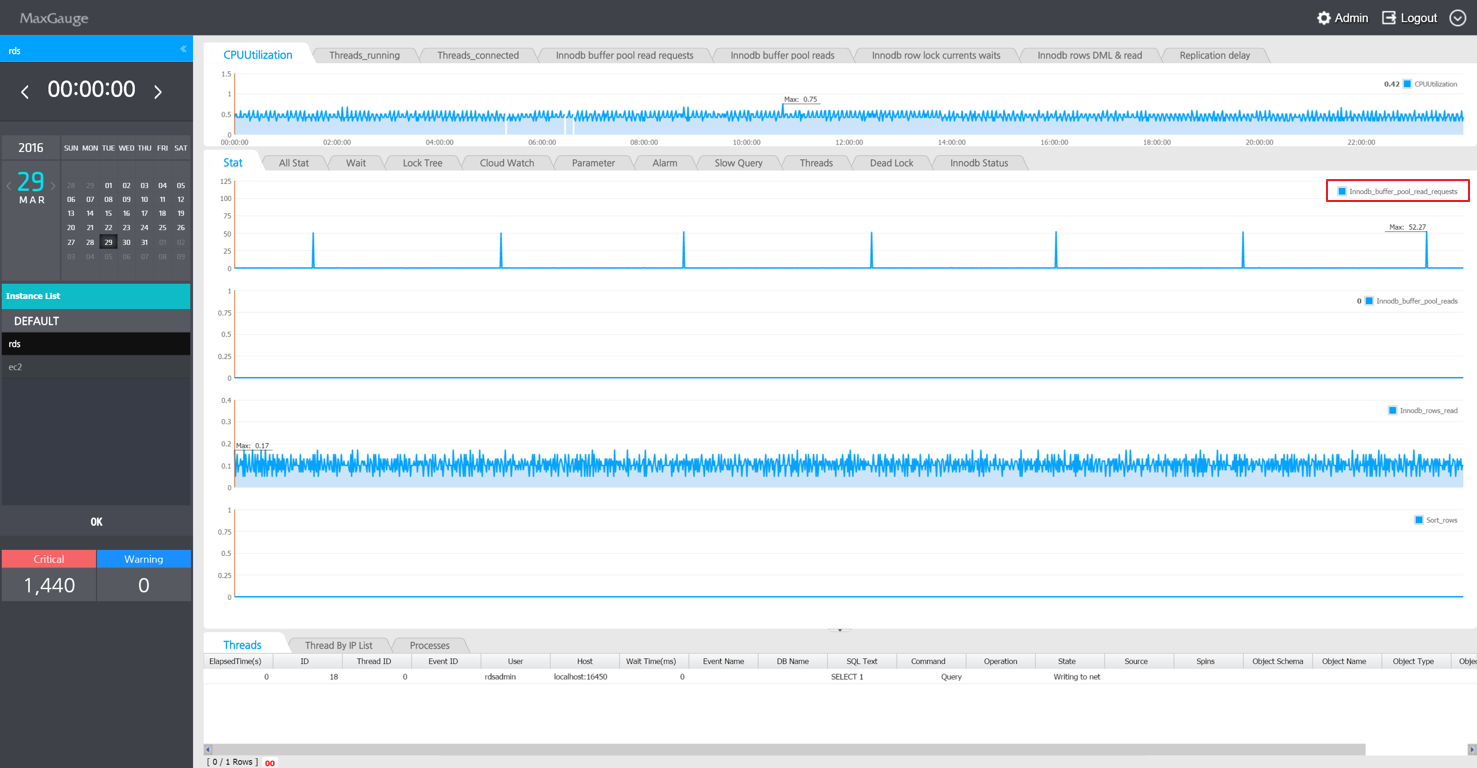
SUB) Performance Analyzer Screen Overview
The Performance Analyzer displays MySQL database’ daily execution status. All indicators are displayed in a 24 hour trends graph, and you can easily identify the Peak Time and navigate to the time you wish to analyze with just a mouse click. MySQL performance indicator, Session information, SQL Text and O/S process information are organically connected which allows you to accurately analyze the Peak Times and the times at which errors occurred.
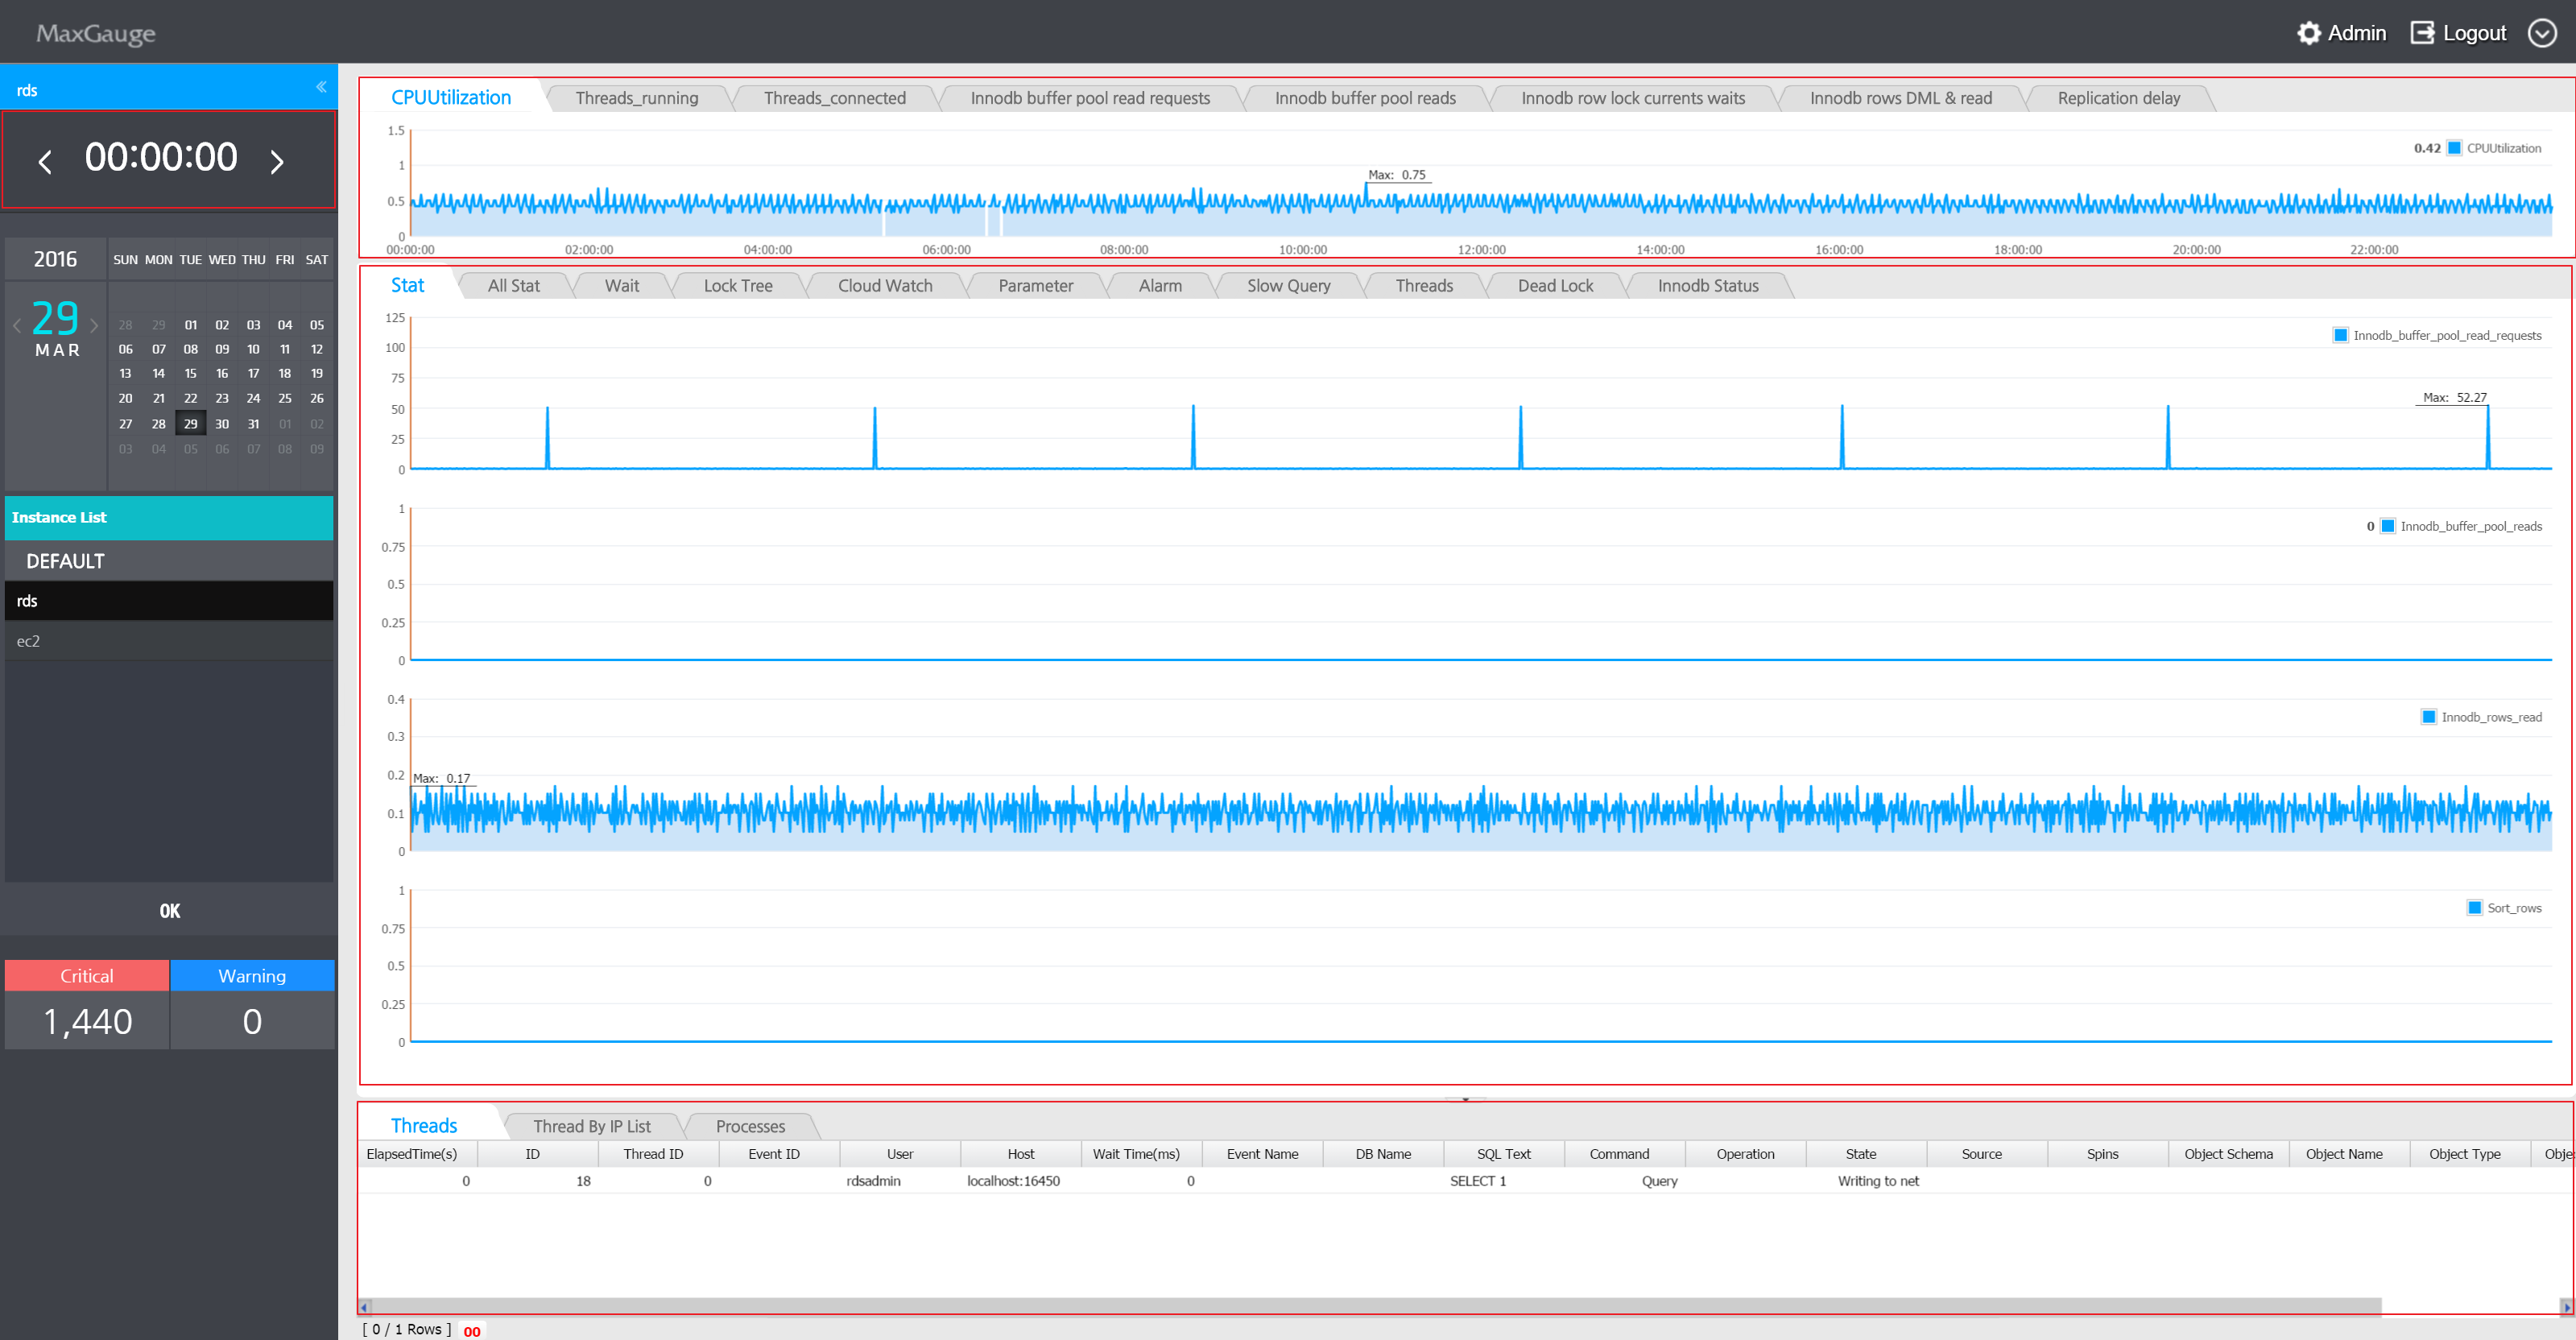
Thread and Process List Window
By looking at the trends of performance indicators displayed on the screen, you can know the type of resource usage during the collection period and the peak time of database system usage, and from the Session & Process window, since you can sort the values by clicking on the column header of each indicator, you can easily identify which sessions have used up the most resources. In general, excessive usage of resource calls for special attention and you can check the SQL text of such sessions to take appropriate actions to resolve the problem.
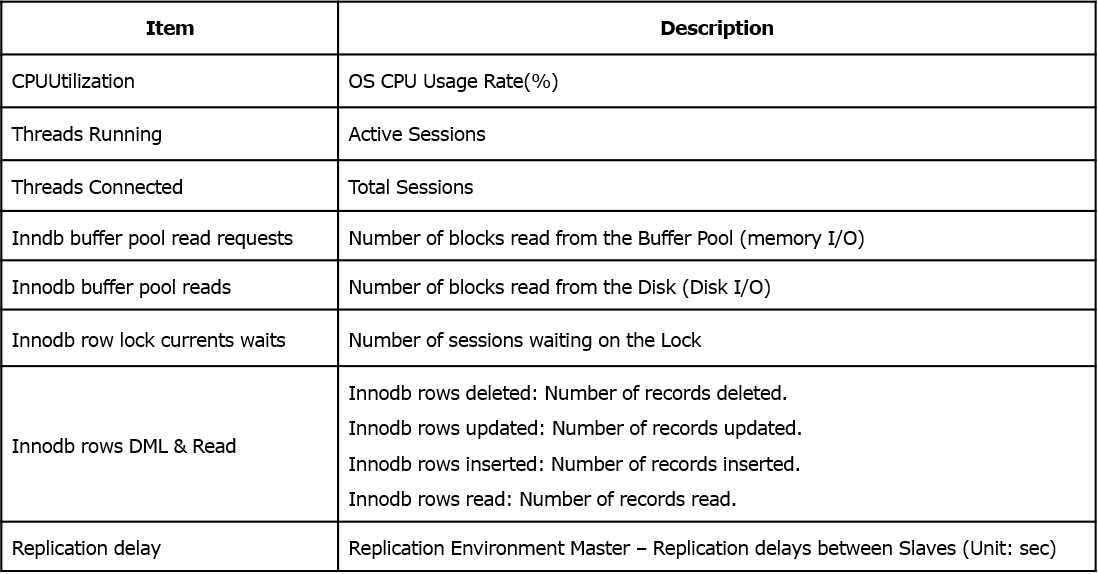
Main Indicators Area
The Main Indicators Area displays O/S CPU , Active Sessions and other important performance indicators provided by MySQL.

Back To Top
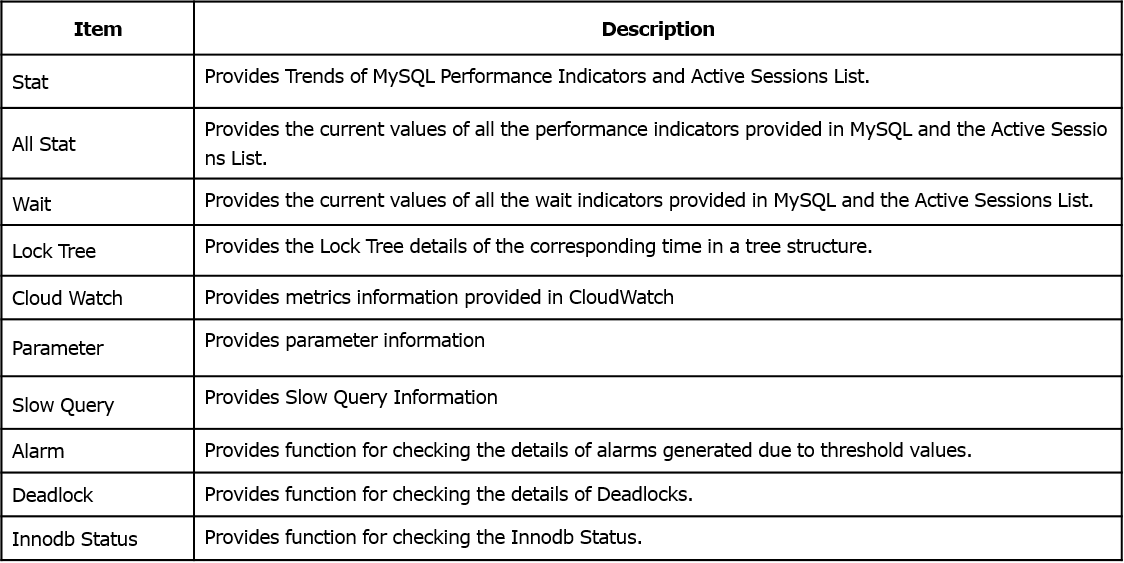
Indicator Details Area
The Indicator Details Area is divided into 9 tabs and each tab provides the following information.
Back To Top
SUB) STAT
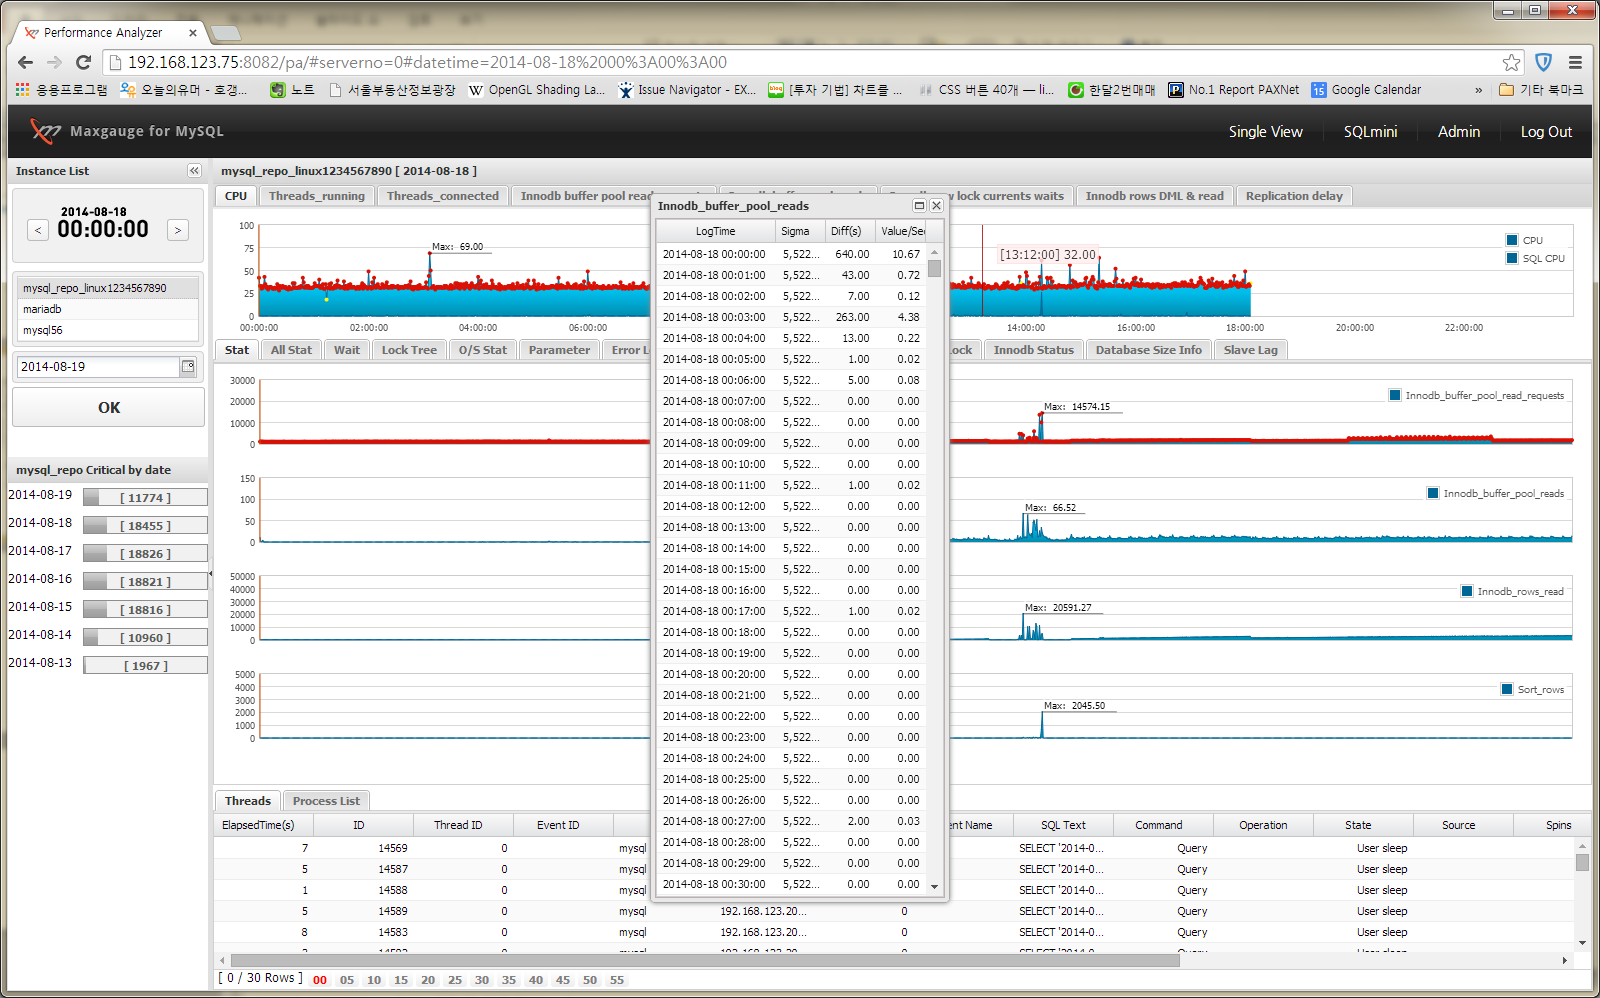
The Stat screen displays the trends graph by using the difference values of performance indicators generated in between the segments and the active sessions list. You can easily recognize the MySQL database’ peak time on the Stat screen, and you can navigate to the corresponding time by double-clicking the specific time on the graph. You can also easily identify the sessions which caused the peak times through the resource usage information shown in the Active Sessions List.

The 4 indicators displayed on the screen can be changed to different indicators by the user. To change the indicator, click on the performance indicator name located on the right side of the screen.
- Click performance indicator name.
2. Enter or select the desired indicator and click ‘OK’.
When you click on the blue square on the left of the performance indicator, it displays the all the logged values by time.
Back To Top
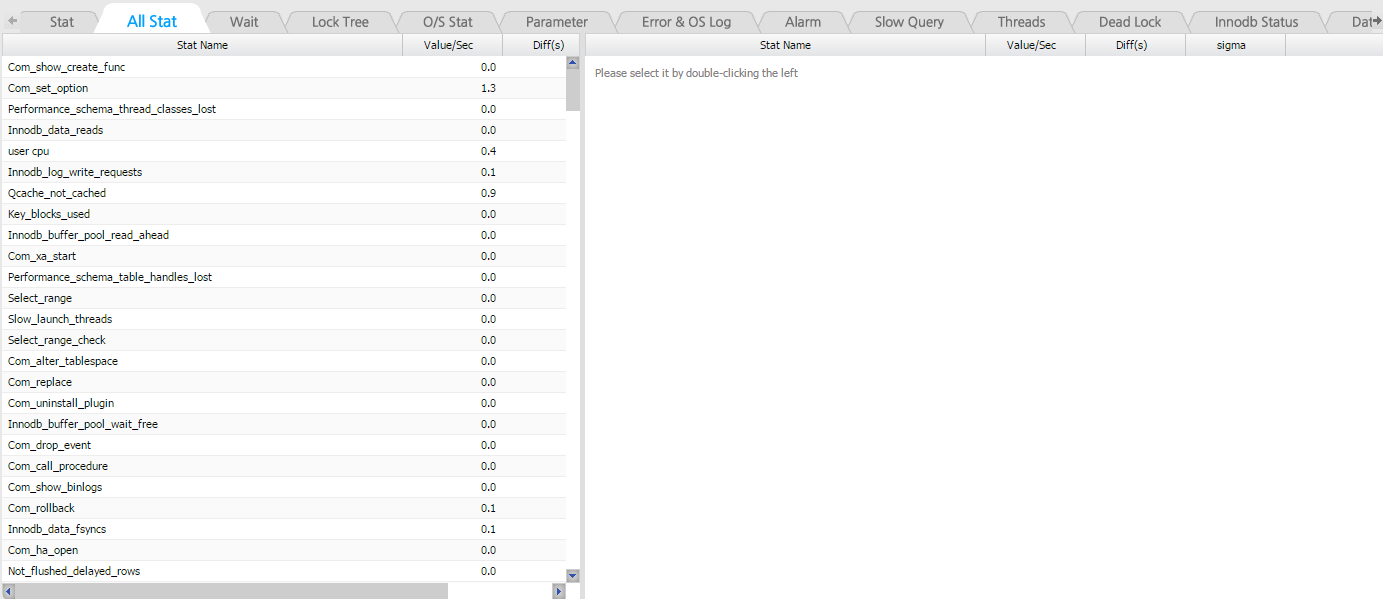
SUB) All Stat
Provides all the performance indicators provided in MySQL.
Back To Top
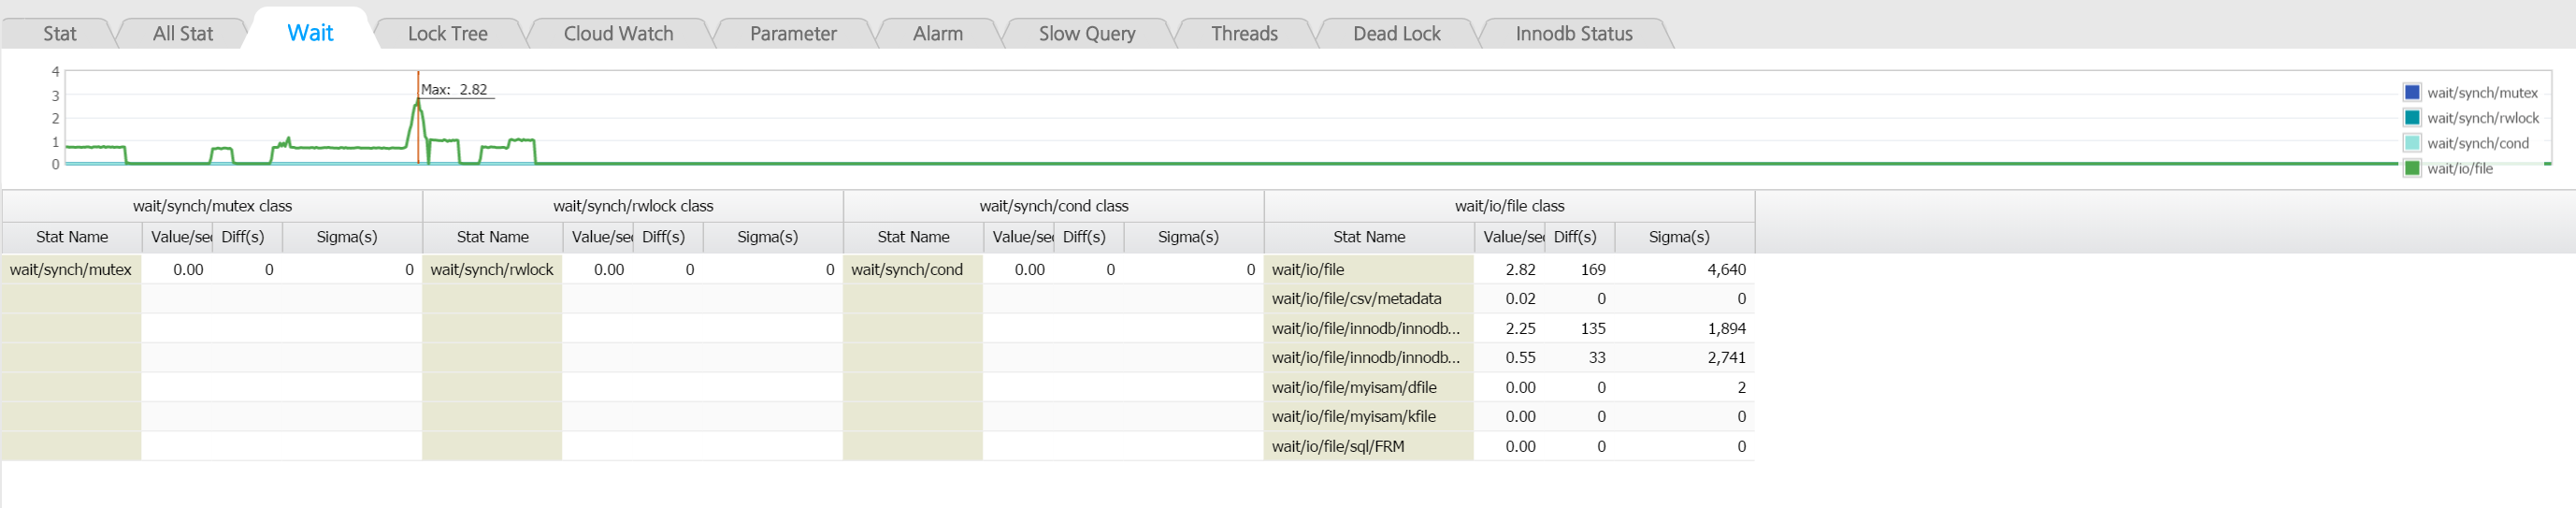
SUB) Wait
Provides all the wait information provided in MySQL.
Back To Top
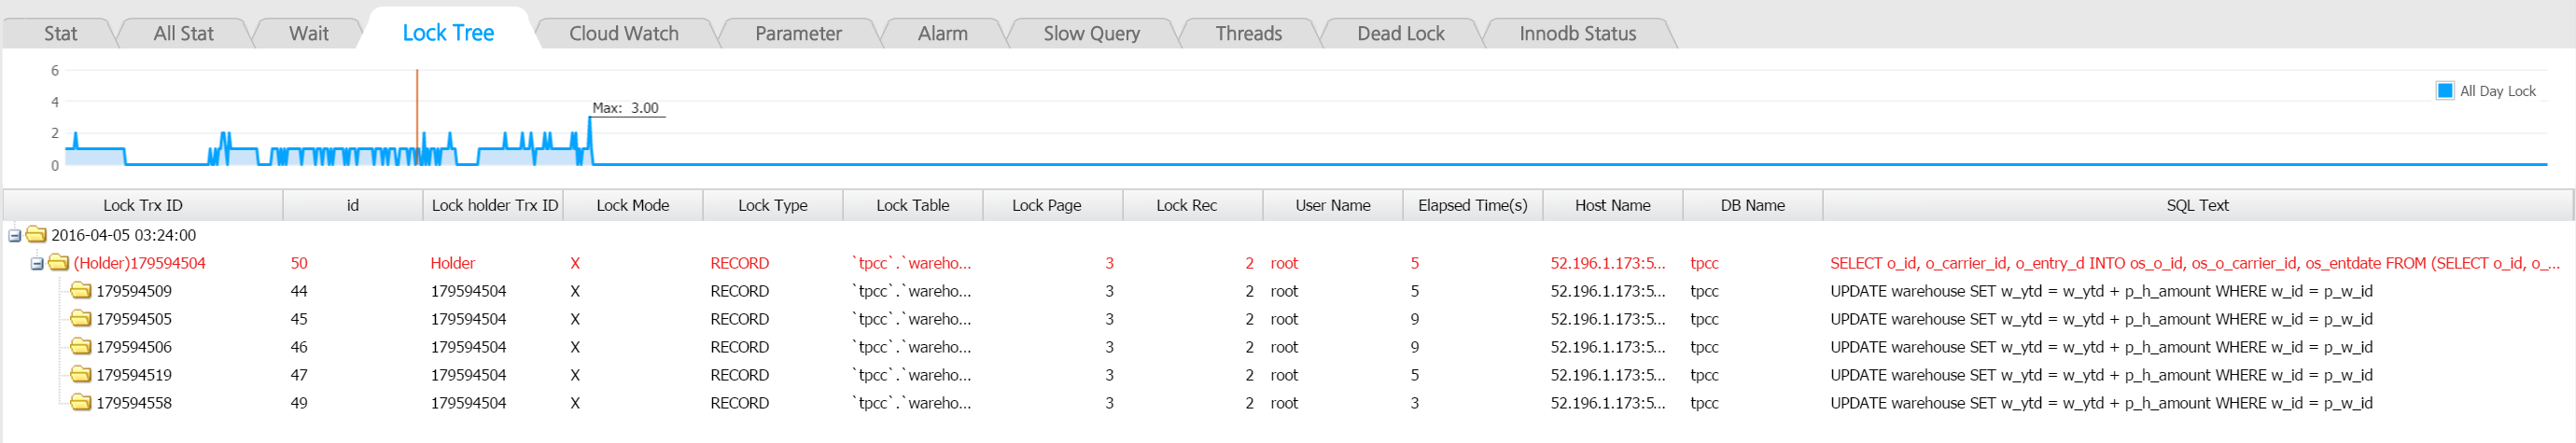
SUB) Lock Tree
The Lock Tree screen displays the relationship between the Lock Holder sessions and the Waiter sessions in a tree format, and provides the Mode, SQL Text, and Wait Time information. This screen is configured the same as the Real-Time Lock Tree screen.
Back To Top
SUB) CloudWatch
Provides metrics information provided in CloudWatch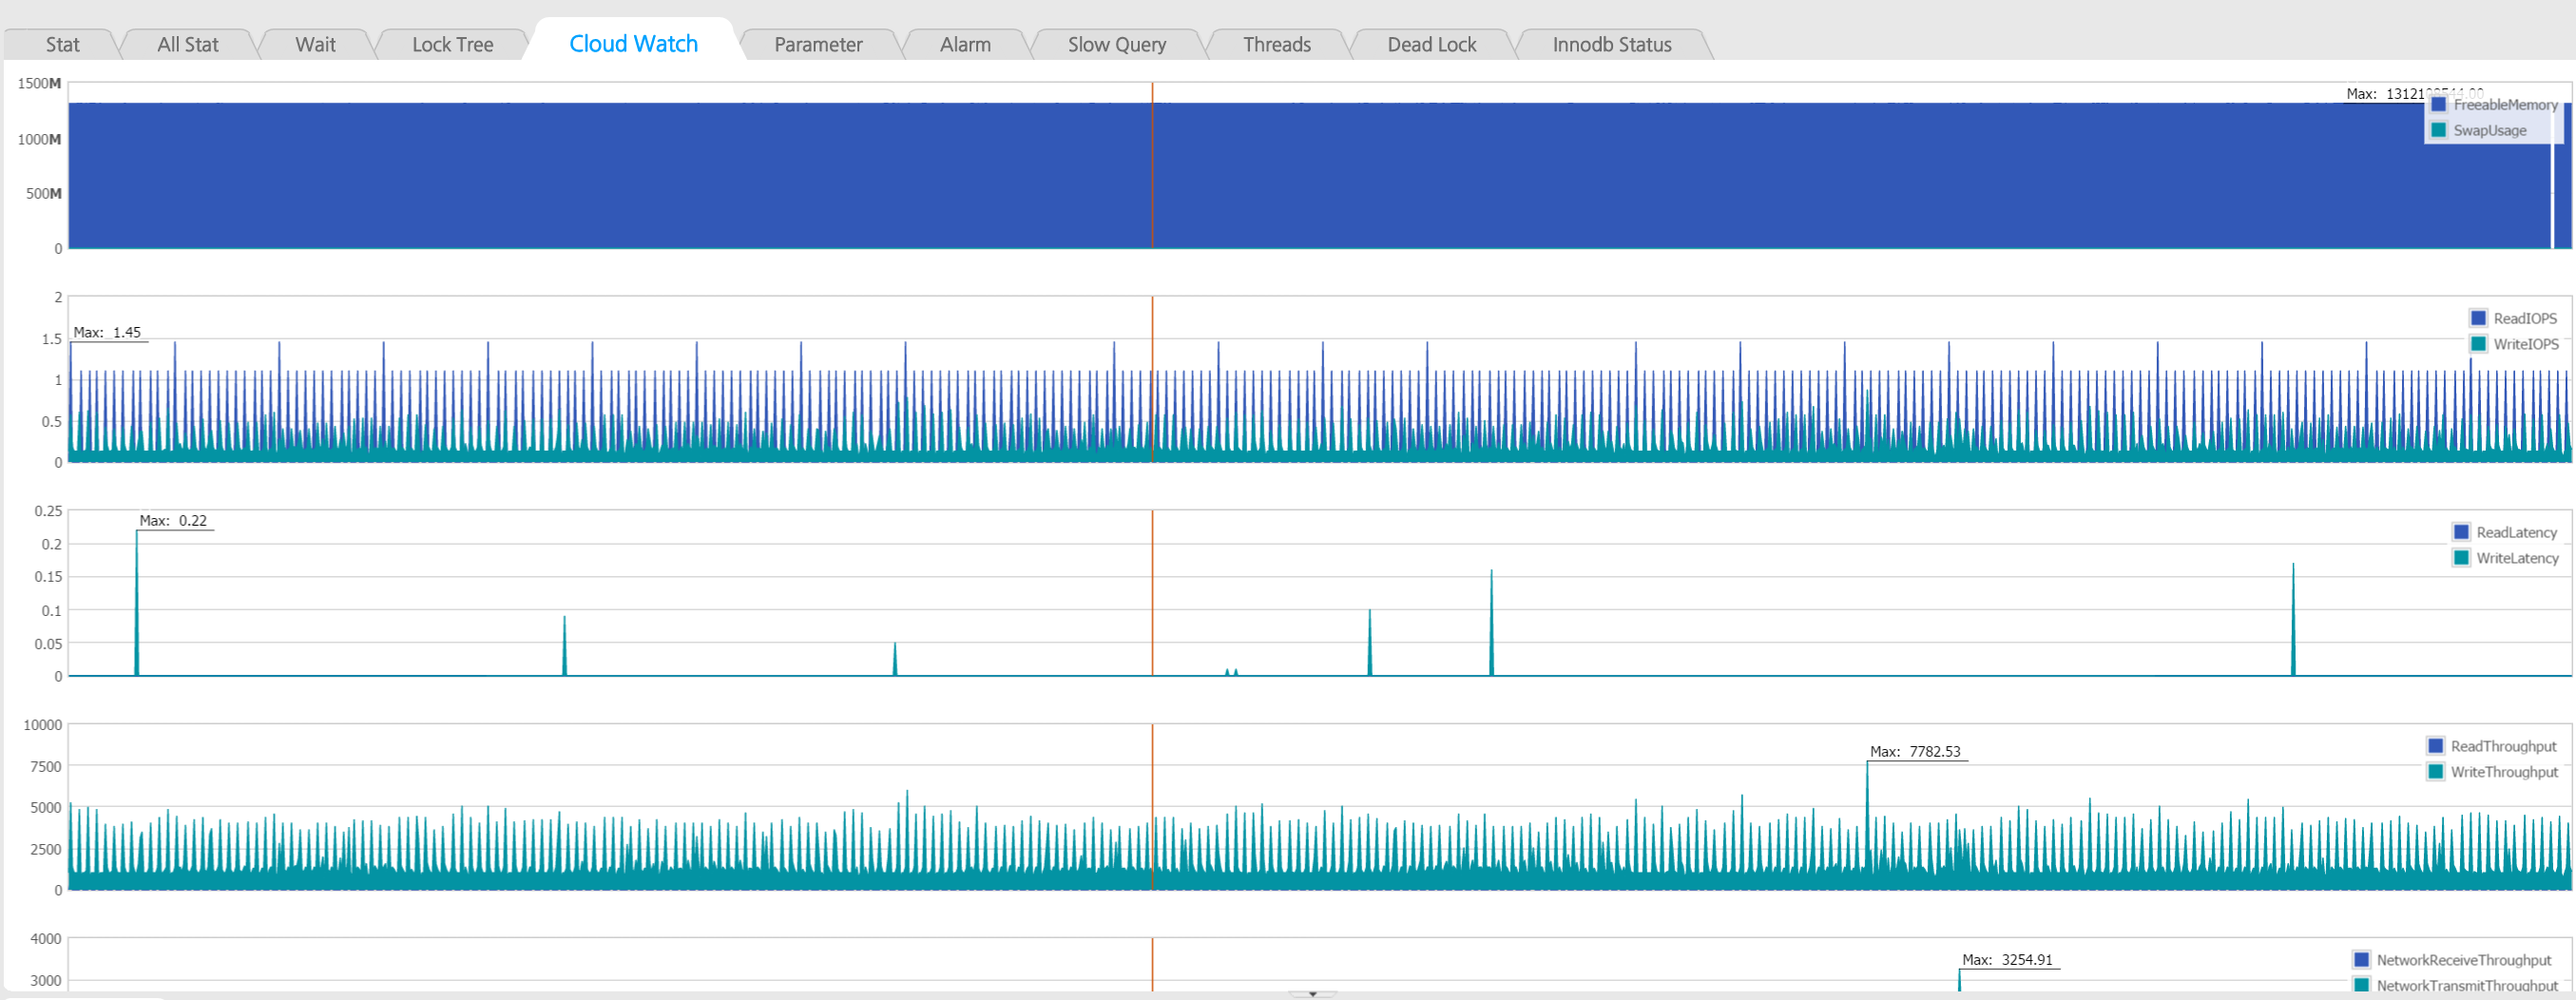
Back To Top
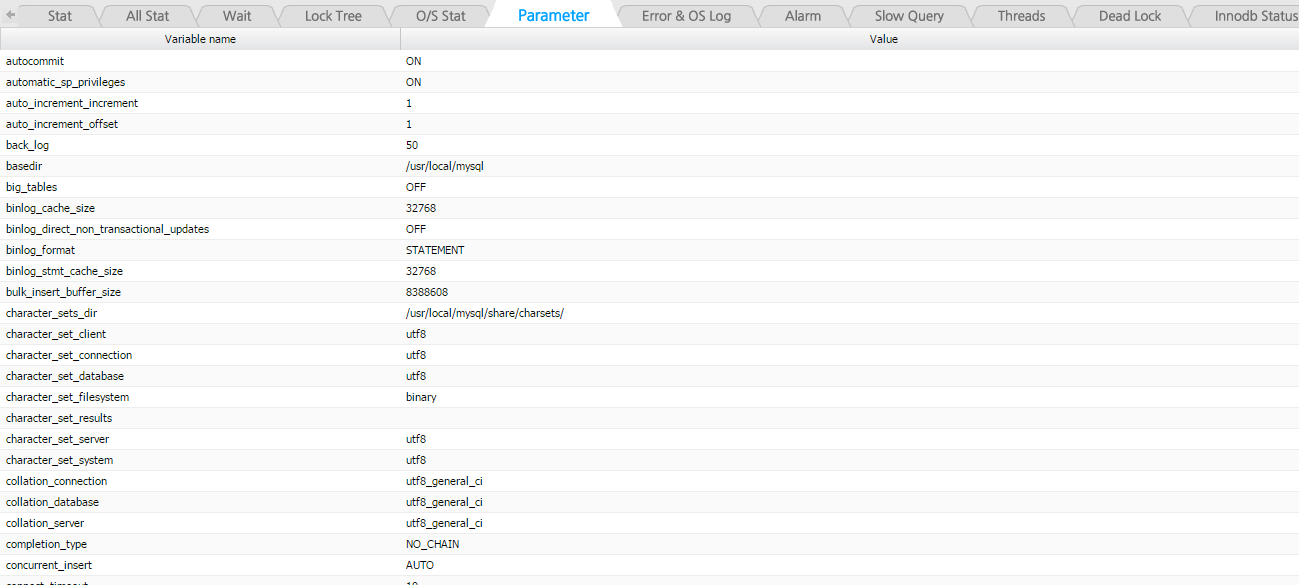
SUB) Parameter
Provides parameter information. Parameter information is logged once a day.
Back To Top
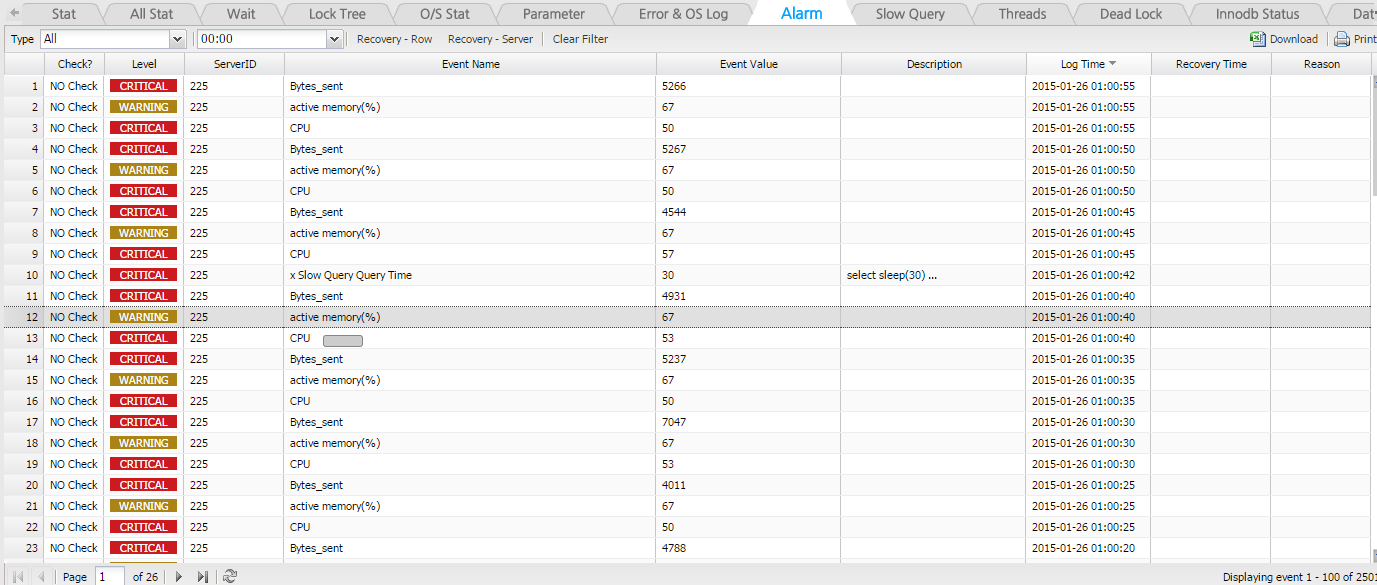
SUB) Alarm
In the event alarms are generated for the indicators for which threshold values have been set up in the Admin’s Alarm Setup, the alarm details of the corresponding time will be logged. You can check the alarm time and details through the Performance Analyzer.
1. When you find red (or yellow) points on the graph, it means that alerts have been generated for the corresponding time according to the threshold values set by the user.

2. Click on the corresponding time and go to the Alarm Tab and you will find the details of alarms generated as shown below.
Back To Top
SUB) Slow Query
Provides the Slow Query information. Displays the slow queries within the 1 minute of the time period searched with an X symbol. You can select a specific segment with a mouse drag and navigate to its details to use the Plan and Thread Tracking function.
( X-View : Slow query 1minute Data )
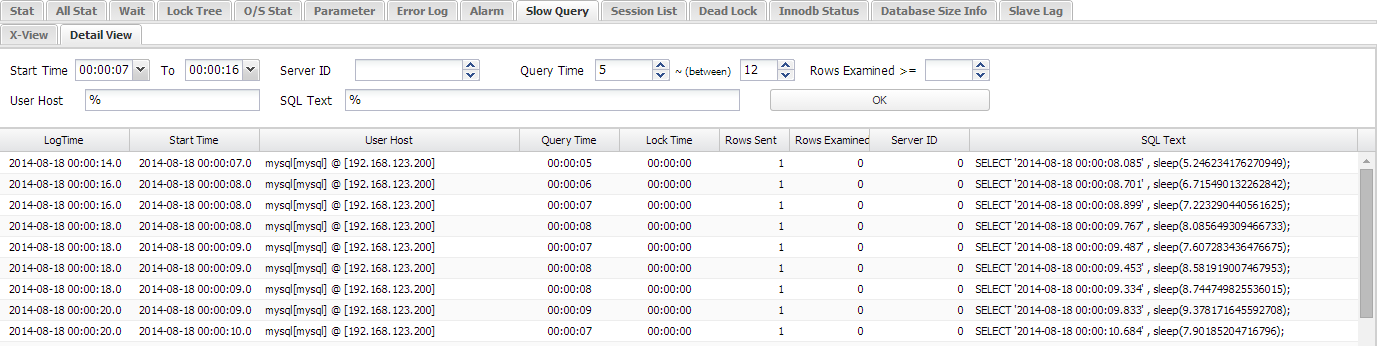
Details View Screen
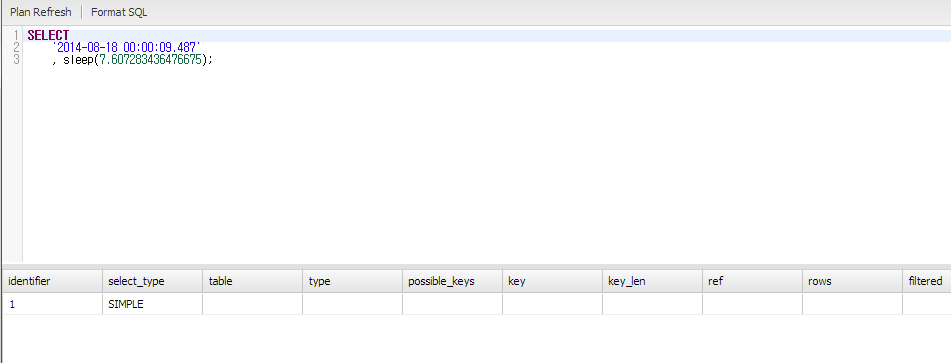
( Double-Click to see Real-Time Plan View )
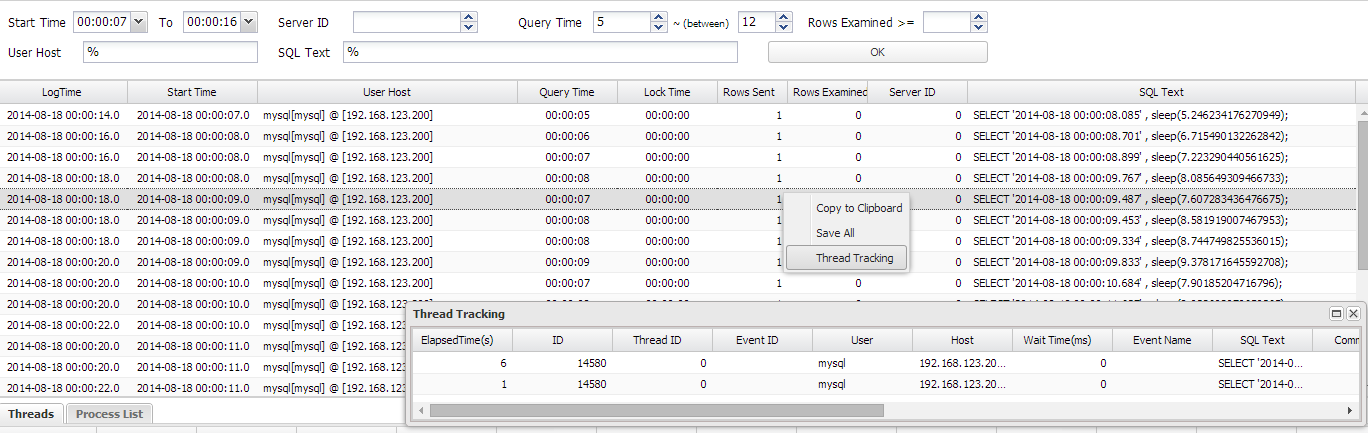
( Thread Tracking function on the Mouse Right-Click Menu 가능 )
Back To Top
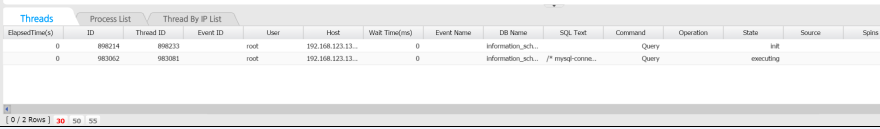
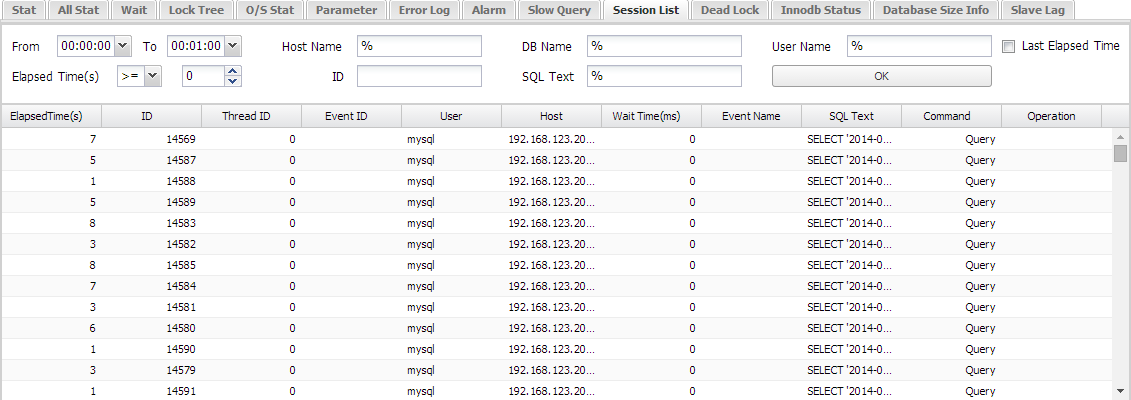
SUB) Threads
This function allows the user to enter specific time period and conditions to search the corresponding session information from the logged Threads list.
If you check the Last Elapsed Time condition, you can search for the SQL’s Last Query Time executed by the same thread.
Back To Top
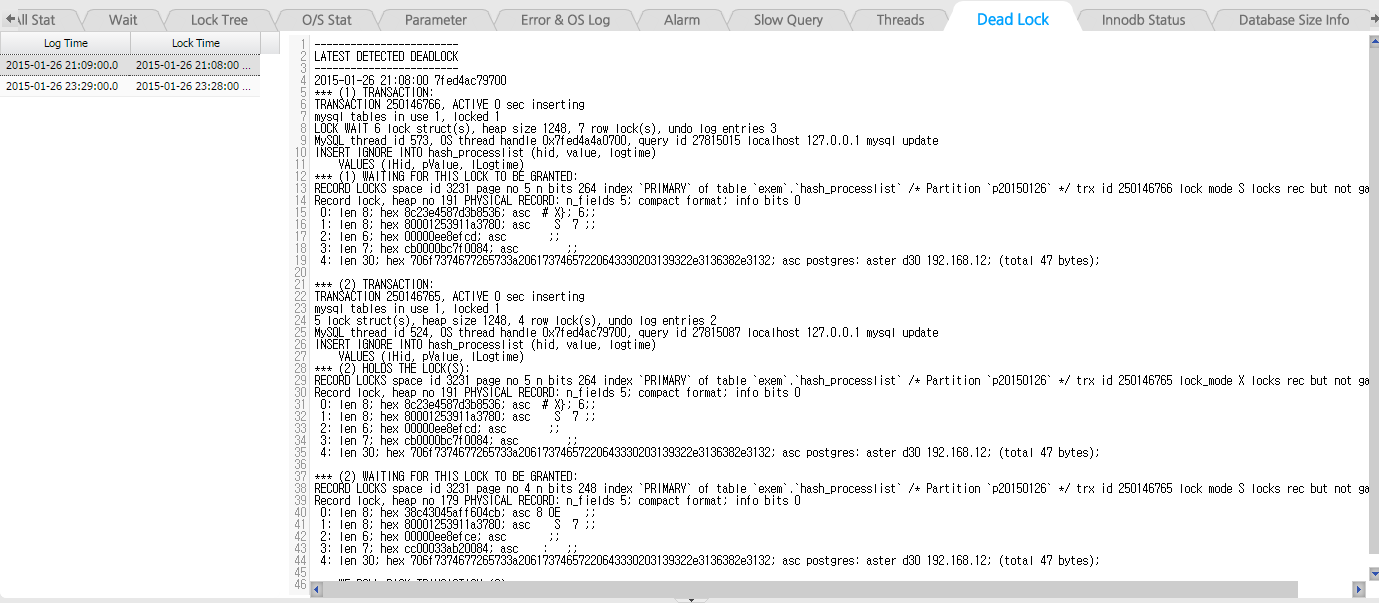
SUB) Deadlock
This function allows you to check the DEADLOCK details. Logging occurs if any changes occur for every 1 minute.
Back To Top
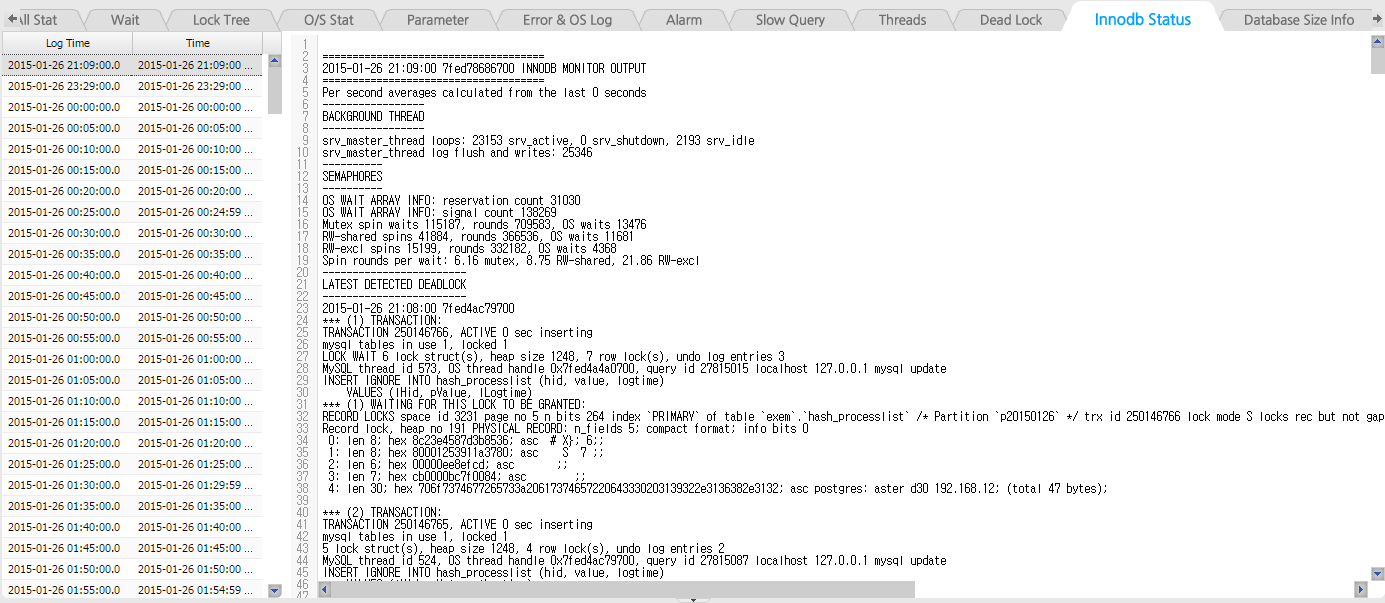
SUB) Innodb Status
This function allows you to check the Innodb Status information. The data is logged every 5 minute.
Back To Top
|