
Top-N Analysis
SUB) Overview
Provides a function for a long-term Top-N statistics analysis. Provides Top-N data based on the following criteria — Execution Time, CPU Time, Logical reads, Physical Reads, and Executions – for the following 6 Categories (Schema, Program, Module, Machine, OS User, and SQL).
SUB) Top-N Analysis Data
The purpose of Top-N Analysis is to provide a quick performance analysis. The Top-N hourly data is used for Top-N Analysis and the Top-N hourly data criteria are as follows.
- Top-100 SQL based on Elapsed Time
- Top-100 SQL based on CPU Time
- Top-100 SQL based on Logical IO
- Top-100 SQL based on Physical IO
- Top-100 SQL based on Execution
SUB) Window Configuration
The window configuration is as follows
| Tab Name | Description |
| Schema | Provides information of SQLs executed in the Top-N Schema and in each Schema. |
| Program | Provides information of SQLs executed in the Top-N Program and in each Program. |
| Module | Provides information of SQLs executed in the Top-N Module and in each Module. |
| Machine | Provides information of SQLs executed in the Top-N Machine and in each Machine. |
| OS User | Provides information of SQLs executed in the Top-N OS User and in each OS User. |
| SQL | Provides the Top-N SQL information. |
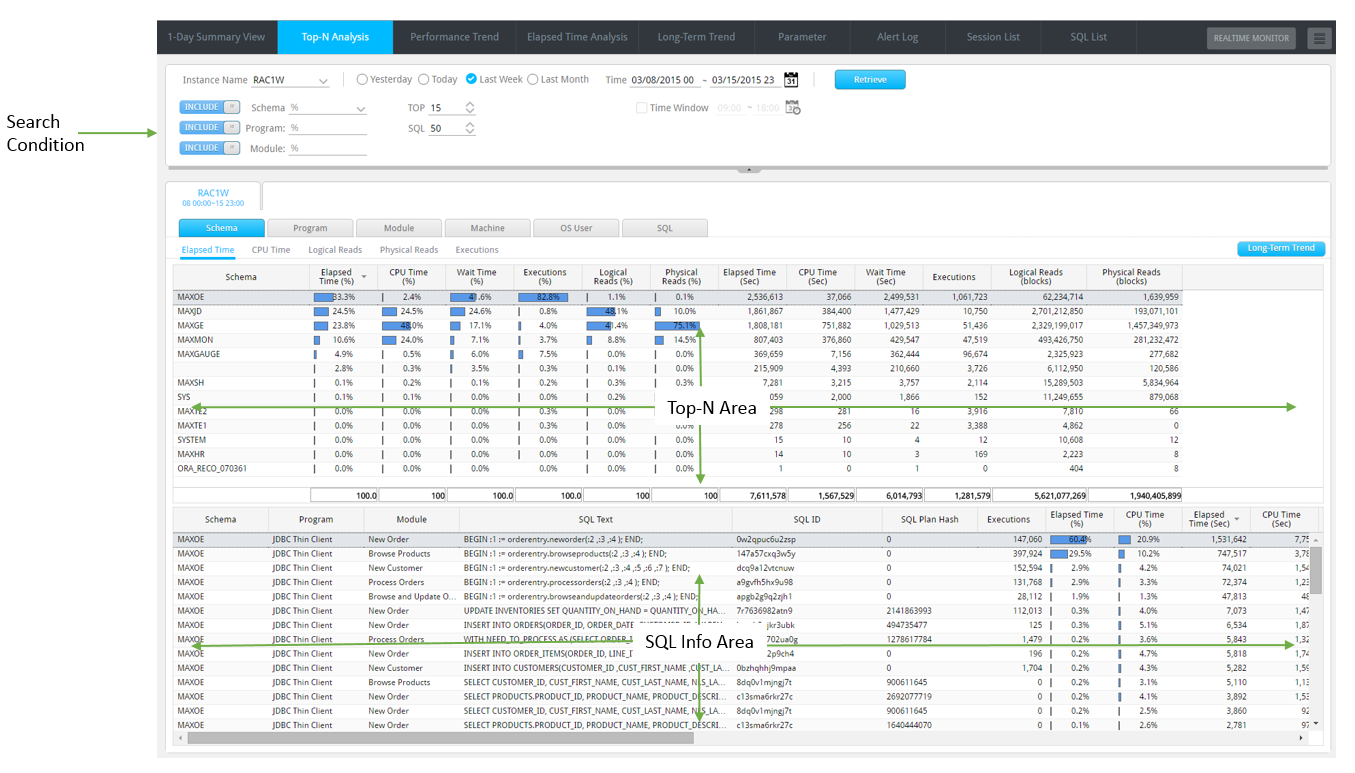
SUB) Search Condition
| Search Condition | Description |
| |
Selects the target instance for analysis. For selection convenience, the autocomplete function is available. |
| |
Sets the analysis period for the last 1 week. |
| |
Sets the analysis period for the last 1 month. |
| |
Sets the analysis date for yesterday. (Default Value) |
| |
Sets the analysis date for today. |
| |
You can either enter the analysis date, or select the date from the calendar UI. |
|
|
Include / Exclude Toggle Button
|
| |
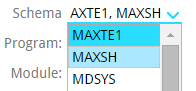
Select Shema using the Combo box. You can choose 2 or more Schemas by clicking the items in the Combo Box.
|
 |
Enter the target Program Name and Module Name for analysis (or for exclusion). The input rules are as follows.
For example, if you want to search the programs whose Program Name is “JDBC Thin Client”, “SQL Plus”, then enter the keywords as “thin,sql”. |
| |
Sets the number of Top-N provided in the Top Schema / Program / Module / Machine / OS User Tabs.
|
| |
Sets the number of Top-N provided in the Top SQL Tab.
|
| |
Sets the target time window for analysis. This may be used to analyze the Top-N information executed during the operation hours (example: 9~18 hours), or to analyze the Top-N information executed in the Batch Window. |
SUB) Tabs and Grouping Criteria in Top-N analysis
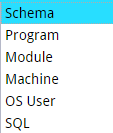
Based on the grouping criteria for the SQL performance information, the following 6 tabs are provided.
| Tab Name | Grouping Criteria |
| Schema | The SQL performance information is grouped according to Schema Name. |
| Program | The SQL performance information is grouped according to Program Name. |
| Module | The SQL performance information is grouped according to Module Name. |
| Machine | The SQL performance information is grouped according to Machine Name. |
| OS User | The SQL performance information is grouped according to OS User Name. |
| SQL | The SQL performance information is grouped according to Oracle SQL ID. |
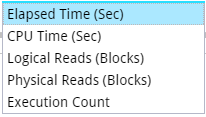
The 6 Tabs provide the following grouping criteria.
- Elapsed Time (Default Set Value)
- CPU Time
- Logical Reads
- Physical Reads
- Executions
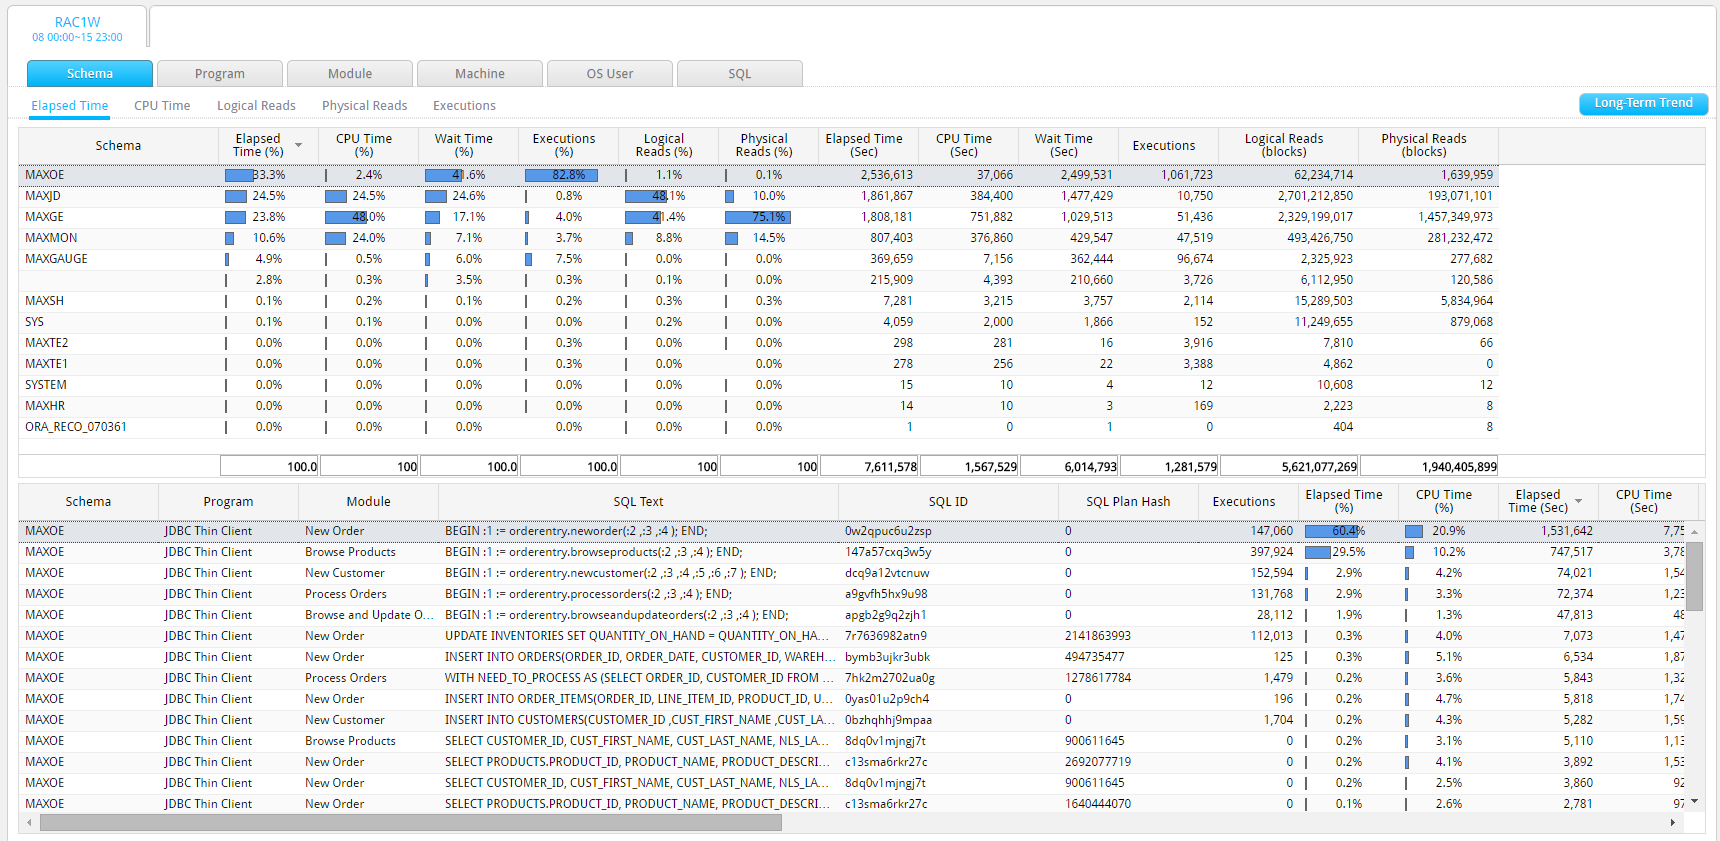
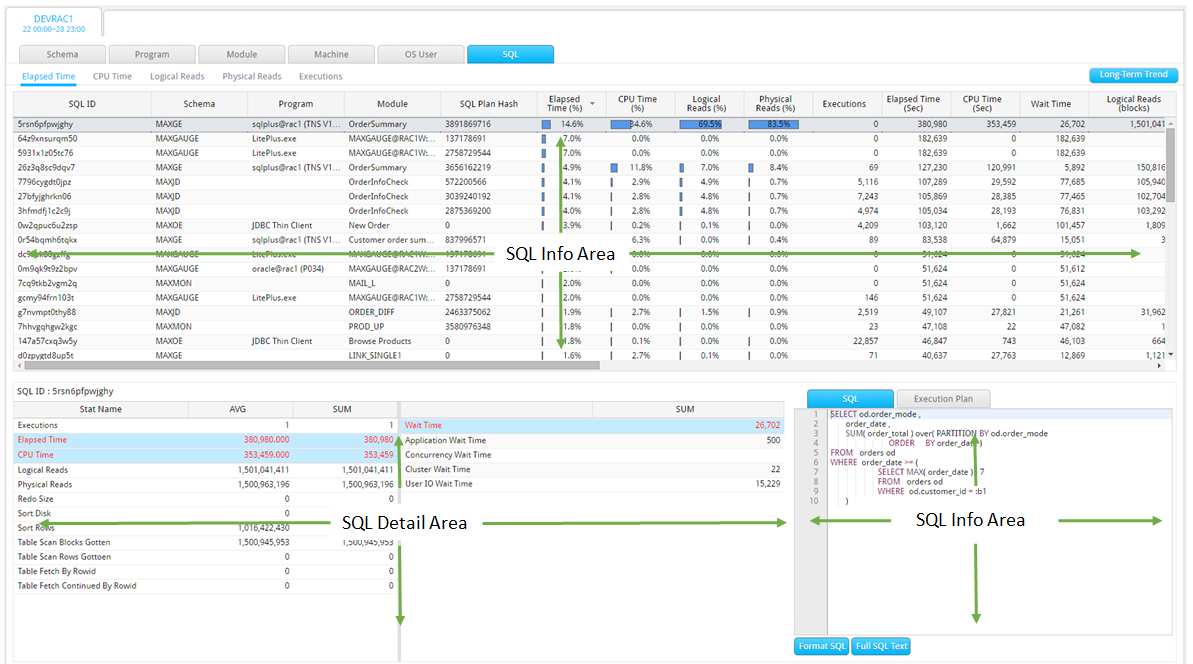
SUB) Schema Tab Explanation
The Schema Tab provides the SQL information grouped according to Schema Name. When you click on the Schema Name in the Top-N Area, the information of SQL executed in the corresponding Schema will be displayed in the SQL Info Area.
Long-Term Trend Connection
By connecting to the Long-Term Trend window, you can check the trends within the analysis period by each date. You can connect to the Long-Term Trend window through the following methods.
| Connection Method | Description |
| |
Click on the Long-Term Trend button.
|
|
|
Select Long-Term Trend item on the mouse right-click menu in the Top-N Area.
|
Top-N Grid Column
| Column Name | Description |
| Schema | Schema Name |
| Elapsed Time (%) | The ratio of the corresponding Schema out of the total Elapsed Time of all the SQLs executed within the analysis period. |
| CPU Time (%) | The ratio of the corresponding Schema out of the total CPU Time of all the SQLs executed within the analysis period. |
| Wait Time (%) | The ratio of the corresponding Schema out of the total Wait Time of all the SQLs executed within the analysis period. |
| Executions (%) | The ratio of the corresponding Schema out of the total Executions of all the SQLs executed within the analysis period. |
| Logical Reads (%) | The ratio of the corresponding Schema out of the total Logical IO of all the SQLs executed within the analysis period. |
| Physical Reads (%) | The ratio of the corresponding Schema out of the total Physical IO of all the SQLs executed within the analysis period. |
| Elapsed Time (Sec) | The Elapsed Time of SQLs executed by the corresponding Schema within the analysis period. (Sum) |
| CPU Time (Sec) | The CPU Time of SQLs executed by the corresponding Schema within the analysis period. (Sum) |
| Wait Time (Sec) | The Wait Time of SQLs executed by the corresponding Schema within the analysis period. (Sum) |
| Executions | The Executions of SQLs executed by the corresponding Schema within the analysis period. (Sum) |
| Logical Reads (blocks) | The Logical IO of SQLs executed by the corresponding Schema within the analysis period. (Sum) |
| Physical reads (blocks) | The Physical IO of SQLs executed by the corresponding Schema within the analysis period. (Sum) |
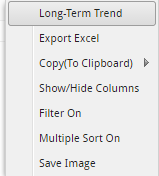
Top-N Grid Mouse Right-Click Menu
The mouse right-click menu is as follows. For more information, please reference “Appendix. Grid Mouse Right-Click Menu UI”.
| Item | Description |
| Long-Term Trend | Connects to Long-Term Trend window.
|
| Export Excel | Downloads the grid content on an excel file. |
| Copy(To Clipboard) | Makes a copy of the grid content. |
| Show/ Hide Columns | Selects the columns to be displayed on the grid. |
| Filter On | Enables the Filtering function. |
| Multiple Sort On | Sorts based on 2 or more column values. |
| Save Image | Saves the grid content as an image. |
SQL info Grid Column
| Column Name | Description |
| Schema | Schema Name |
| Program | Program Name |
| Module | Module Name |
| SQL Text | SQL statement |
| SQL ID | Oracle SQL ID |
| SQL Plan Hash | SQL Plan hash |
| Executions | The number of executions (Sum) |
| Elapsed Time (%) | The ratio of corresponding SQL’s Elapsed Time out of the total Elapsed Time of all the SQLs executed in the selected Top-N items. |
| CPU Time (%) | The ratio of corresponding SQL’s CPU Time out of the total CPU Time of all the SQLs executed in the selected Top-N items. |
| Elapsed Time (Sec) | The corresponding SQL’s Elapsed Time (Sum) |
| Elapsed Time/exec (Sec) | The corresponding SQL’s Elapsed Time (Average Per Execution) |
| CPU Time (Sec) | The corresponding SQL’s CPU Time (Sum) |
| CPU Time/exec (Sec) | The corresponding SQL’s CPU Time (Average Per Execution) |
| Logical Reads (blocks) | The corresponding SQL’s Memory IO (Sum) |
| Physical Reads (blocks) | The corresponding SQL’s Physical IO (Sum) |
| Redo Size (byte) | Redo amount generated upon executing the corresponding SQL (Sum)
Unit: Bytes |
| Sort Disk (count) | The number of times the corresponding SQL has executed the disk sort (Sum) |
| Sort Rows | The number of records the corresponding SQL has performed sorting (Sum) |
| Table Fetch By Rowid (count) | The number of times the corresponding SQL has accessed the table by using the ROWID. (Sum) |
| Table Fetch Continued By Rowid (count) | The number of times the corresponding SQL has accessed 2 or more blocks to fetch one record. (Sum) |
| Table Scan Blocks Gotten (block) | The number of blocks accessed by the corresponding SQL at the time of scan operation (Table Full Scan, Index Full Scan, and Index Fast Full Scan). (Sum) |
| Table Scan Rows Gotten (row) | The number of records accessed by the corresponding SQL at the time of scan operation (Table Full Scan, Index Full Scan, and Index Fast Full Scan) (Sum) |
| Application Wait Time (Sec) | The time waited on the application wait class at the time of corresponding SQL execution. (Sum)
|
| Concurrency Wait Time (Sec) | The time waited on the Concurrency wait class at the time of corresponding SQL execution. (Sum)
|
| Cluster Wait Time (Sec) | The time waited on the Cluster wait class at the time of corresponding SQL execution. (Sum)
|
| User IO Wait Time (Sec) | The time waited on the User IO wait class at the time of corresponding SQL execution. (Sum)
|
SQL Info Grid Mouse Right-Click Menu
The mouse right-click menu is as follows. For more information, please reference “Appendix. Grid Mouse Right-Click Menu UI”.
| Item | Description |
| Full SQL Text | Provides SQL Full Text. |
| Long-Term Trend | Connects to Long-Term Trend window for the corresponding SQL.
|
| Export Excel | Downloads the grid content on an excel file. |
| Copy(To Clipboard) | Makes a copy of the grid content. |
| Show/ Hide Columns | Selects the columns to be displayed on the grid. |
| Filter On | Enables the Filtering function. |
| Multiple Sort On | Sorts based on 2 or more column values. |
| Save Image | Saves the grid content as an image. |
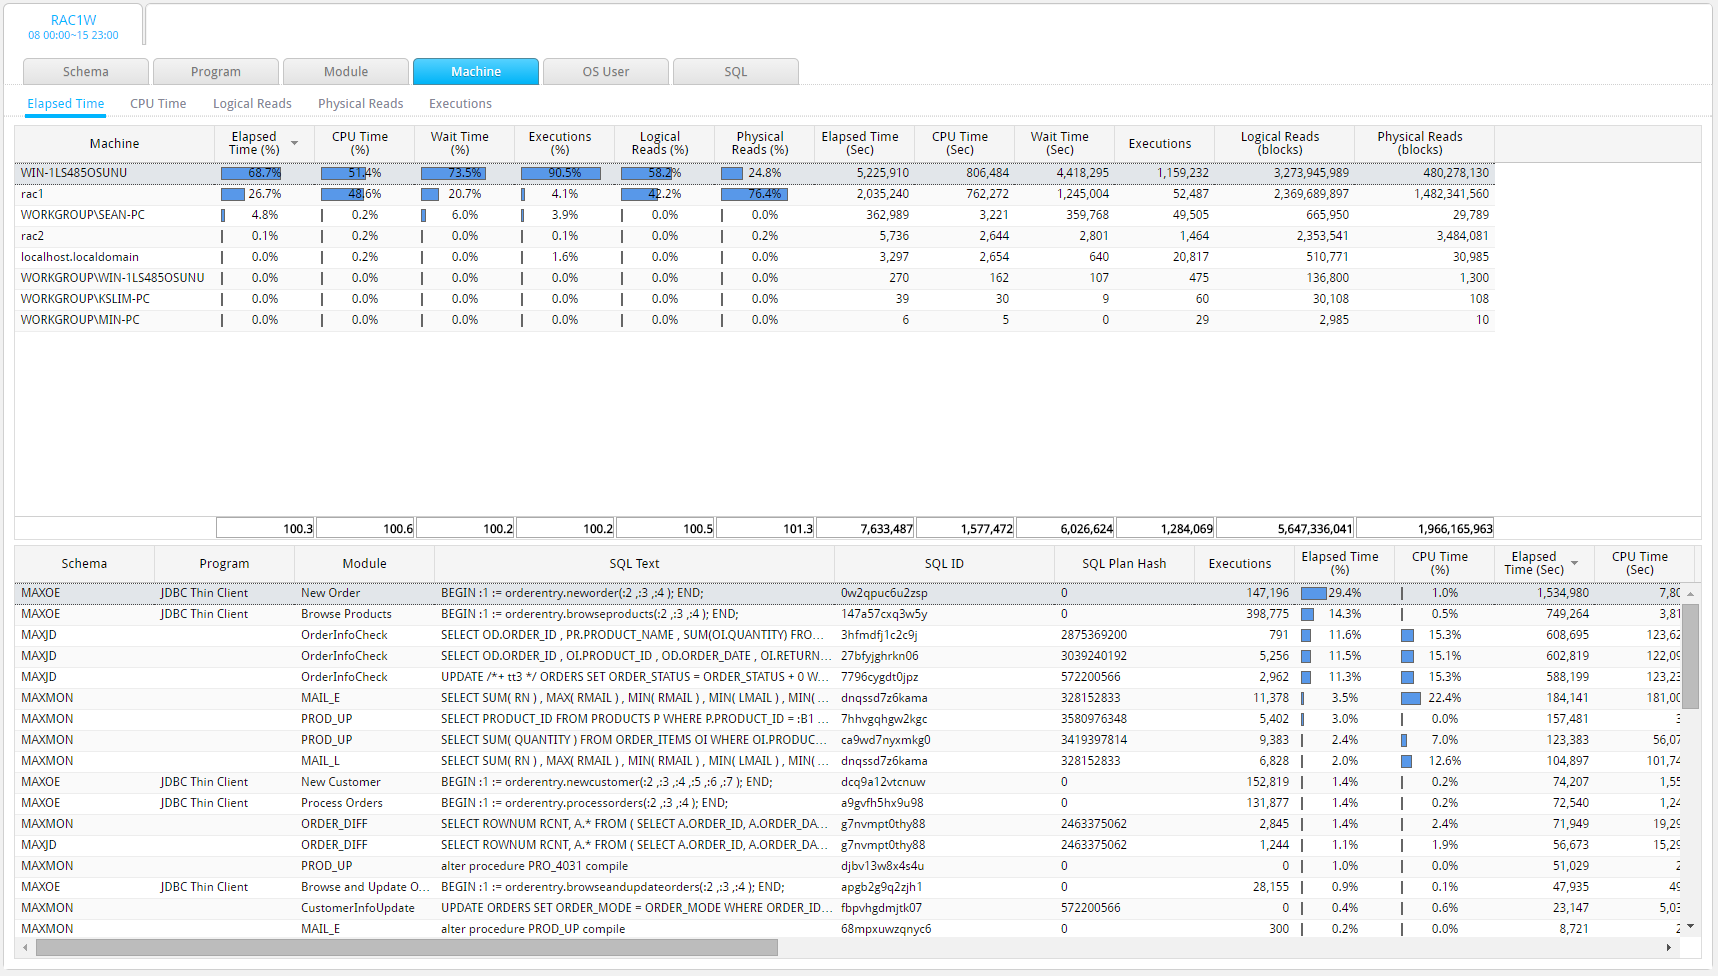
SUB) Program Tab Explanation
The Program Tab provides the SQL performance information grouped according to the Program Name. When you click on the Program Name in the Top-N Area, the information of SQL executed in the corresponding Program will be displayed in the SQL Info Area.
Long-Term Trend Connection
Except the fact that you are connecting to Program instead of Schema, it operates in the same way as the Schema Tab.
Top-N Grid Column
Except the Program Column, the other remaining columns are the same as the Schema Tab.
Top-N Grid Mouse Right-Click Menu
Same as the Schema Tab.
SQL info Grid Column
Same as the Schema Tab.
SQL Info Grid Mouse Right-Click Menu
Same as the Schema Tab.
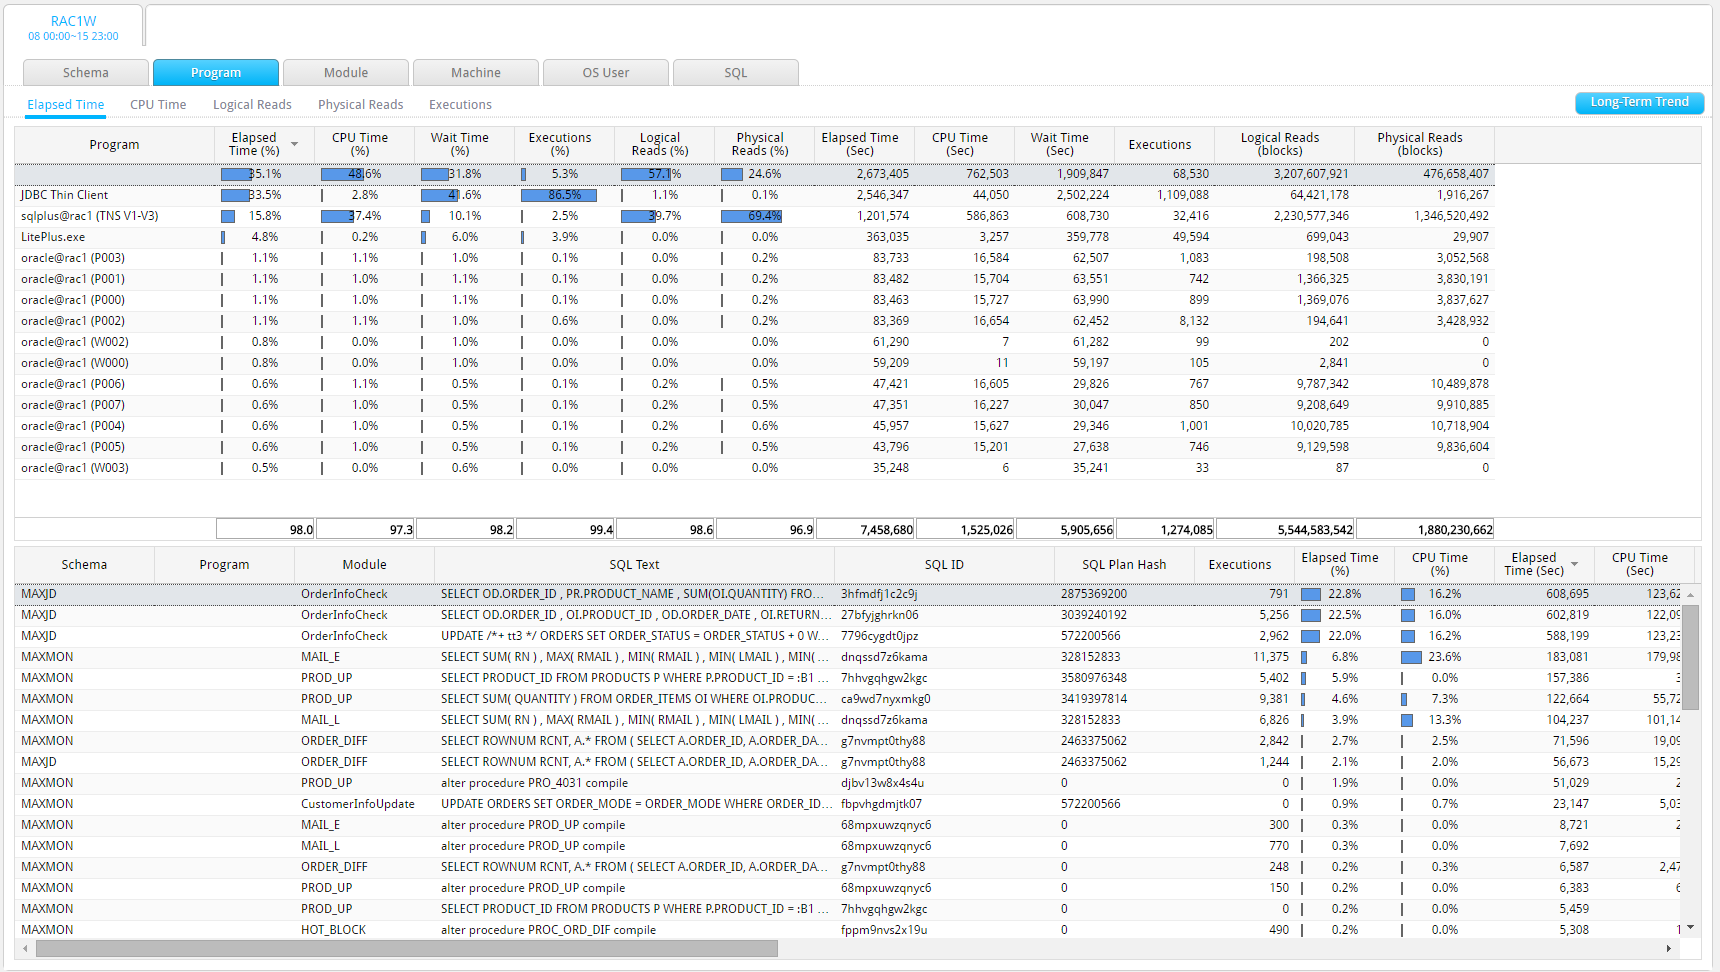
SUB) Module Tab Explanation
The Module Tab provides the SQL performance information grouped according to Module Name. When you click on the Module Name in the Top-N Area, the information of SQL executed in the corresponding Module will be displayed in the SQL Info Area.
Long-Term Trend Connection
Except the fact that you are connecting to Module instead of Schema, it operates in the same way as the Schema Tab.
Top-N Grid Column
Except the Program Column, the other remaining columns are the same as the Schema Tab.
Top-N Grid Mouse Right-Click Menu
Same as the Schema Tab.
SQL info Grid Column
Same as the Schema Tab.
SQL Info Grid Mouse Right-Click Menu
Same as the Schema Tab.
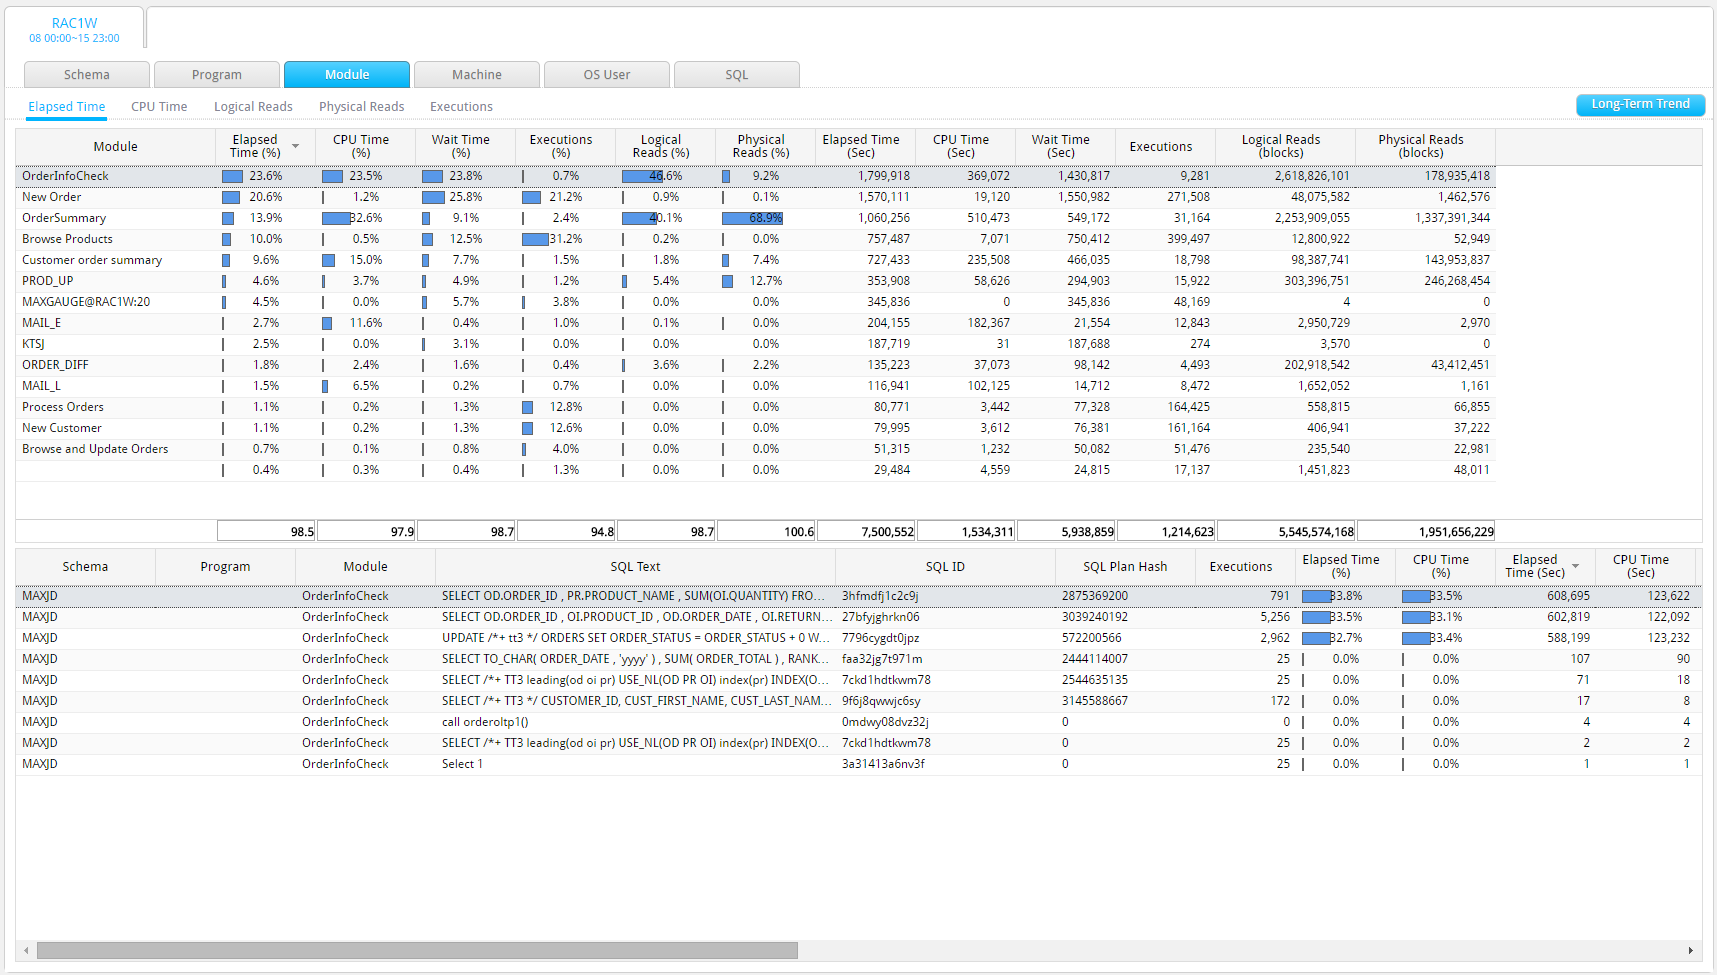
SUB) Machine Tab Explanation
The Machine Tab provides the SQL performance information grouped according to the Machine Name. When you click on the Machine Name in the Top-N Area, the information of SQL executed in the corresponding Machine will be displayed in the SQL Info Area.
Long-Term Trend Connection
Does not support Long-Term Trend connection.
Top-N Grid Column
Except the Machine Column, the other remaining columns are the same as the Schema Tab.
Top-N Grid Mouse Right-Click Menu
Out of all the items in the Schema Tab, the “Long-Term Trend” item is excluded in this tab.
SQL info Grid Column
Same as the Schema Tab.
SQL Info Grid Mouse Right-Click Menu
Same as the Schema Tab.
SUB) OS User Tab Explanation
The OS User Tab provides the SQL performance information grouped according to the OS User Name. When you click on the OS User Name in the Top-N Area, the information of SQL executed in the corresponding OS User will be displayed in the SQL Info Area.
Long-Term Trend Connection
Does not support Long-Term Trend connection.
Top-N Grid Column
Except the Machine Column, the other remaining columns are the same as the Schema Tab.
Top-N Grid Mouse Right-Click Menu
Out of all the items in the Schema Tab, the “Long-Term Trend” item is excluded in this tab.
SQL info Grid Column
Same as the Schema Tab.
SQL Info Grid Mouse Right-Click Menu
Same as the Schema Tab.
SUB) SQL Tab Explanation
The SQL Tab provides the SQL performance information grouped according to the Oracle SQL ID.
Long-Term Trend Connection
Except the fact that you are connecting to Oracle SQL ID instead of Schema, it operates in the same way as the Schema Tab.
Top-N Grid Column
Top-N Area is not available in this tab; only the SQL Info Area is provided.
SQL info Grid Column
Same as the Schema Tab.
SQL Info Grid Mouse Right-Click Menu
Same as the Schema Tab.
SQL Detail Area
Provides individual SQL information. Provides workload information (SUM, Average Per 1 Execution) and the elapsed time information (elapsed time and wait time by wait class) of the SQL clicked on in the SQL Info Grid.
SQL Info
Provides the corresponding SQL Text and the Exeuction Plan information.
Elapsed Time Analysis
SUB) Overview
Provides a function for SQL Elapsed Time Analysis. The main functions are as follows.
- Summary Trend Tab : Provides Top-Down method’s SQL Elapsed Time Analysis function for the following 6 categories: Schema, Program, Module, Machine, OS User, and SQL.
- Elapsed Time Scatter : Provides SQL execution distribution chart and Elapsed Time Analysis by each individual SQL function, by providing individual SQL’s Elapsed Time in a scatter chart format.
SUB) Summary Trend Tab Explanation
Window Configuration
The window configuration is as follows.
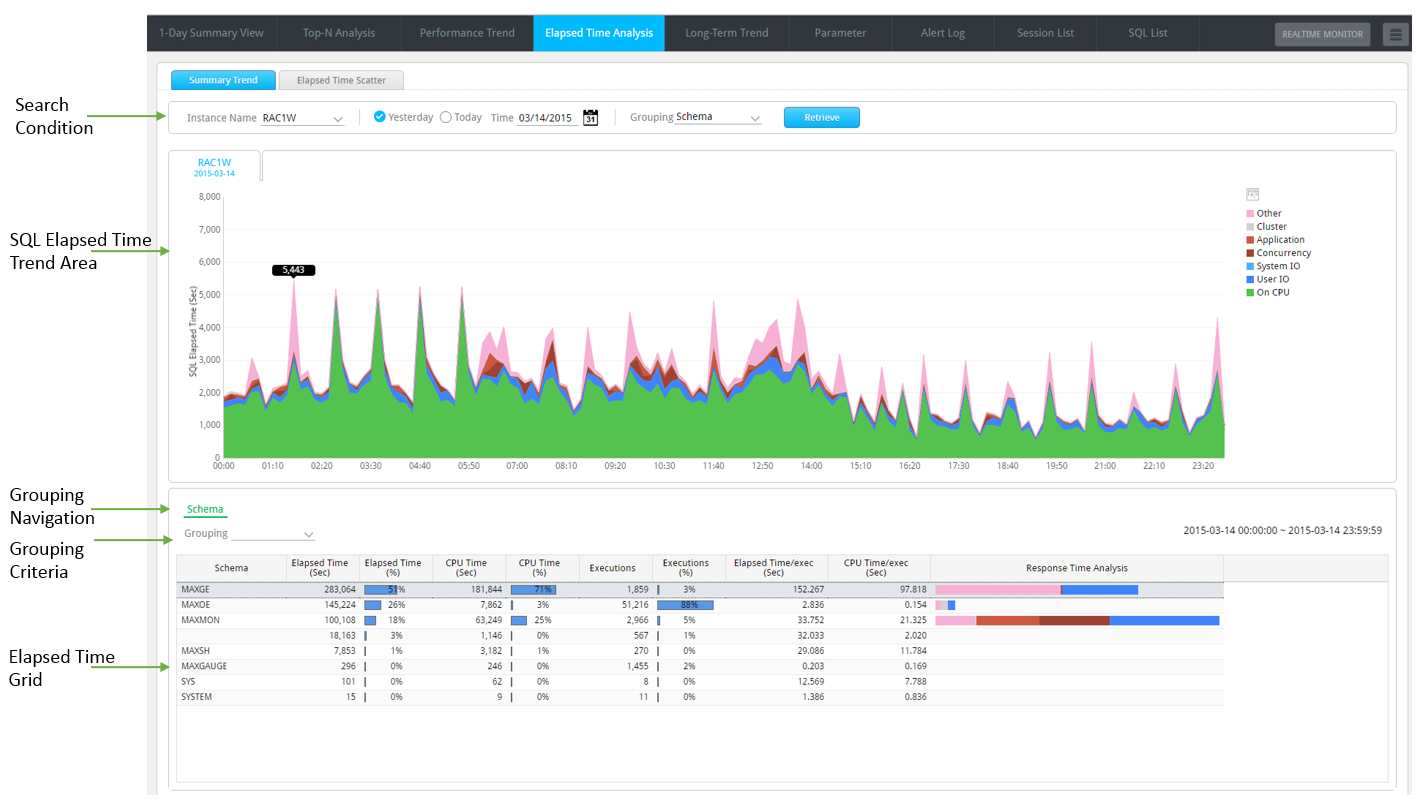
Search Condition
| Search Condition | Description |
| |
Selects the target instance for analysis. For searching convenience, autocomplete function is available. |
| |
Sets the analysis date for yesterday. (Default Value) |
| |
Sets the analysis date for today. |
| |
You can either enter the analysis date, or select the date from the calendar UI. |
| |
Select the 1st grouping criteria. There are 6 options available.
|
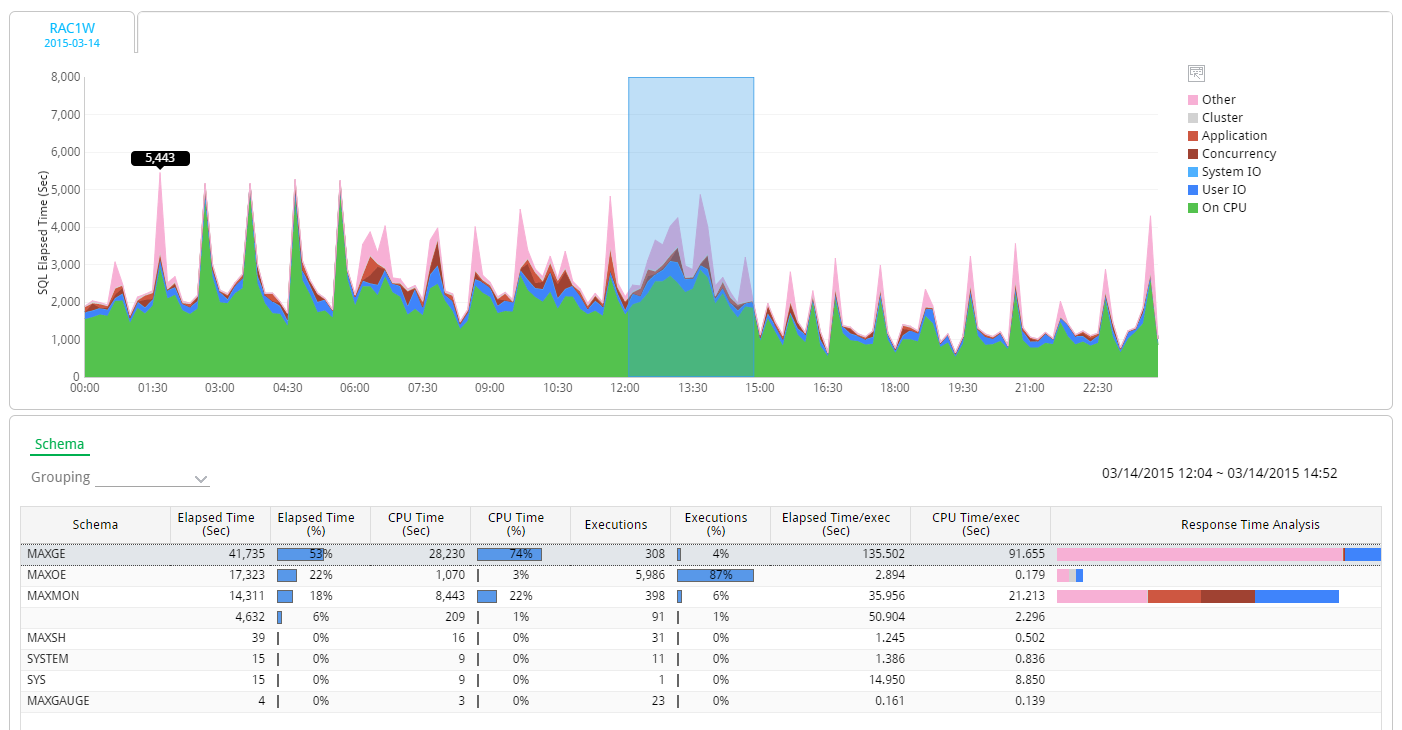
SQL Elapsed Time Trend Area
Provides the SQL Elapsed Time by each wait class (and CPU Time).
Note. The 10 minute Summary information is used.
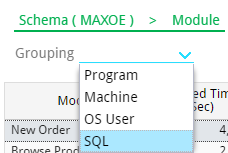
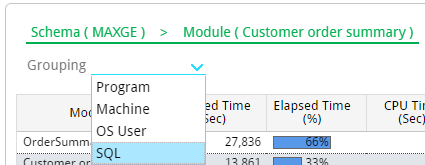
Grouping Criteria
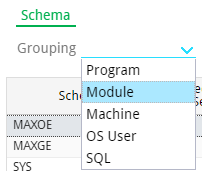
Select the next grouping criteria.
Note. The grouping of the 6 categories could be in any order.
Grouping Navigation
Provides the grouping order, and allows you to jump from the previous step to the next desired step.
Analysis Period Setting Method
1. Using your mose, drag and select the peak period in the SQL Elapsed Time Trend Area.
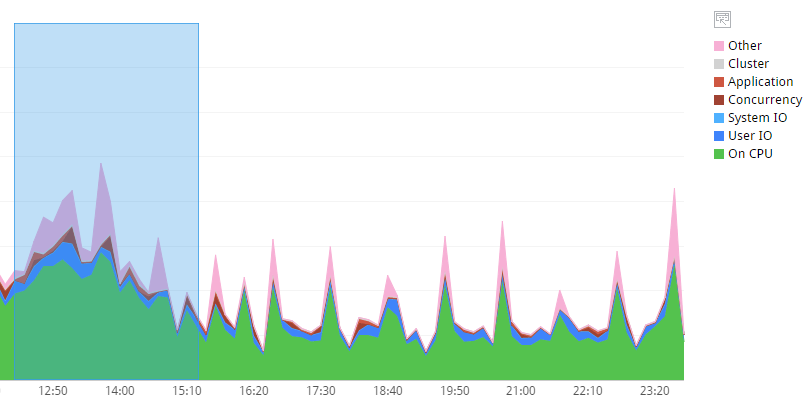
2. You can reset the analysis period in the Time Slice window as shown below or click the “OK” button.
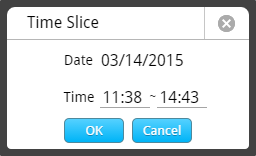
3. At the bottom of the grid, the corresponding period information will be displayed.
Top-Down Analysis Method
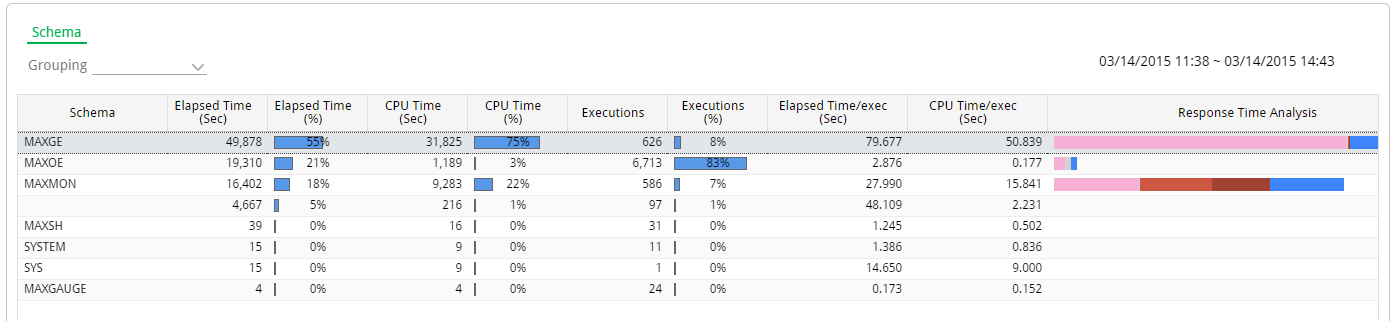
1. Once the analysis period is set by using the mouse-drag or the Time Slice window, the following screen will appear. In the following example, Schema has been selected as the 1st grouping criteria.
2. Select the 2nd criteria on the Grouping Criteria. For example, if you select Module as the 2nd grouping criteria, the screen will be changed to as follows.
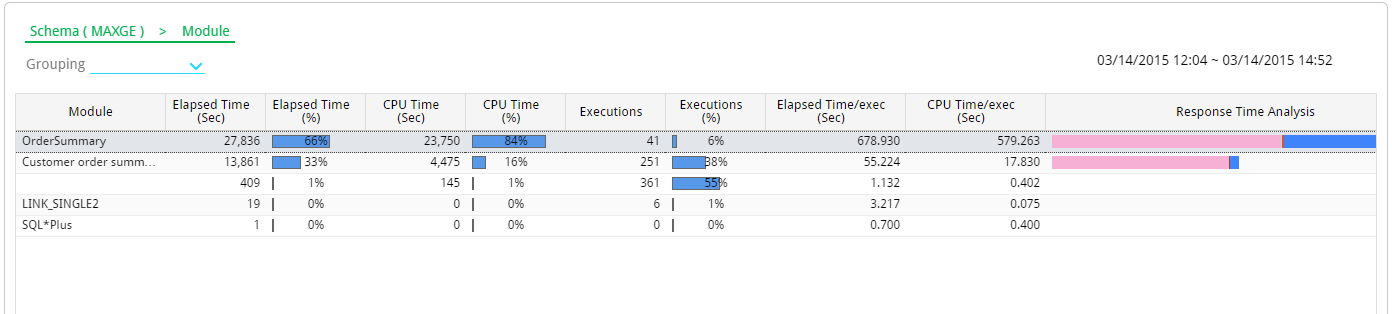
- Grouping Navigation : Schema (Selected Schema Name) > Changes to Module.
- Elapsed Time Grid : Displays the Module information executed by the corresponding Schema.
3. Following the steps above, you can choose up to 5th grouping critera. For example, if you select SQL as the 3rd grouping criteria, the screen will be changed to as follows.
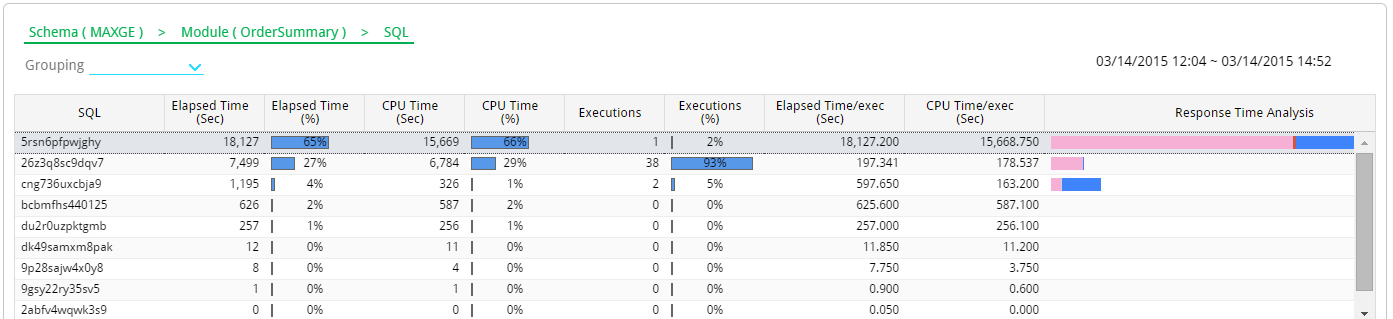
- Grouping Navigation : Schema(Selected Schema Name) > Module (Selected Module Name) > Changes to SQL .
- Elapsed Time Grid : Displays the SQL information executed by the corresponding Module of the corresponding Schema.
4. If you want to analyze a different Module of the corresponding Schema, click on the Module.
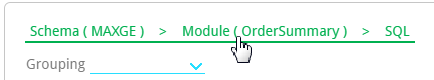
5. Once you select the desired Module and then select the grouping criteria, you can see the results as follows.
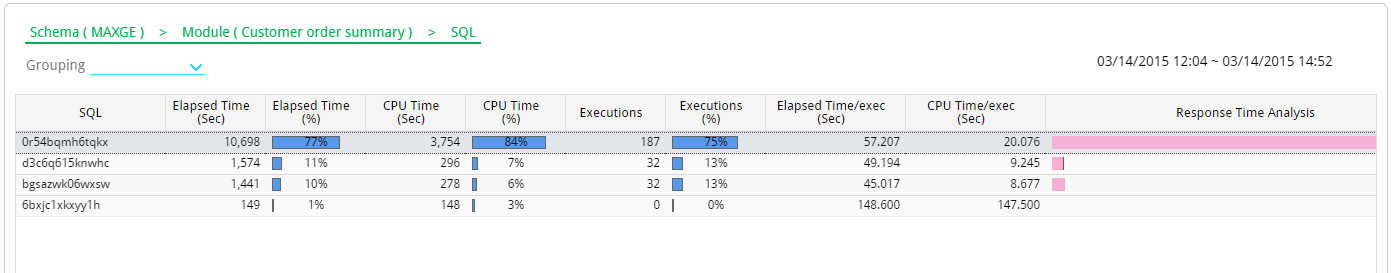
Elapsed Time Grid Column
| Column Name | Description |
| Grouping Criteria Name | Grouping Criteria Name |
| Elapsed Time (Sec) | The corresponding item’s SQL Elapsed Time (Sum) |
| Elapsed Time (%) | The ratio of corresponding item’s SQL Elapsed Time
|
| Executions | The number of corresponding item’s SQL Text Executions (Sum) |
| Executions (%) | The ratio of the corresponding item’s SQL execution count |
| Elapsed Time/exec (Sec) | The corresponding item’s SQL Elapsed Time (Average Per Execution) |
| Response Time Analysis | The corresponding item’s SQL Elapsed Time is distinguished by CPU Time and Wait Class Name Wait Time. |
Elapsed Time Grid Mouse Right-Click Menu
The mouse right-click menu is as follows. For more information, please reference “Appendix. Grid Mouse Right-Click Menu UI”.
| Item | Description |
| SQL Detail | Provides the details of SQL execution history. (Only available for SQL Grouping)
|
| Full SQL Text | Provides SQL Full Text. (Only available for SQL Grouping) |
| Long-Term Trend | Connects to Long-Term Trend window. (Available for Schema, Program, Module, and SQL Grouping)
|
| Export Excel | Downloads the grid content on an excel file. |
| Copy(To Clipboard) | Makes a copy of the grid content. |
| Show/ Hide Columns | Selects the columns to be displayed on the grid. |
| Filter On | Enables the Filtering function. |
| Multiple Sort On | Sorts based on 2 or more column values. |
| Save Image | Saves the grid content as an image. |
Note. When connecting to the Long-Term Trend, the analysis period is the last 7 days from the date of analysis.
SUB) Elapsed Time Scatter Tab
Window Configuration
The window configuration is as follows.
Search Condition
| Search Condition | Description |
| |
Selects the target instance for analysis. For searching convenience, autocomplete function is available. |
| |
Sets the analysis date for yesterday. (Default Value) |
| |
Sets the analysis date for today. |
| |
You can either enter the analysis date, or select the date from the calendar UI. |
| |
Set the search condition for the individual SQL’s Elapsed Time.
|
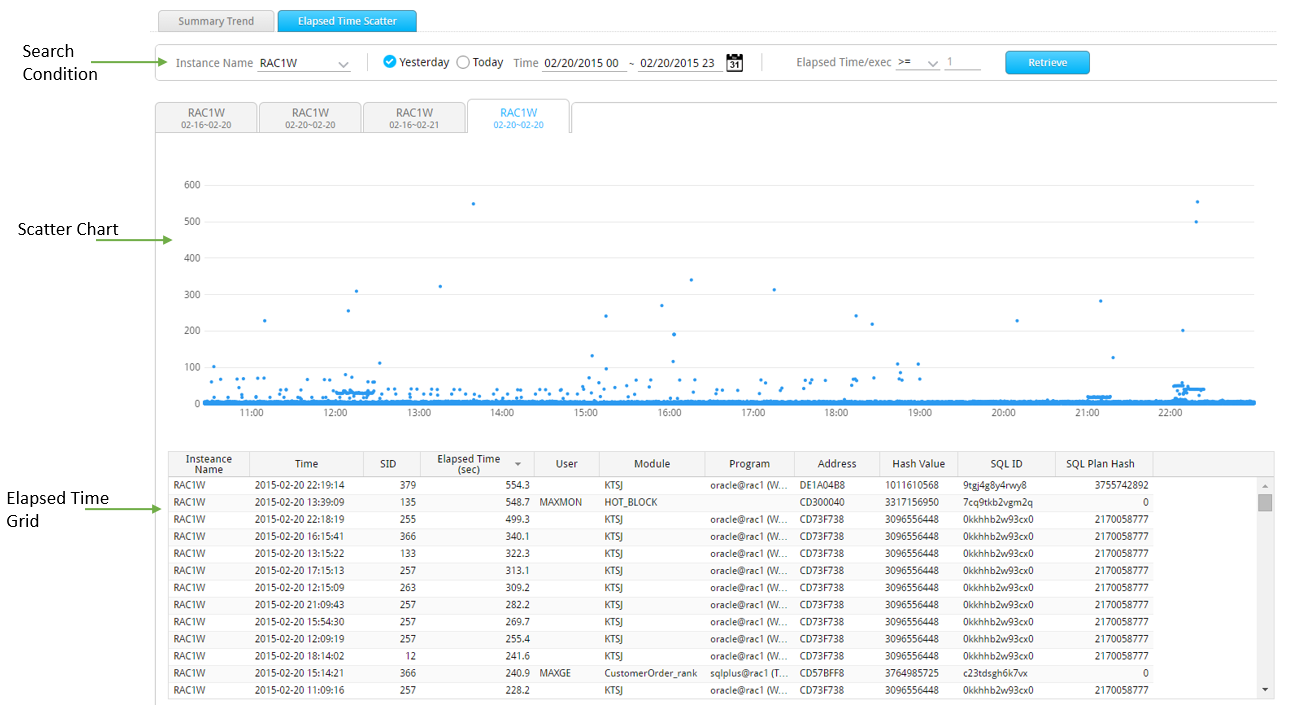
Scatter Chart
Indicates the individual SQL’s elapsed time with a “dot”.
Analysis Period Setting Method
When you drag and select the desired period you wish to analyze on theScatter Chart, the corresponding SQLs’ information will be displayed in the Elapsed Time Grid.
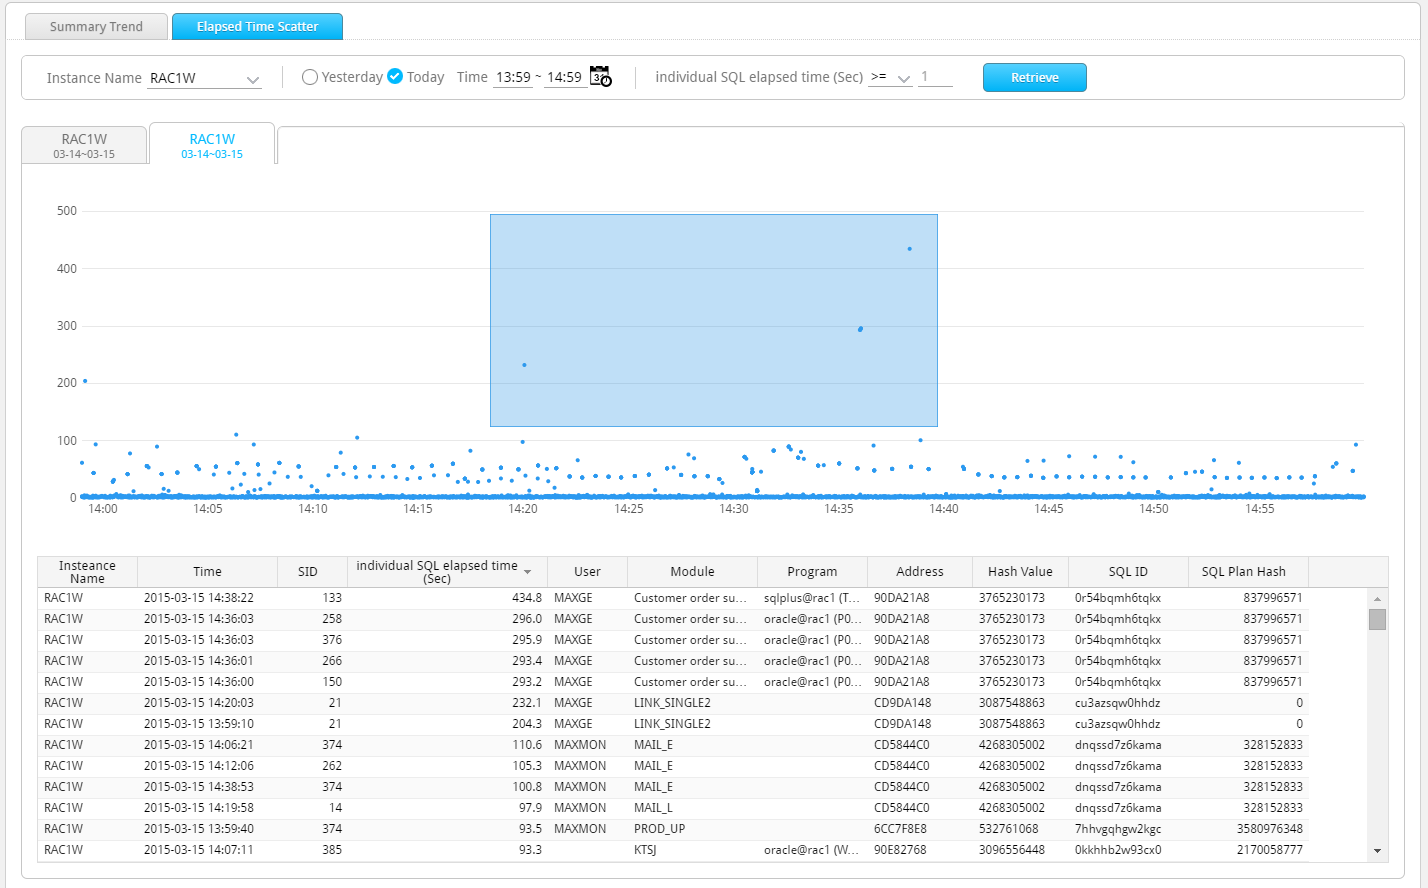
Elapsed Time Grid Column
| Column Name | Description |
| Instance Name | Instance Name |
| Time | SQL Execution End Time |
| SID | Session identifier |
| Elapsed Time (Sec) | Individual SQL Elapsed Time |
| User | Oracle User Name |
| Module | Module Name |
| Program | Program Name |
| SQL ID | Oracle SQL ID |
| Address | SQL Text Address Value |
| Hash Value | SQL Text Hash Value |
| SQL Plan Hash | Plan hash Value |
Elapsed Time Grid Mouse Right-Click Menu
The mouse right-click menu is as follows. For more information, please reference “Appendix. Grid Mouse Right-Click Menu UI”.
| Item | Description |
| Session List | Connects to the Session List Window by using the corresponding session’s Instance Name, SID. |
| SQL Detail | Provides the details of SQL execution history.
|
| Full SQL Text | Provides SQL Full Text. |
| Long-Term Trend | Connects to the Long-Term Trend Window for the corresponding SQL.
|
| Export Excel | Downloads the grid content on an excel file. |
| Copy(To Clipboard) | Makes a copy of the grid content. |
| Show/ Hide Columns | Selects the columns to be displayed on the grid. |
| Filter On | Enables the Filtering function. |
| Multiple Sort On | Sorts based on 2 or more column values. |
| Save Image | Saves the grid content as an image. |
Note. When connecting to the Long-Term Trend, the analysis period is the last 7 days from the date of analysis.
Long-Term Trend
SUB) Overview
Provides the Top-N trends analysis function. The key functions are as follows.
- Top Analysis Tab: Provides daily performance trends of Top-N (Schema, Program, Module, and SQL)
- 1-SQL: Provides daily performance trends of individual SQL.
SUB) Top Analysis Tab Description
Screen Configuration
The screen configuration is as follows.
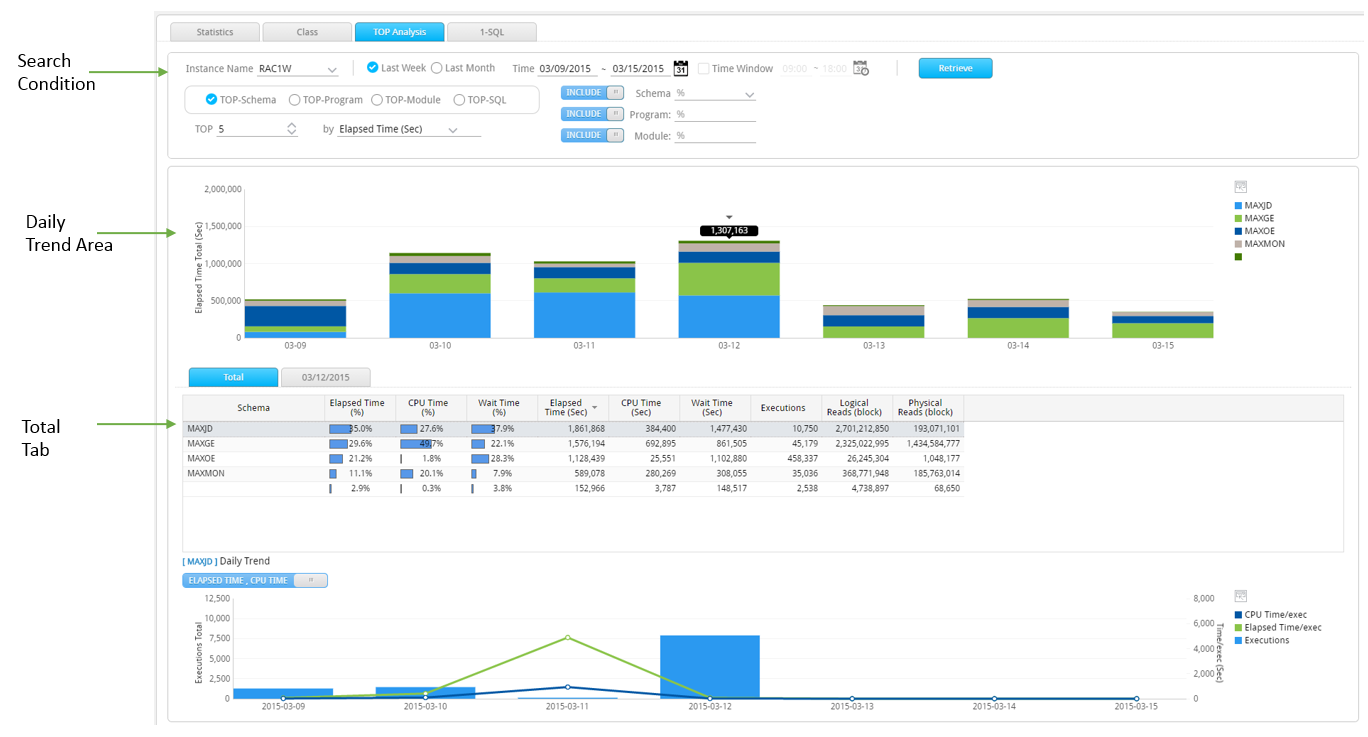
Search Condition
| Search Condition | Description |
| |
Selects the target instance for analysis. For selection convenience, the autocomplete function is available. |
| |
Sets the analysis period for the last 1 week. |
| |
Sets the analysis period for the last 1 month. |
| |
Sets the analysis date for yesterday. (Default Value) |
| |
Sets the analysis date for today. |
| |
You can either enter the analysis date, or select the date from the calendar UI. |
|
|
Include / Exclude Toggle Button
|
| |
Select Shema using the Combo box. You can choose 2 or more Schemas by clicking the items in the Combo Box.
|
| |
Enter the target Program Name and Module Name for analysis (or for exclusion). The input rules are as follows.
For example, if you want to search the programs whose Program Name is “JDBC Thin Client”, “SQL Plus”, then enter the keywords as “thin,sql”. |
| |
Select the analysis target items.
|
| |
Set the Top-N value
|
| |
Set the standard for retrieving the Top-N results.
|
| |
Sets the target time window for analysis. This may be used to analyze the Top-N information executed during the operation hours (example: 9~18 hours), or to analyze the Top-N information executed in the Batch Window.
|
When Top Schema Items Are Selected
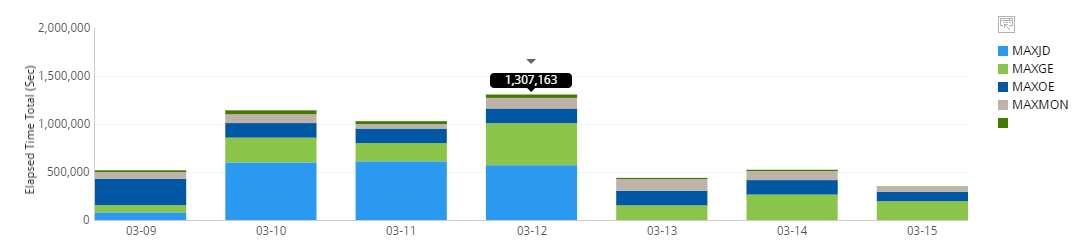
Daily Trend Area
Provides daily performance trends by schema.
Total Tab
Provides a summary information by schema and the daily trends graph by each individual schema with respect to a specific target analysis period.
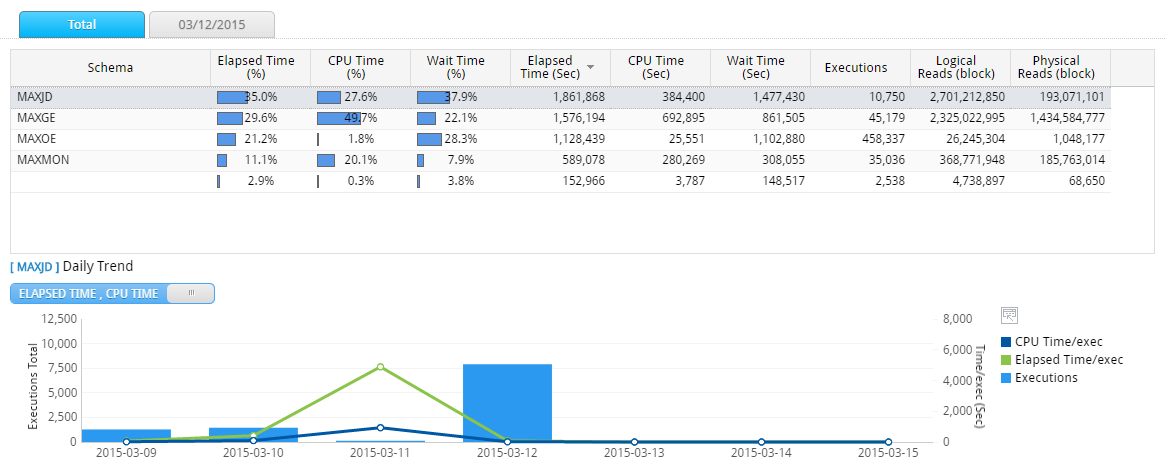
Note. Immediately following the search, it provides daily trends graph of the schema with the highest value out of the sorting standards column in the Total Tab Grid.
The Daily Trend provides 2 types for information by using the toggle button.
| Toggle Button | Description |
| |
Bar Graph: SQL execution count of the daily corresponding schema Line Graph #1: Daily average elapsed time
Line Graph #2: Daily average CPU Time
|
| |
Bar Graph: SQL execution count of the daily corresponding schema Line Graph #1: Daily average Logical IO
Line Graph #2: Daily average Physical IO
|
Daily Tab
Provides summary information by schema of a specific date and the 24 hour trends graph of each individual schema
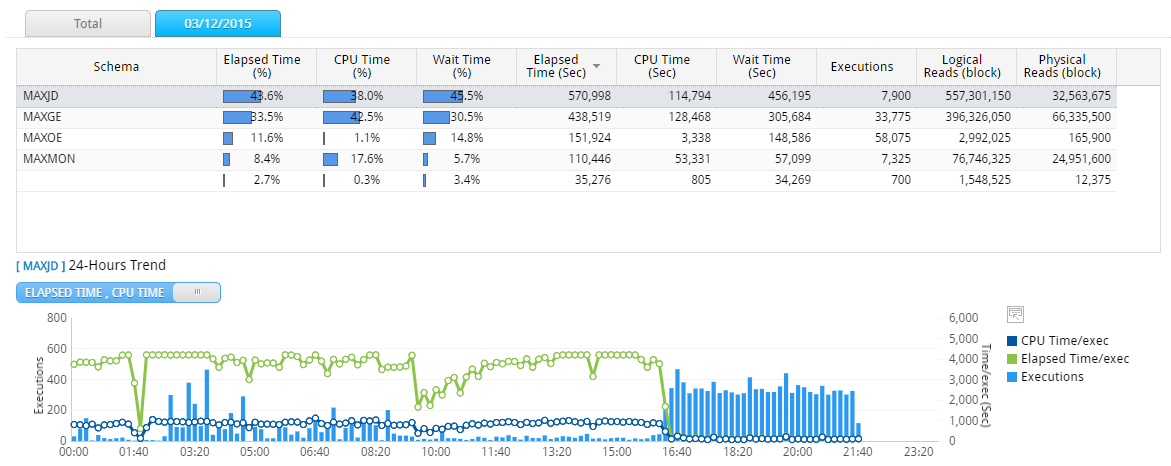
Note1. Immediately following the search, a specific date tab is automatically created for the date with the highest value in the Daily Trend Area.
Note2. The 24 hour trends graph provides the hourly information.
When Top Schema Items Are Selected
Daily Trend Area
Provides daily performance trends by schema.
Total Tab
Provides a summary information by schema and the daily trends graph by each individual schema with respect to a specific target analysis period.
Note. Immediately following the search, it provides daily trends graph of the schema with the highest value out of the sorting standards column in the Total Tab Grid.
The Daily Trend provides 2 types for information by using the toggle button.
| Toggle Button | Description |
| |
Bar Graph: SQL execution count of the daily corresponding schema Line Graph #1: Daily average elapsed time
Line Graph #2: Daily average CPU Time
|
| |
Bar Graph: SQL execution count of the daily corresponding schema Line Graph #1: Daily average Logical IO
Line Graph #2: Daily average Physical IO
|
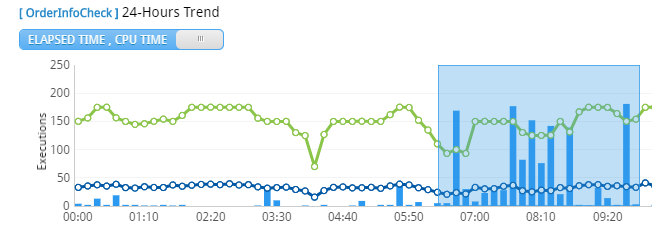
Daily Tab
Provides summary information by schema of a specific date and the 24 hour trends graph of each individual schema
Note1. Immediately following the search, a specific date tab is automatically created for the date with the highest value in the Daily Trend Area.
Note2. The 24 hour trends graph provides the hourly information.
When Top Schema Items Are Selected
Daily Trend Area
Provides daily performance trends by schema.
Total Tab
Provides a summary information by schema and the daily trends graph by each individual schema with respect to a specific target analysis period.
Note. Immediately following the search, it provides daily trends graph of the schema with the highest value out of the sorting standards column in the Total Tab Grid.
The Daily Trend provides 2 types for information by using the toggle button.
| Toggle Button | Description |
| |
Bar Graph: SQL execution count of the daily corresponding schema Line Graph #1: Daily average elapsed time
Line Graph #2: Daily average CPU Time
|
| |
Bar Graph: SQL execution count of the daily corresponding schema Line Graph #1: Daily average Logical IO
Line Graph #2: Daily average Physical IO
|
Daily Tab
Provides summary information by schema of a specific date and the 24 hour trends graph of each individual schema
Note1. Immediately following the search, a specific date tab is automatically created for the date with the highest value in the Daily Trend Area.
Note2. The 24 hour trends graph provides the hourly information.
When Top Schema Items Are Selected
Daily Trend Area
Provides daily performance trends by schema.
Total Tab
Provides a summary information by schema and the daily trends graph by each individual schema with respect to a specific target analysis period.
Note1. Immediately following the search, a specific date tab is automatically created for the date with the highest value in the Daily Trend Area
Note2. The 24 hour trends graph provides the hourly information.
Adding a Daily Tab (Common)
When you click on the bar graph in the Daily Trend Area, a Daily Tab for the corresponding date will be added
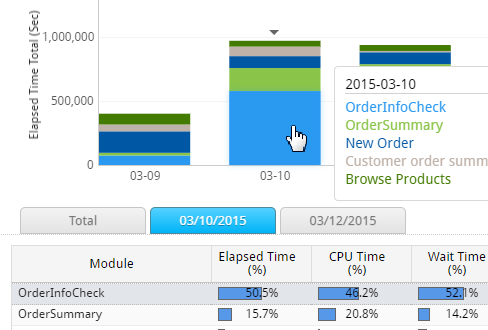
Top-N Analysis Connection Method #1 (Common)
When you click on the bar graph on the Total Tab, you will be connected to the Top-N Analysis screen with respect to the corresponding date and the items selected in the Daily Trend Area Grid.
Top-N Analysis Connection Method #2 (Common)
When you drag the Daily Tab area with your mouse, you will be connected to the Performance Trend screen.
Grid Column (Common)
| Column Name | Description |
| Top-N Criteria Name | Top-N Criteria Name (Schema Name, Program Name, Module Name or SQL_ID) |
| Elapsed Time (%) | The ratio of the corresponding item out of the Total Elapsed Time |
| CPU Time (%) | The ratio of the corresponding item out of the Total CPU Time |
| Wait Time (%) | The ratio of the corresponding item out of the Total Wait Time |
| Elapsed Time (Sec) | Elapsed time of the corresponding SQL Elapsed Time (Sum) |
| CPU Time (Sec) | The corresponding item’s CPU Time (Sum) |
| Wait Time (Sec) | The corresponding item’s Wait Time (Sum) |
| Executions | The corresponding item’s SQL Text Execution Count (Sum) |
| Logical Reads (blocks) | The corresponding item’s Logical IO (Sum) |
Grid Mouse Right-Click Menu (Common)
The mouse right-click menu is as follows. For more detailed information, please reference “Appendix. Grid Mouse Right-Click Menu UI”.
| Item | Description |
| SQL Detail | Provides SQL execution history. (TOP-SQL Only)
|
| Full SQL Text | Provides the full SQL text. (TOP-SQL Only) |
| Export Excel | Downloads the grid content on an excel file. |
| Copy(To Clipboard) | Copies the grid content. |
| Show/ Hide Columns | Selects the columns to be displayed on the grid. |
| Filter On | Enables the Filtering function. |
| Multiple Sort On | Sorts based on 2 or more column values. |
| Save Image | Saves the grid content as an image file. |
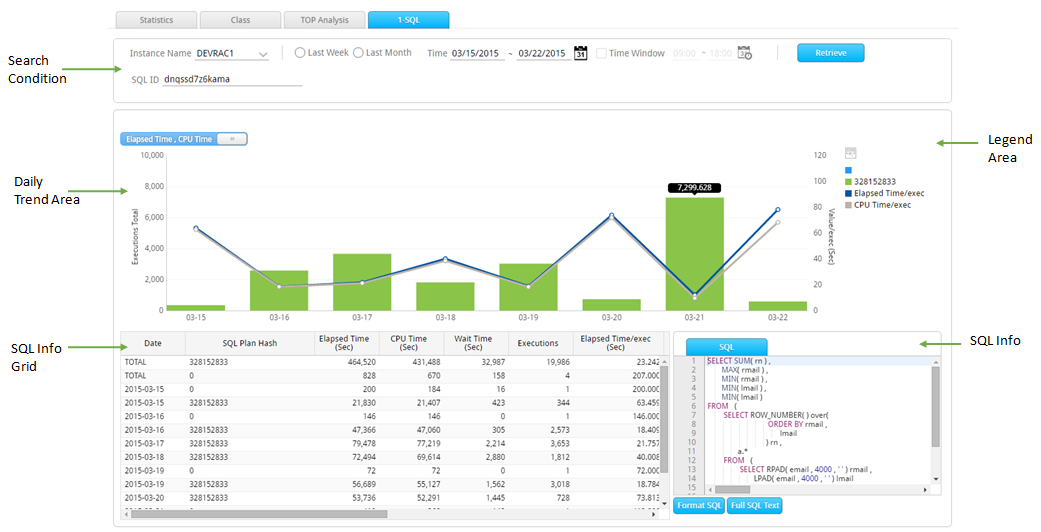
SUB) 1-SQL Tab Description
Screen Configuration
The screen configuration is as follows.
Search Condition
| Search Condition | Description |
| |
Selects the target instance for analysis. For selection convenience, the autocomplete function is available. |
| |
Sets the analysis period for the last 1 week. |
| |
Sets the analysis period for the last 1 month. |
| |
You can either enter the analysis date, or select the date from the calendar UI. |
| |
Enter the analysis target SQL’s Oracle SQL ID. |
| |
Set the analysis target time period. This can be used to analyze the information of Top-N executed during the operation hours (for example 9~19 hr), or the Top-N executed in the Batch Window.
|
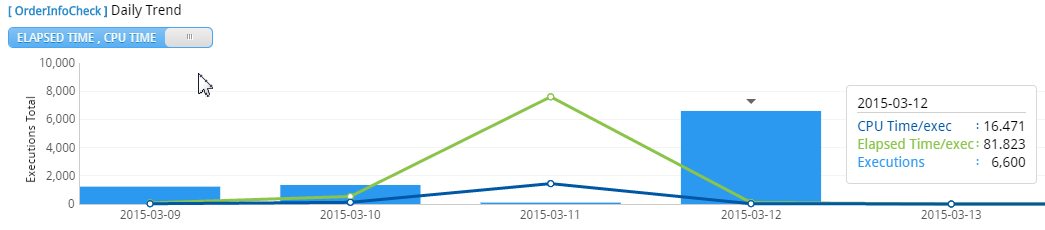
Daily Trend Area
Provides 2 types of daily performance trends of the search target SQL ID.
| Toggle Button | Description |
| |
Bar Graph: Daily corresponding SQL’s SQL execution count.
Line Graph # 1: Daily Average Elapsed Time
Line Graph #2: Daily Average CPU Time
|
| |
Bar Graph: Daily Corresponding SQL’s SQL execution count.
Line Graph # 1: Daily Average Logical IO
Line Graph #2: Daily Average Physical IO
|
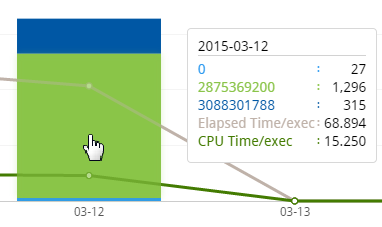
When Corresponding SQL ID’s Plan Hash Value is Greater Than 2
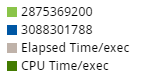
Legend Area
Displays the legend name of each plan hash value.
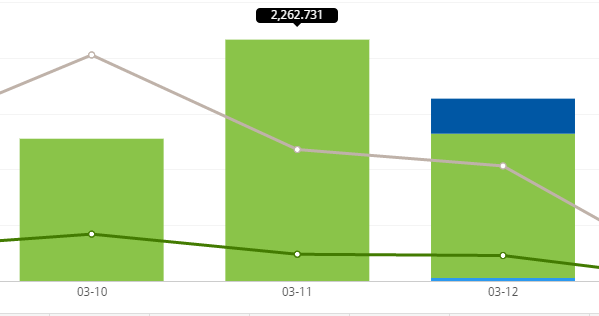
Daily Tend Chart
The Daily Trend Chart’s bar graph displays the corresponding SQL ID’s execution count. If the corresponding SQL ID’s plan hash value is greater than 2, then it will be displayed in a stacked bar chart by each plan hash value.
How to Connect to the Daily SQL Detail Screen
When you click on the bar graph in the Daily Trend Area, it connects to the SQL Detail Window. For more information about the SQL Detail Window, please reference “Chapter 7. SQL Detail Window” section.
SQL Info Grid Column
| Column Name | Description |
| Date | TOTAL or Date |
| SQL Plan Hash | SQL Plan Hash Value |
| Executions | Corresponding SQL’s SQL Text Execution Count (Average Per One Time) |
| Elapsed Time/exec (Sec) | Corresponding SQL’s SQL Elapsed Time (Average Per One Time) |
| CPU Time/exec (Sec) | Corresponding SQL’s CPU Time (Average Per One Time) |
| Wait Time/exec (Sec) | Corresponding SQL’s Wait Time (Average Per One Time) |
| Logical Reads/exec (blocks) | Corresponding SQL’s Logical IO (Average Per One Time) |
| Physical Reads/exec (blocks) | Corresponding SQL’s Physical IO (Average Per One Time) |
| Elapsed Time (Sec) | Corresponding SQL’s SQL Elapsed Time (Sum) |
| CPU Time (Sec) | Corresponding SQL’s CPU Time (Sum) |
| Wait Time (Sec) | Corresponding SQL’s Wait Time (Sum) |
| Logical Reads (blocks) | Corresponding SQL’s Logical IO (Sum) |
| Physical Reads (blocks) | Corresponding SQL’s Physical IO (Sum) |
SQL Info Grid Mouse Right-Click Menu
The mouse right-click menu is as follows. For more information, please reference “Appendix. Grid Mouse Right-Click Menu UI”.
| Item | Description |
| Export Excel | Downloads the grid content on an excel file. |
| Copy(To Clipboard) | Makes a copy of the grid content. |
| Show/ Hide Columns | Selects the columns to be displayed on the grid. |
| Filter On | Enables the Filtering function. |
| Multiple Sort On | Sorts based on 2 or more column values. |
| Save Image | Saves the grid content as an image. |
SQL Info
Provides the corresponding SQL Text and the execution plan information.
SQL Plan Analysis
SUB) Change History Trend & Analysis Description
Overview
Provides the trends of number of SQLs whose execution plan has changed by date.
Note. Provides the number of SQLs with changes, differentiating the number of SQL’s whose elapsed time has increased or decreased in accordance with the changes in execution plan.
Screen Configuration
The screen configuration is as follows.
SUB) Search Condition
| Search Condition | Description |
| |
Selects the target instance for analysis. For selection convenience, the autocomplete function is available. |
| |
Sets the analysis period for the last 1 week. |
| |
Sets the analysis period for the last 1 month. |
| |
You can either enter the analysis date, or select the date from the calendar UI. |
| |
The SQL elapsed time searches the SQL that is longer and slower than n times.
|
SUB) Trend Area
Provides the trends of number of SQLs whose execution plan has changed by each date.
| Item | Description |
| Red | Represents the number of SQLs whose elapsed time has slowed down. |
| Green | Represents the number of SQLs whose elapsed time has gotten faster. |
Note. The comparison range is at most 1 day before.
SUB) SQLs with Plan Changes
Provides the SQL information of the date selected in the Trend Area.
Note. Immediately following the search, the information of the date whose value is the highest in the Trend Area will be displayed.
Grid Column
| Column Name | Description |
| SQL ID | Oracle SQL ID |
| SQL Text | SQL Statement |
| Schema | Schema Name |
| Program | Program Name |
| Module | Module Name |
| Prev. Execution Time | Execution Time before the Execution plan change |
| Prev. Elapsed Time/exec (Sec) | Elapsed Time before the Execution plan change (Average per execution) |
| Current Elapsed Time/exec (Sec) | Elapsed Time after the Execution plan change (Average per execution) |
| Diff Time (Current – Prev) | Elapsed Time Difference |
Grid Mouse Right-Click Menu
The mouse right-click menu is as follows. For more information, please reference “Appendix. Grid Mouse Right-Click Menu UI”.
| Item | Description |
| SQL Detail | Provides the details of SQL execution history.
|
| Full SQL Text | Provides SQL Full Text. |
| Long-Term Trend | Connects to Long-Term Trend window for the corresponding SQL.
|
| Export Excel | Downloads the grid content on an excel file. |
| Copy(To Clipboard) | Makes a copy of the grid content. |
| Show/ Hide Columns | Selects the columns to be displayed on the grid. |
| Filter On | Enables the Filtering function. |
| Multiple Sort On | Sorts based on 2 or more column values. |
| Save Image | Saves the grid content as an image. |
Plan Diff
Provides the function through which you can compare 2 plans. For more information, please reference “Chapter 9. SQL Plan Diff Window” section
CRUD Analysis Description
SUB) Overview
Provides SQLs related to CRUD matrix by table and its key roles are as follows.
- Analyzes the access patterns by checking the CRUD matrix of a specific table.
- In case a contention such as “gc buffer busy” is generated in a RAC environment, it identifies the SQLs which accessed the corresponding table by each node.
SUB) Screen Configuration
The screen configuration is as follows.
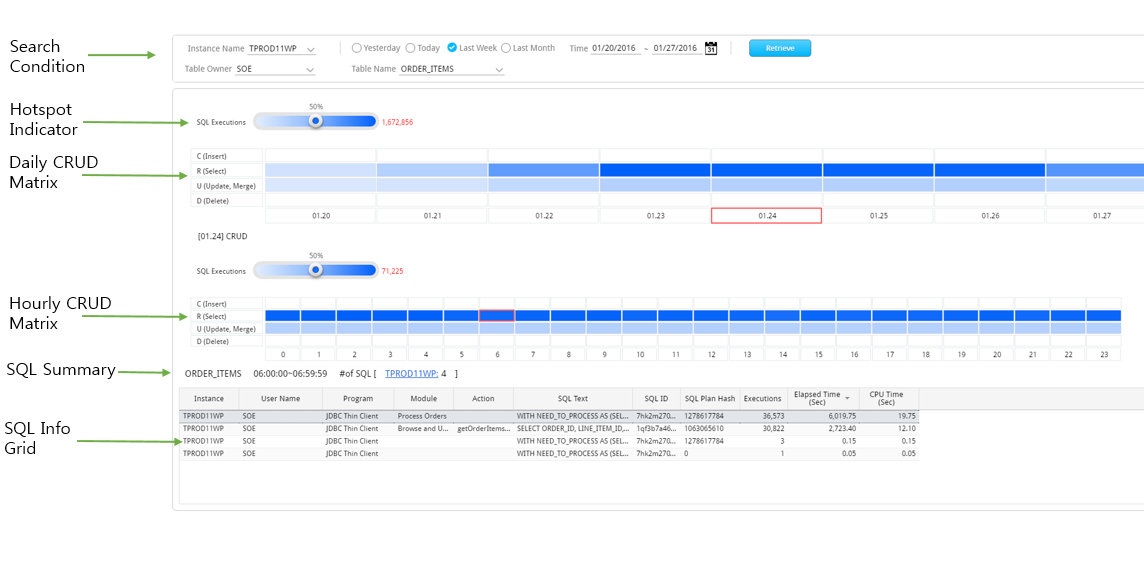
SUB) Search Condition
| Search Condition | Description |
| |
Select the target analysis instance. You can select 1 or more instance(s). |
| |
Set yesterday as the target analysis date. |
| |
Set today as the target analysis date. |
| |
Set the last 1 week as the target analysis period. (Default Setting Value) |
| |
Set the last 1 month as the target analysis period. |
| |
Type in the target analysis period or use the calendar UI to select the dates. |
| |
Use the Combo box to select the schema. |
| |
Use the Combo box to select the table. |
SUB) What Precautions to Take When Searching INSERT Text
When you enter the schema name in the “Table Owner” search condition, it poses a problem of not yielding the INSERT text. That is because up until the Oracle 11g, the OBJECT_OWNER and the OBJECT_NAME were not provided in the V$SQL_PLAN with respect to the INSERT text. Therefore, even in the Maxgauge Repository’s plan storage table, the OBJECT_OWNER and the OBJECT_NAME in the execution plan for the INSERT text will be entered as NULL.
In an effort to resolve at least part of such a problem, MaxGauge Data Gather daemon uses the following method.
- Sort out the INSERT texts from the SQLs stored in the MaxGaure Repository.
- Parse the INSERT texts.
- When executed in the “INSERT INTO SCHEMA.TABLE VALUES () “format, then retrieve the schema name and the table name and then save.
- When executed in the “INSERT INTO TABLE VALUES () “format, then retrieve the table name and then save. In this case, you should not enter the schema name in the “Table Owner” search condition.
SUB) Hotspot Indicator
This is used to change the gradation for the cells within the CRUD Matrix.
SUB) Daily CRUD Matrix
Provides the daily CRUD Matrix information.
SUB) Hourly CRUD Matrix
Provides the hourly CRUD Matrix information of the specific date selected in the Daily CRUD Matrix.
SUB) SQL Summary
Provides the number of SQLs related to the cell selected in the Hourly CRUD Matrix by each instance.
SUB) Grid Column
| Column Name | Description |
| Instance | Instance Name |
| User Name | Schema Name |
| Program | Program Name |
| Module | Module Name |
| Action | Action Name |
| SQL Text | SQL Text |
| SQL ID | Oracle SQL_ID |
| SQL Plan Hash | SQL Plan Hash Value |
| Executions | The corresponding SQL’s SQL text execution count (Average per 1 time) |
| Elapsed Time/exec (Sec) | The corresponding SQL’s SQL Elapsed Time (Sum) |
| CPU Time/exec (Sec) | The corresponding SQL’s CPU Time (Sum) |
SUB) Grid Mouse Right-Click Menu
The mouse right-click menu is as follows. For more detailed information, please reference “Appendix. Grid Mouse Right-Click Menu UI”.
| Item | Description |
| SQL Detail | Provides SQL execution history.
l For more information, please reference “Chapter 7. SQL Detail Window” section. |
| Full SQL Text | Provides the full SQL text. |
| Export Excel | Downloads the grid content on an excel file. |
| Copy(To Clipboard) | Copies the grid content. |
| Show/ Hide Columns | Selects the columns to be displayed on the grid. |
| Filter On | Enables the Filtering function. |
| Multiple Sort On | Sorts based on 2 or more column values. |