
SUB) Overview
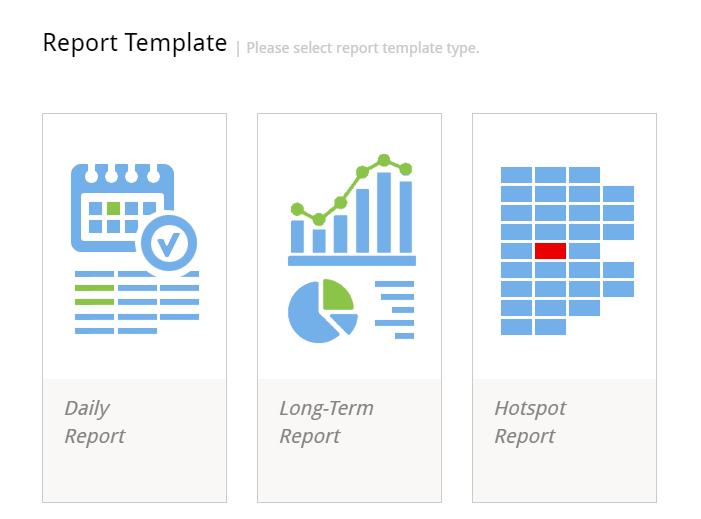
Provides a report for performance analysis. The report results are saved on an excel file format and there are 3 report templates.
| Report Template | Description |
| Daily Report | Provides performance analysis report of a specific date. |
| Long-Term Report | Provides performance analysis report of a specific period. |
| Hotspot Report | Provides performance analysis report of a Hotspot area. |
Daily Report
SUB) Report Item Selection Screen
The screen configuration is as follows.
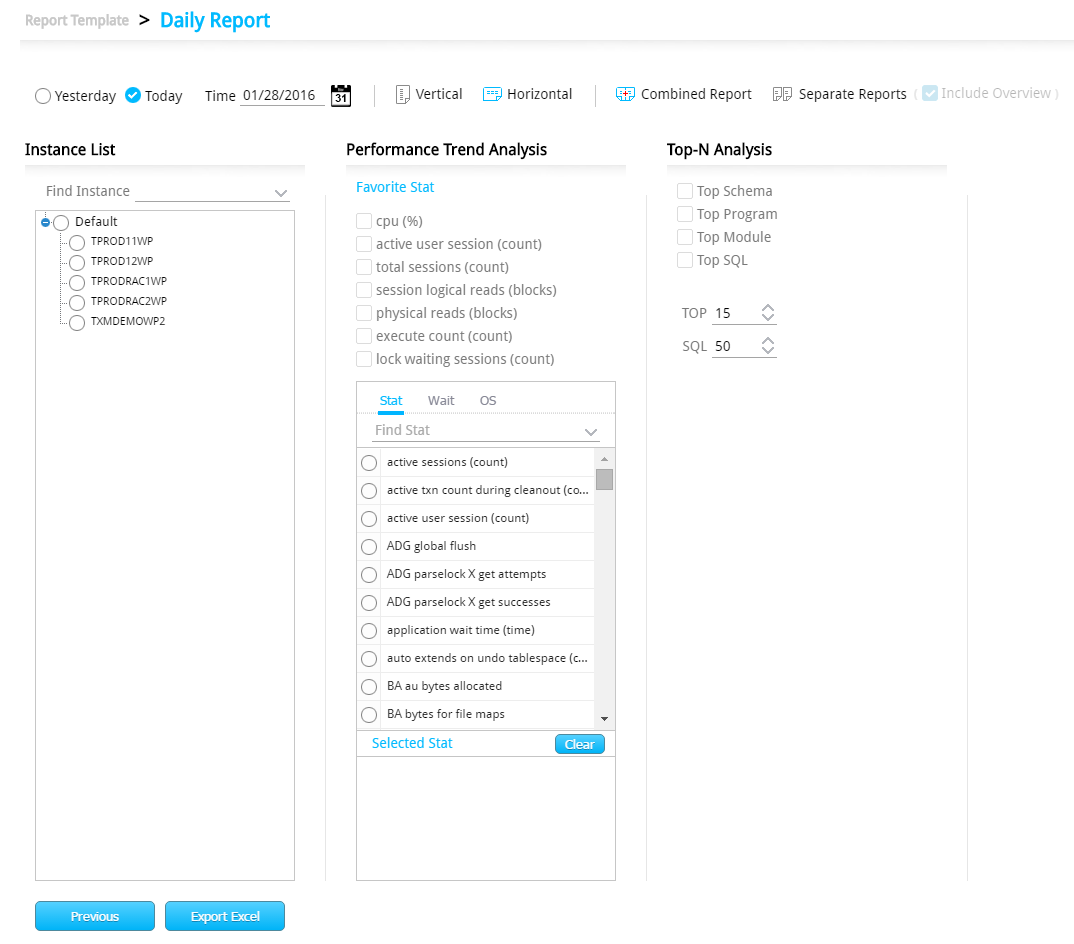
SUB) Report Item Selection Option Description
| option | Description |
| |
Select the report target date. |
| |
Select the output format.
|
| |
When 2 or more instances are selected, decide how you want the files to be created.
|
| |
Activated only when Separate Reports option has been selected.
If this option is enabled, all of the instance information will be provided in the performance trend section of the report. (Default Setting Value) If this option is enabled, all of the instance information will be provided in the performance trend section of the report. (Default Setting Value) |
| Instance List Area | Select the target instance for the report. |
| Performance Trend Analysis Area | Select the target performance stats for the report. |
| Top-N Analsysis Area | Select the target top number and the type for the report. |
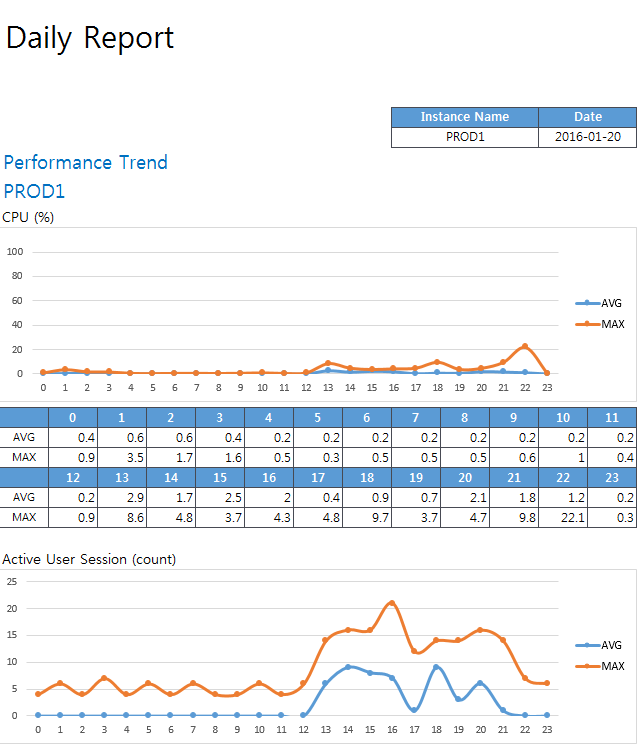
SUB) Report Output Sample
Performance Trend Section (Partial)
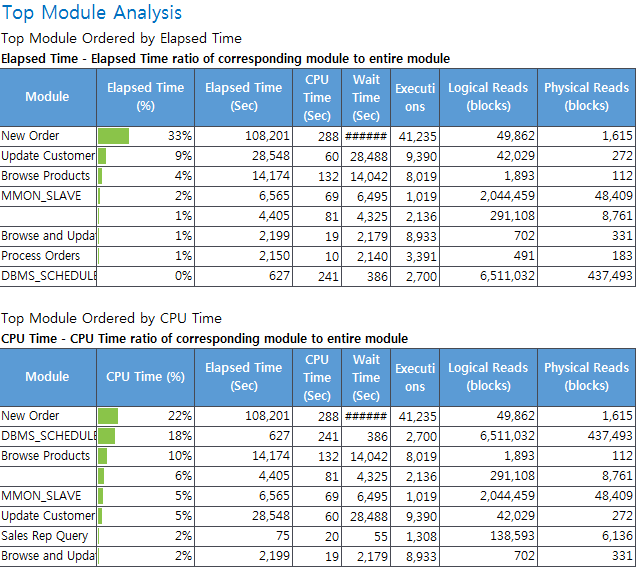
Top-N Section (Partial)
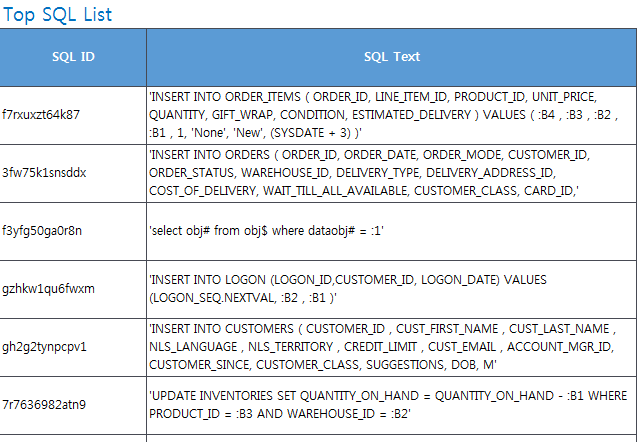
Top SQL List Section (Partial)
Long Term Report
SUB) Report Item Selection Screen
The screen configuration is as follows.
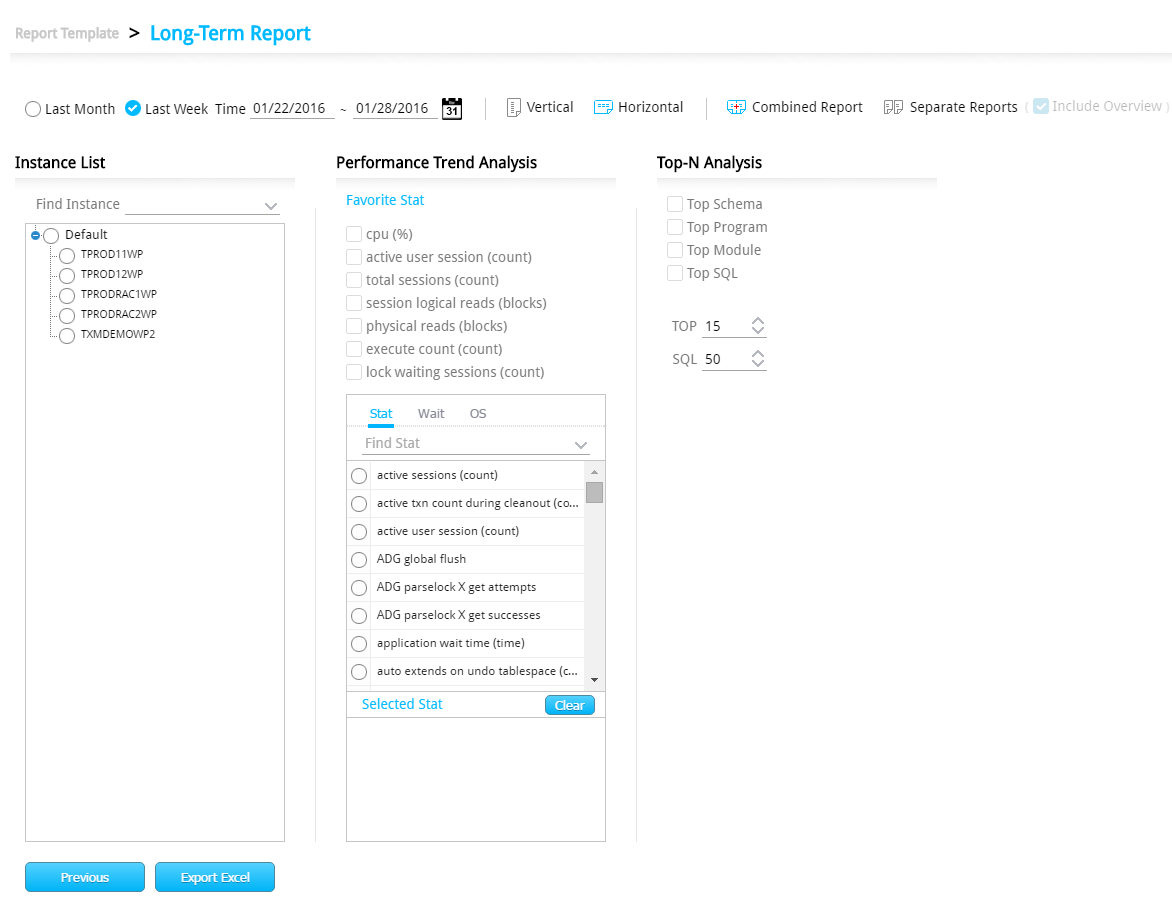
Note1. With exception to the period selection option, all other options are the same as the Daily Report.
Note2. Except that it provides the performance trends by date, everything else is the same as the Daily Report.
Hotspot Report
SUB) Report Item Selection Screen
The screen configuration is as follows.
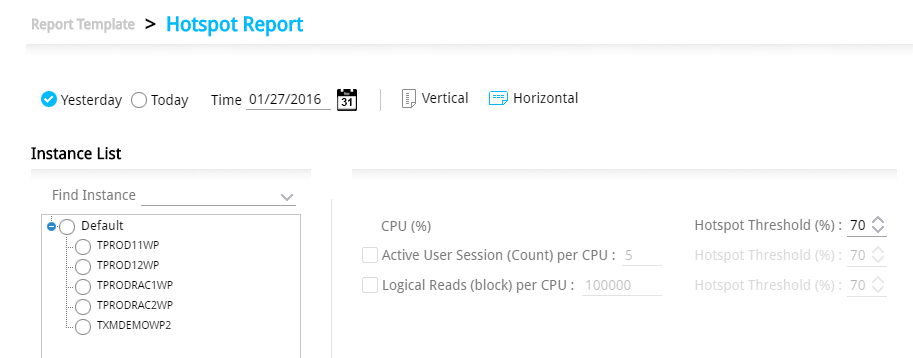
SUB) Report Item Selection Option Description
| Option | Description |
| CPU (%) | Outputs the hotspots based on CPU(%).
l Required item |
| Hotspot Threshold (%) | Sets the Hotspot standard. (Default setting value: 70%) |
| Active User Session (Count) per CPU | Outputs hotspots based on the number of Active User Sessions.
Let’s suppose the number of CPU is 10, then 50 is 100%. The hotspot threshold (%) is 70% which means if it exceeds 35, then it will be recognized as a hotspot. |
| Logical Reads (block) per CPU | Outputs hotspot based on Logical Reads (block).
Let’s suppose the number of CPU is 10, and then we can assume 1,000,000 blocks is 100%. The hotspot threshold (%) is 70% which means if it exceeds 700,000 blocks, then it will be recognized as a hotspot. |
Note. Regarding all other options, please reference the Daily Report section.
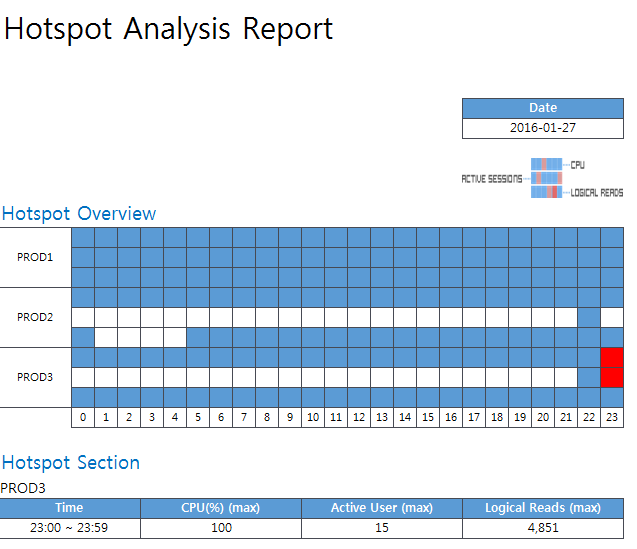
SUB) Report Output Sample
Hotspot Overview and Hotspot Section
CPU (%) Analysis Section
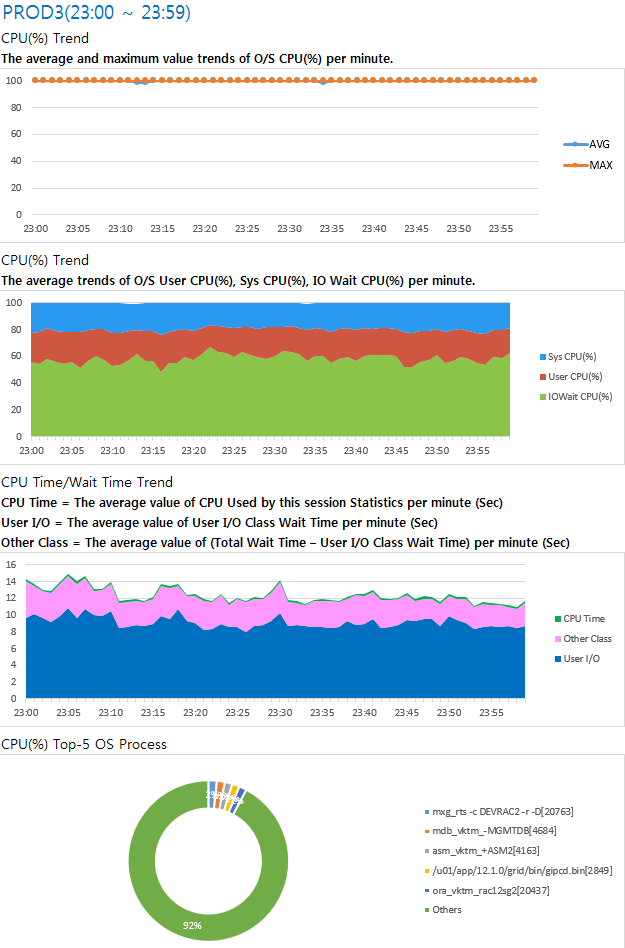
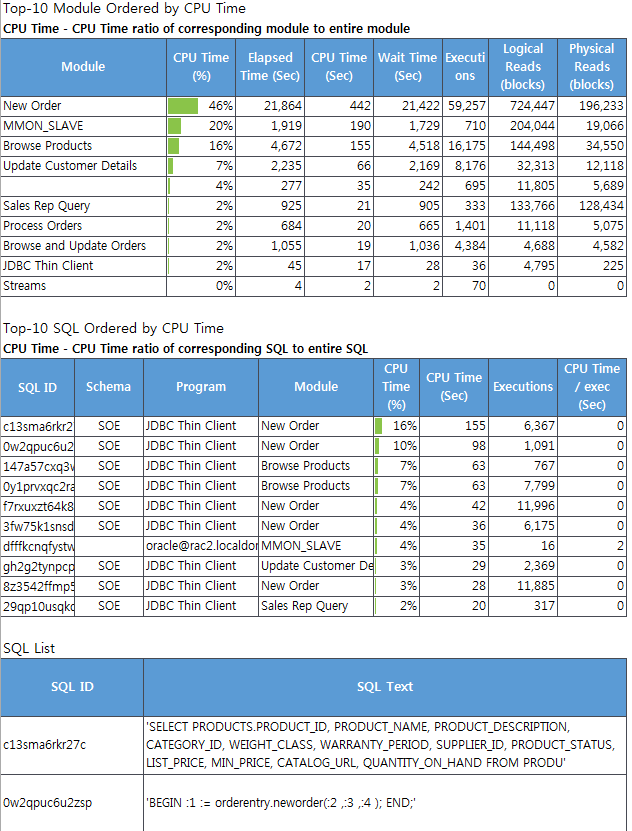
Top Analysis Section (Partial)
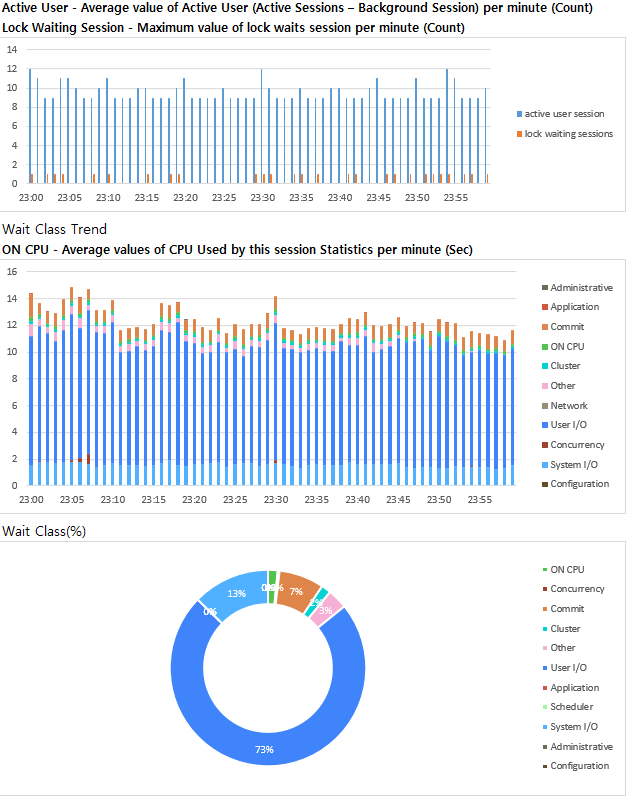
Active User and Wait Class Analysis Section
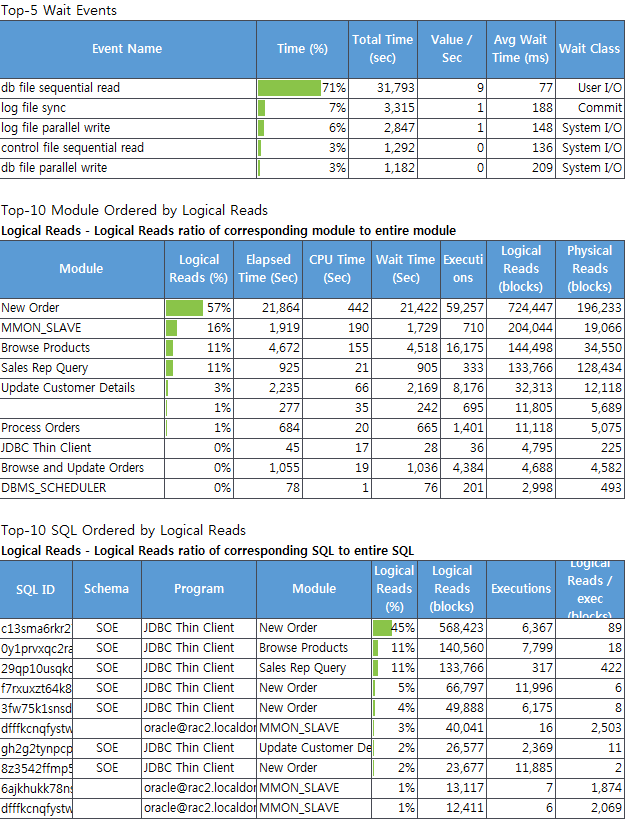
Top Event and Logical Reads Analysis Section (Partial)
Note. Provides various analysis results like the above by each hotspot area. Therefore, when there are many hotspot areas, it may take a long time to create the report and the size of the excel file may increase as well.