MAIN) 1. Product Overview
MaxGauge For SQL Server is a performance management tool designed to effectively support performance and system problems in different enviorments such as database, systems, and applications and for each of its components. With MaxGauge For SQL Server, a system operation manager can manage performance through an intimately interconnected system.
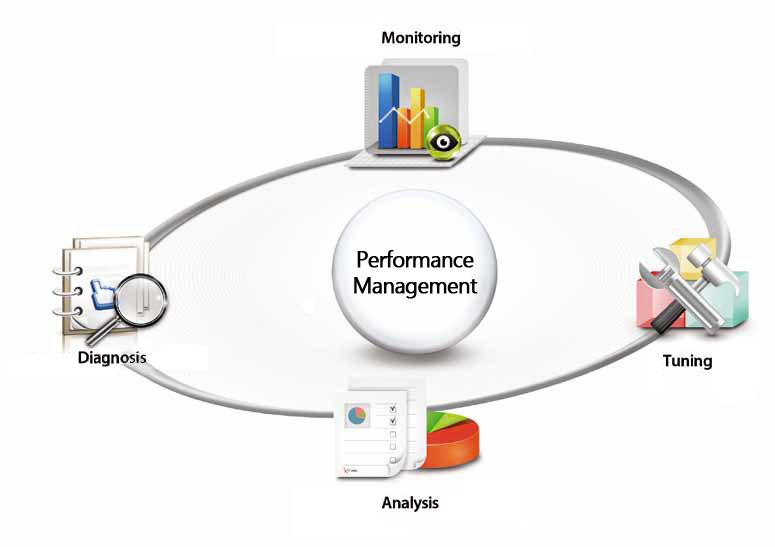
MaxGauge For SQL Server supports system managers or application managers whose role is to manage performance and system problems, with MaxGauge’s real-time monitoring, diagnosis, analysis, and tuning functions, system’s can be managed more effectively.
Through real-time monitoring, even among the many servers, it allows you to easily and quickly identify exactly the DB system error and where the system degradation occurred.
In the event of a system problem and performance degradation, through real-time diagnosis process, it allows you to pinpoint the occurance and its cause for it to resolve the issues as quickly as possible. And through post-analysis, it goes further to analyze the problem in greater depth to provide appropriate solutions to prevent any future recurrences.
Back To Top
Installation Environment and Supported Monitor Server Specifications
Repository
Software
SQL Server: SQL Server 2008 or Higher
x86/x64
Hardware
CPU: 2 Core (Minimum) / 4 Core (Recommended)
RAM: 4GB (Minimum) / 8GB (Recommended)
Disk: 20GB [30 Days Amount (1 Day 1 Server 500MB)]
Network
WAS Connection Settings: 8090 (TCP Port, Changeable)
Target DB Server
Software
OS: Windows Server 2003 or Higher
SQL Server: SQL Server 2005 or Higher
x86/x64
Network
Sysmon Connection Settings: 9729 (TCP Port, Changeable)
Back To Top
MAIN) 2. Main Functions
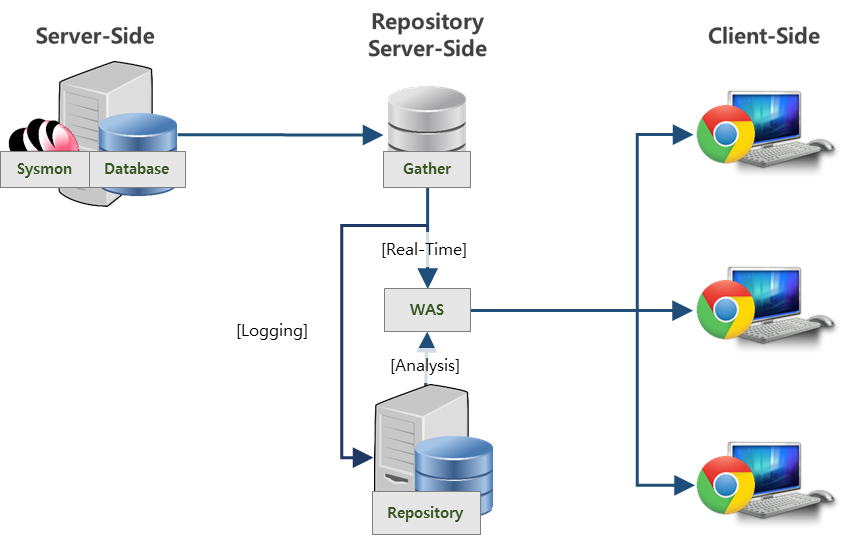
The MaxGauge For SQL Server is composed of three parts – server agent (Sysmon), client agent (Gather), and WAS (Jetty). Its components include the Sysmon which collects the DB Instance’s performance information and OS information, the Gather which stores the information gathered from DB and OS into the Repository DB, the Repository DB which temporarily stores the saved data, and the web client which monitors the DB’s current status.
The agent installed in the DB server delivers the information collected through the TCP socket communication, and this information can be stored in a separate Repository DB to be used for real-time monitoring as well as for post-analysis.
Back To Top
Sysmon (OS Monitoring Agent)
Sysmon is an agent which collects various performance information of the target server’s OS.
The information collected by Sysmon is as follows.
CPU Information
Collects the operating server’s CPU status information.
Memory Information
Collects the operating server’s memory usage and paging information.
Disk Information
Collects operating server’s disk usage and wait status information.
System Information
Collects context switch and processor queue length information.
Process Information
Collects information of processes currently executing in the operating server.
Windows Event Information
Collects information if events generated in Windows(OS).
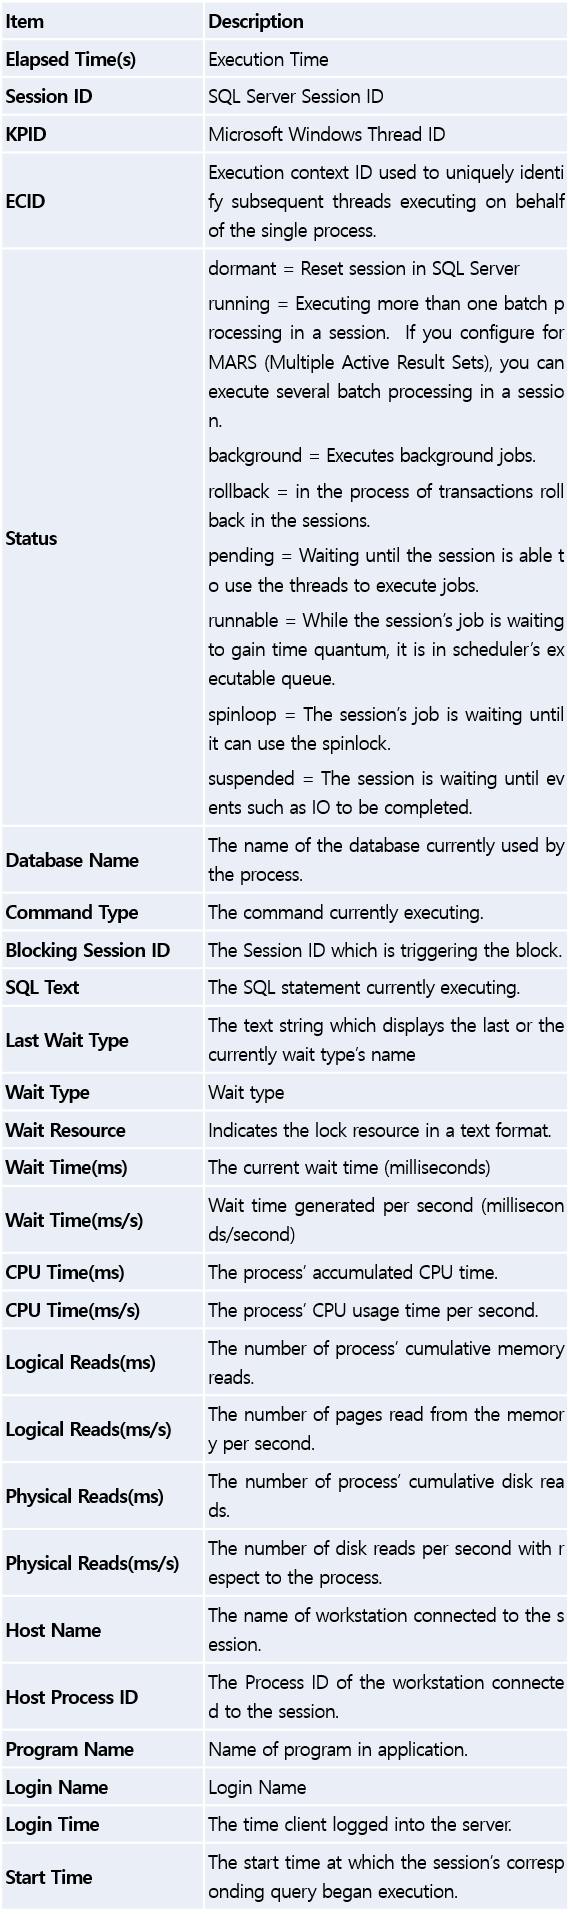
Sysmon Indicator Description
Back To Top
Dashboard
A window on which you can check the server (instance) status in real-time by monitoring the alarm critical values and windows events. Has the advantage of monitoring multi-instances more intuitively.
Alert Threshold Value Information
In the event the CPU, Disk Size, Database Size, and etc. have exceeded the threshold value for each indicator set by the user, the information is displayed in the list and the instance color changes.
Windows Event Information
Once the windows event information is generated in the operating server, the corresponding content is displayed in the list, the number of windows events not viewed by the user is displayed next to the instance, and the color changes.
Back To Top
Single View (Real-Time Monitoring)
The Single View is a window which collects and displays the OS information and the monitoring target instances of various types of sessions and statistics, and the statistics of SQLs executed by transactions running in the instance.
Note:Single View’s collection cycle is 5 seconds by default, and the collecting information is as follows.
DB STAT Information
Collects various types of SQL Server Stat information from the connected instance through optimized queries.
Sysmon Information
Collects OS CPU Usage, Disk Usage, Memory Information, Event Log, and etc.
Note:The functions provided in Single View are as follows.
Active Session Monitoring Function
Easily monitors the list of active sessions currently running in the instance.
Session Tracking Function
With a mouse click, you can easily track the session which caused the performance issue generated in a single SQL Server instance.
Session Monitoring Function
Closely monitoring a specific session’s current workload and SQL information on a single screen, you can know the session’s current status in real time.
Session Search Function
Search for the several sessions logged on to one instance according to the conditions, and simultaneously monitor the session groups which meet the conditions. For a single session, you can look up the workload information, SQL statement currently being executed, and logon information.
LOCK Tracking Function
Tracks down the wait relationship of locks generated in the SQL server instance in real time. You can closely analyze the session owning the lock and the wait sessions in a tree format and easily detect deadlock phenomenon.
SYSTEM Indicator Monitoring Function
Provides the OS CPU Usage information of the installed server in graph format and in real time, which allows the user to effectively monitor even more performance indicators.
ACTIVE SESSION HISTORY Tracking Function
You can track the history of active session that were running during the period it’s been displayed on the main screen.
Real-Time Alert Function and the Number of Alerts Generated Today Verification Function
Provides alerts generated in Error Log and Event Log.
Counter and Wait Search Function
Provides the function through which you can look up the performance counter value and the wait information in real time.
Session List Search Function
Provides the function through which you can look up all the sessions that are currently connected, according to various search conditions.
TOP SQL Statement Search Function
Provides the function through which you can look up with a part of the SQL statement used in the query statement, CPU Time, Logical Read, Physical Read, Execution Count, and etc.
Session Wait Information Search Function
Provides the function through which you can look up the wait information at the session level.
Database Size Information Search Function
Provides the function through which you can look up the data file by each database, log file size and usage, and configuration information in real time.
System Memory Information Search Function
Provides the function through which you can look up the memory usage information at the instance level.
File IO Information Search Function
Provides the function through which you can look up the data and log file’s IO information.
OS and Instance Information Search Function
Provides the function through which you can look up OS and instance level’s specific information.
Process Information Search Function
Provides the function through which you can look up the list of processes of the entire OS.
Job Results Search Function
Provides the function through which you can look up job results.
Resource Usage Current Status Search Function
Provides the function through which you can look up the usage current status of Scheduler, Disk, and Memory.
System Multi Monitor
Informs the corresponding server’s CPU and Memory usage information at the current time.
Profiler Usage Function
Collects the trace log by running the Trace (Profiler) on the corresponding server.
Back To Top
Multi View (Real-Time Monitoring)
The Multi View is a window which displays the OS information collected through Sysmon, the target instances for various types of sessions and statistics information, and the statistics of various kinds of SQL run by transactions executed in the instance; and displays information regarding several instances, all on a single screen.
Note:The Multi View’s collection data intervals is 5 seconds by default, and the collecting information is as follows.
DB STAT Information
Collects various kinds of SQL Server Stat information of the instance connected through the optimized queries.
Sysmon Information
Collects OS CPU usage, Event Log information, and etc.
Note: The functions provided in the Multi View are as follows.
Active Session Monitoring Function
You can monitor a list of active sessions running in several instances.
Session Tracking Function
Easily tracks the session which caused the performance issue generated in a specific SQL Server instance, with a single mouse click.
Session Monitoring Function
Organically monitoring a specific session’s current workload and SQL information on a single screen, you can evaluate the session’s current status in real time.
Session Search Function
Search for the several sessions logged on to several instances according to Elapsed Time and Program Name conditions, and simultaneously monitor the session groups which meet the conditions. For a single session, you can look up the workload information, SQL statement currently being executed, and logon information.
SYSTEM Indicator Monitoring Function
Provides the OS CPU Usage information of several operating installed servers in a graph format and in real time, which allows the user to effectively monitor even more performance indicators.
ACTIVE SESSION HISTORY Tracking Function
You can track the history of active session that were running during the period it’s been displayed on the main screen.
Real-Time Alert Function and the Number of Alerts Generated Today Verification Function
Provides alerts generated in Error Log and Event Log.
Back To Top
Performance Analyzer
The Performance Analyzer provides various functions through which you can easily identify the target instance’s status by looking up the information stored in the Repository DB. The functions provided in the Performance Analyzer are as follows:
Instance Monitoring
By monitoring the entire instance, you can quickly and easily identify exactly where the problem is, in the event of delayed service response and performance degradation.
Active Session Monitoring Function
You can easily check the list of active sessions executed at a specific time.
Main Indicator Search
Displays CPU, Active Session, and performance trends of main performance indicators provided in the SQL Server.
Individual Specific Indicator Search
You can easily see the status by time through Stat, Counter, Wait, Session Wait, Database size info, and Lock Tree, and easily identify the Configuration, OS, and instance information and the status of items related to the entire instances.
Long Term Trends Analysis Function
The Summary Trends and Performance Trends are functions through which you can check the trends of not one day’s log but several days’ by each indicator at once. You can check the trends in comparison to previous month or the server’s usage during one month and performance trends all on one screen.
Back To Top
MAIN) 3. SERVER-SIDE Configuration
Back To Top
SYSMON Installation and Execution Method
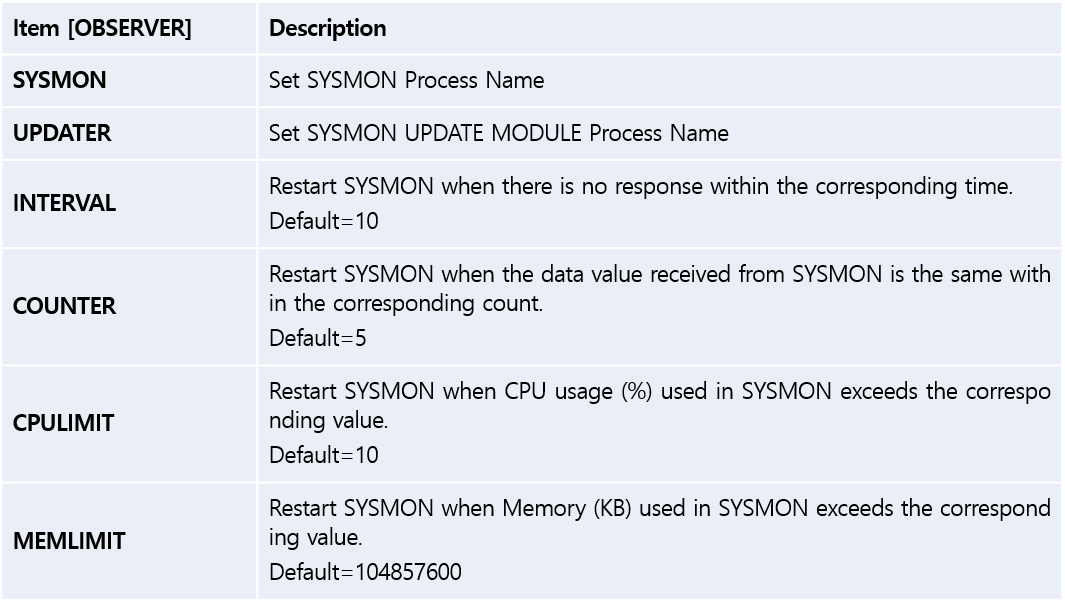
SYSMON is used by registering as a windows service in the operating server. The service will be registered with the name ‘EXEM Sysmon For MSSQL Service’, and the 2 items — SYSMON (sysmon4mssql.exe) and SYSMON Observer (sysmon4mssqlsvc.exe) — will be executed as the actual background processes. SYSMON has the OS information collecting function and SYSMON Observer monitors the SYSMON to restart the corresponding service in the event it recognizes abnormal operations.
To install, create an arbitrary folder (C:\maxgauge\sysmon\) in the monitoring target DB server (instance), and copy the Sysmon.zip file and unzip to install.
In the path where SYSMON was copied, when you go to the bin folder and execute install.bat file, the service will be automatically registered and the service will start. (For Windows Vista, Windows 2008 or higher versions, right-click the corresponding files through UAC and execute with administrator permissions.)
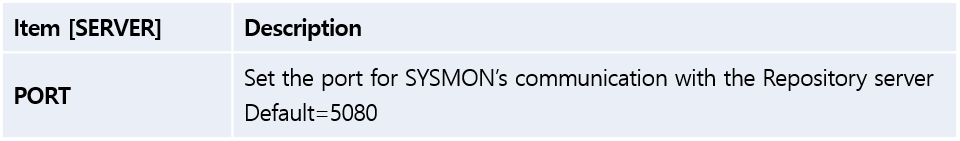
Sysmon service uses the 9729 port as the default communications port. For service to operate, the port must be opened. In case you wish to use a different port, you must edit the ‘mfs.conf’ file in the ‘conf’ folder. After you have changed the port in the section ‘#Listening port PORT=9729’ and you must restart the service in order for the changes to be applied.

Image. SYSMON, SYSMON Observer Registration

Image. SYSMON and SYSMON Observer Process
Back To Top
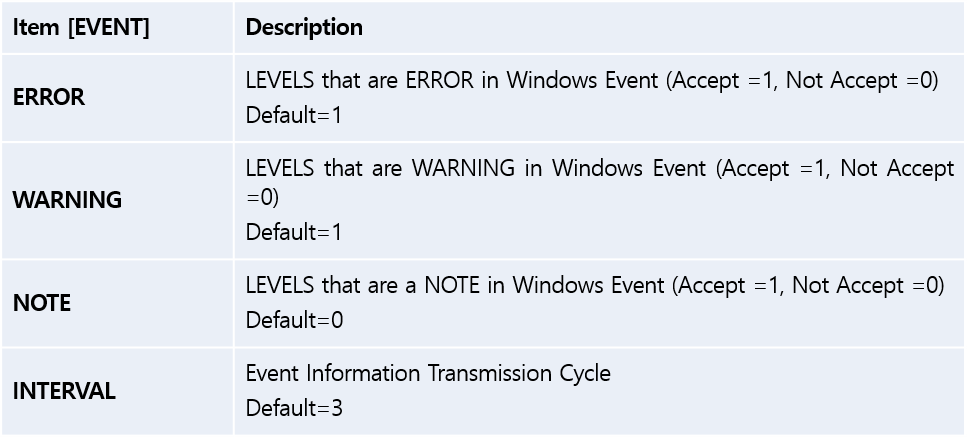
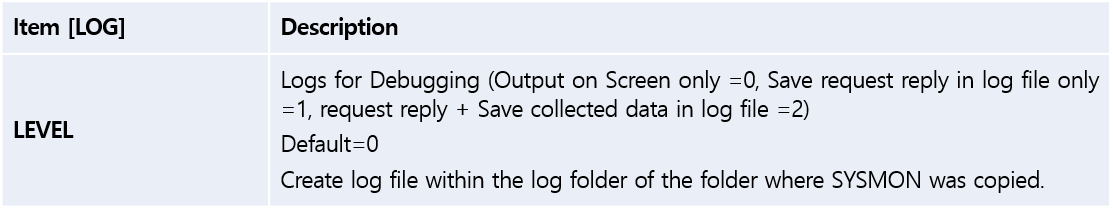
SYSMON Setting Method
When you go to the conf folder of the folder where SYSMON was copied, you will find the mfs.conf file. When you open the corresponding file with programs such as Notepad or Word, you will be able to change the settings for SYSMON.
Back To Top
SYSMON Debug Mode Execution
Because SYSMON is registered as a service and operated in the background, it is difficult to check whether it is being operated normally or correctly displaying the OS information in real time. Therefore, if you execute SYSMON in debug mode, you can check the work process on the Dashboard screen in real time. You cannot execute SYSMON simultaneously in debug mode or normal mode. Must select one of the two modes.
When SYSMON service has been already executed, to execute SYSMON in debug mode–stop the service first and execute Dashboard.bat file in the bin folder with administrator’s permission.
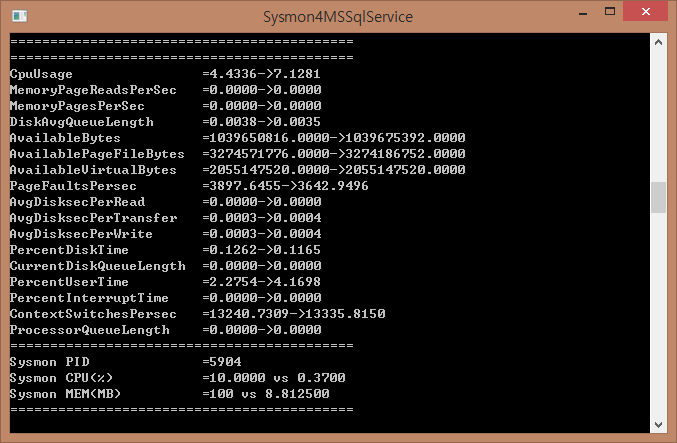
Image. SYSMON Debug Mode Execution
Back To Top
Recording Alert Generation in Windows Event Log
If you set the alert threshold value for the main indicators in MFS and set it to record in the Windows Event Log, then SYSMON records the alert generation in the target server’s Windows Event Log.
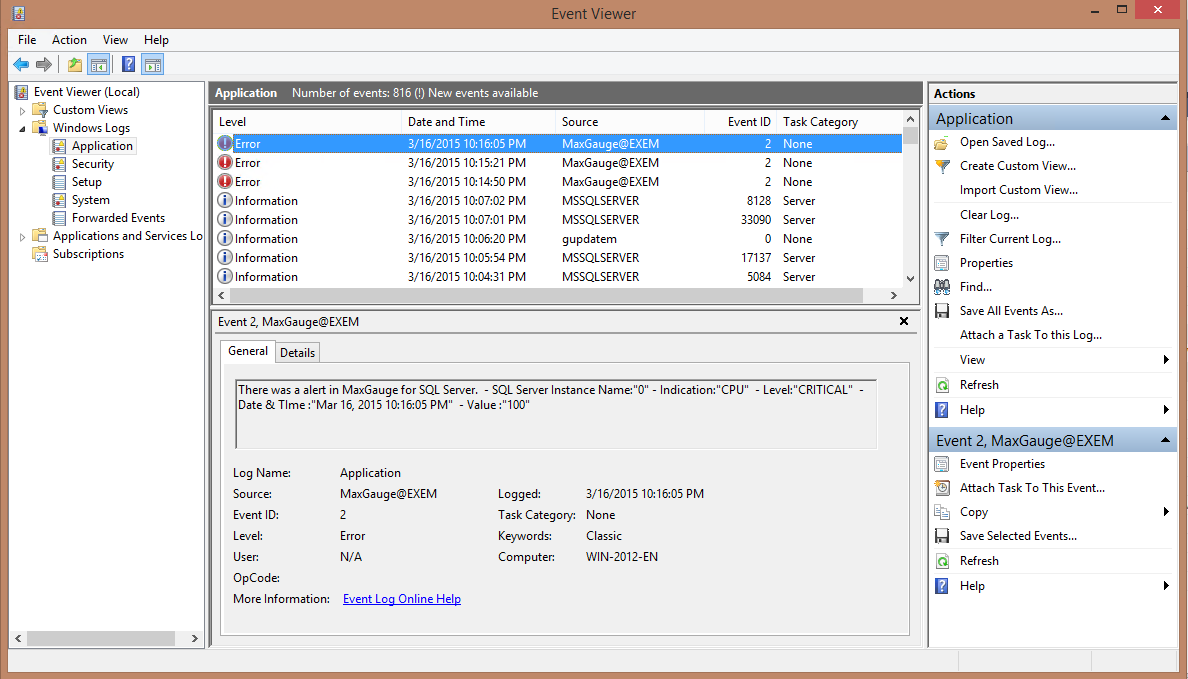
Image. Windows Event Log Screen when an alarm is generated .
Back To Top
MAIN) 4. REPOSITORY-SIDE Configuration
Back To Top
Installation Method
Execute the Execution File with administrator permissions.
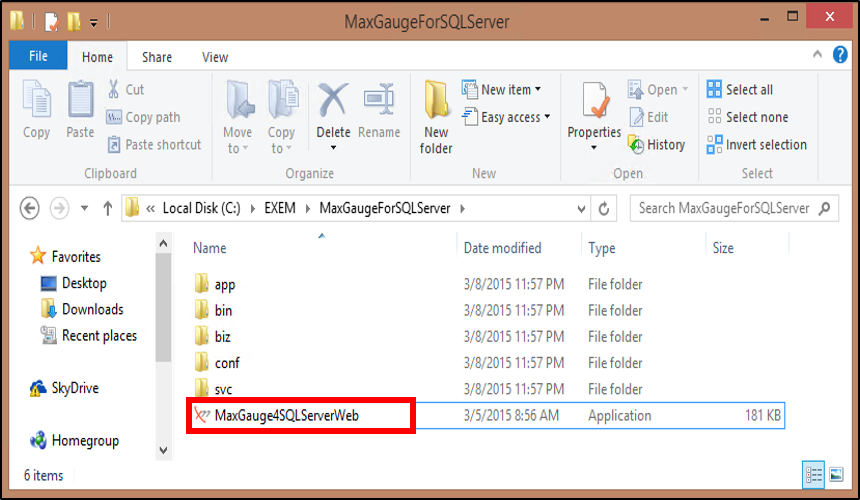
Image. Execution File Path
Service Administrator → Enter the Essential Items in Configuration, Run Repository DB Connect Test
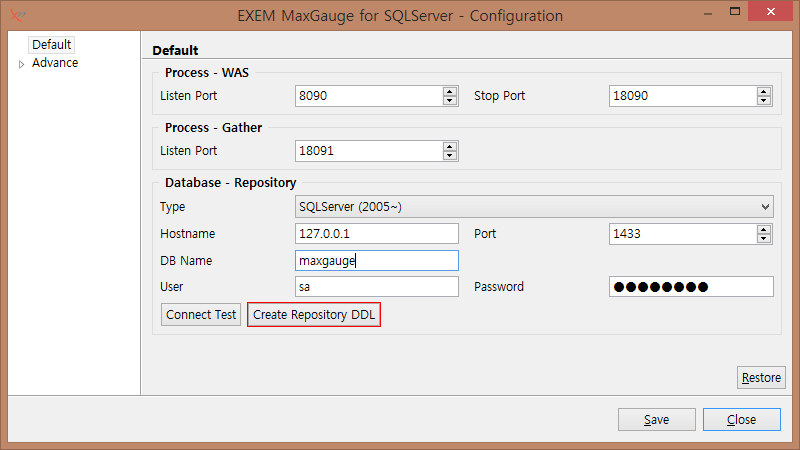
Image. Configuration – Default Settings Screen
Configuration – Default screen content is as follows.
Process – WAS
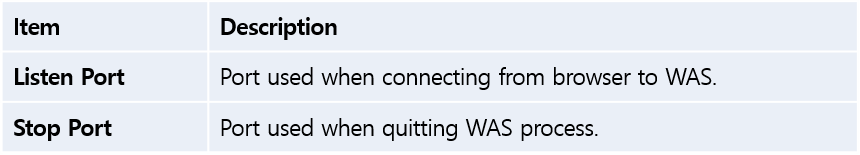
Process – Gather
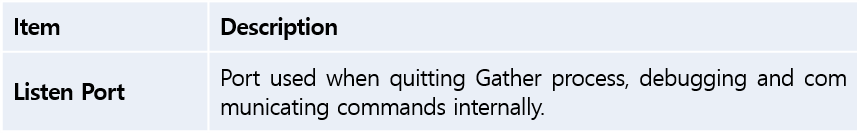
Database – Repository
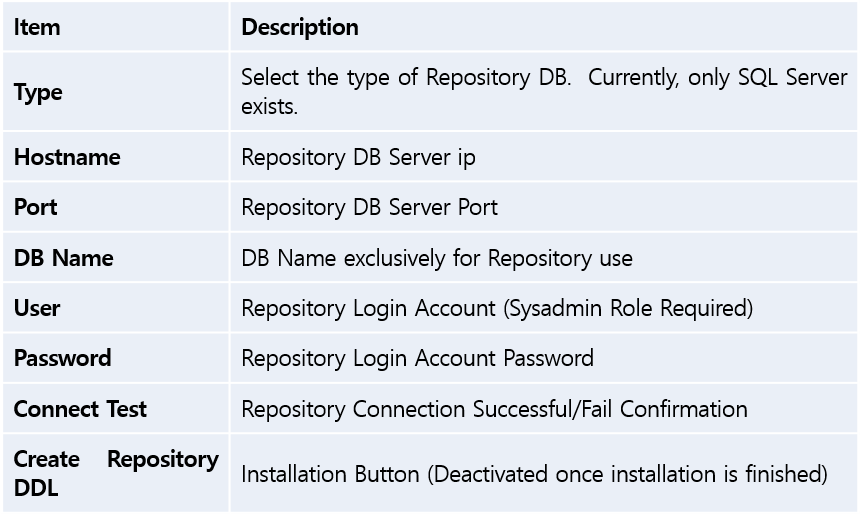
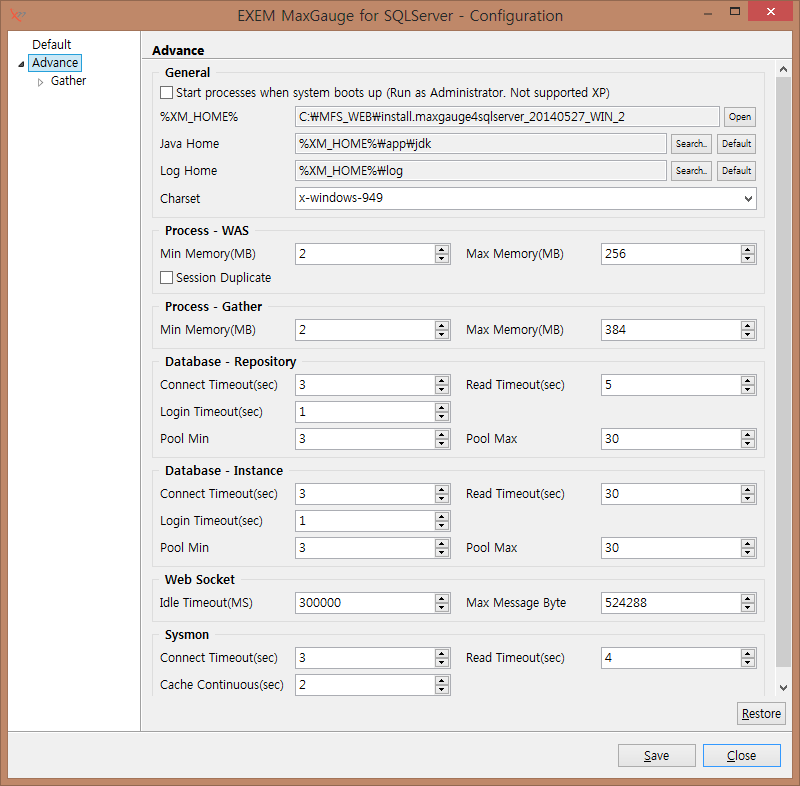
Image. Configuration – Advance Settings Screen
Advanced Menu – Advanced Management Screen content is as follows.
General
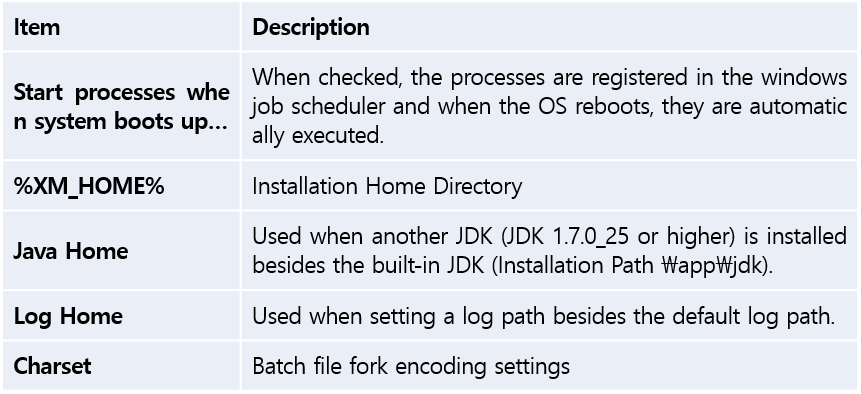
Process – WAS
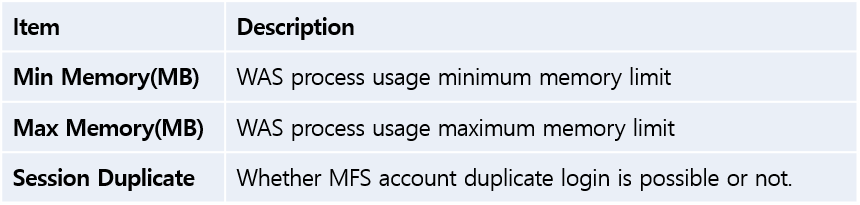
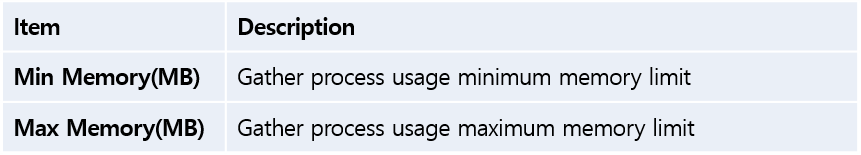
Process – Gather
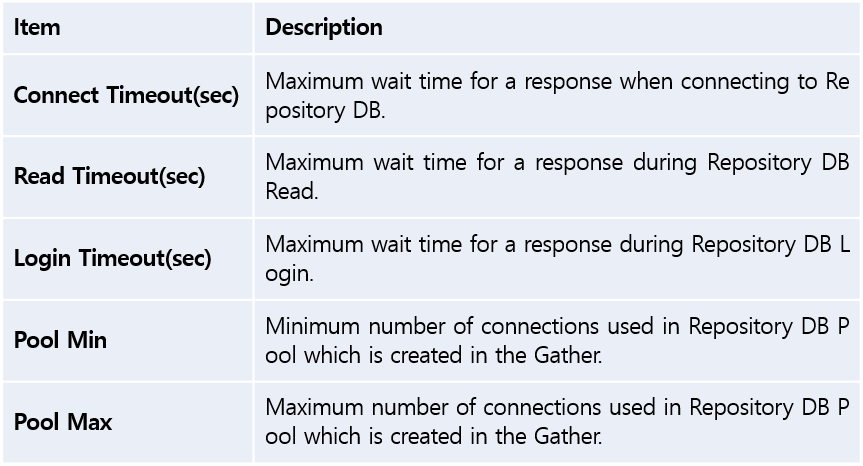
Database – Repository
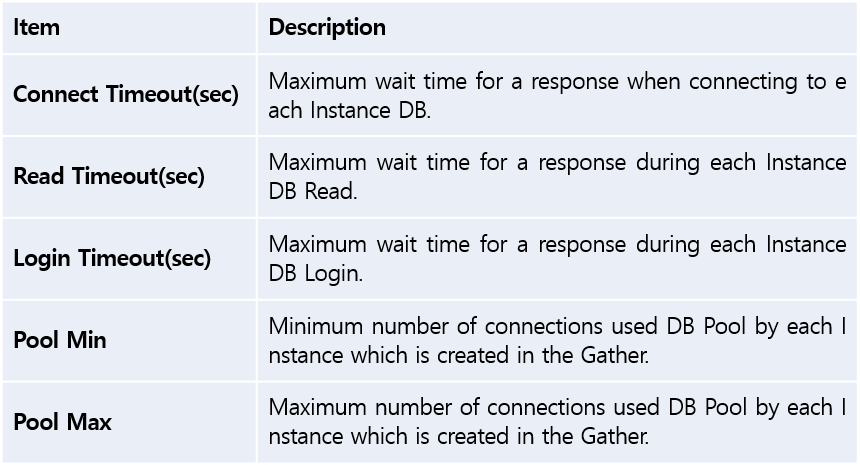
Database – Instance
Web Socket
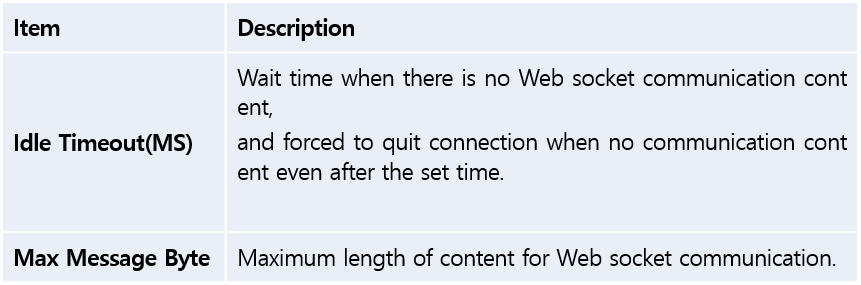
Sysmon
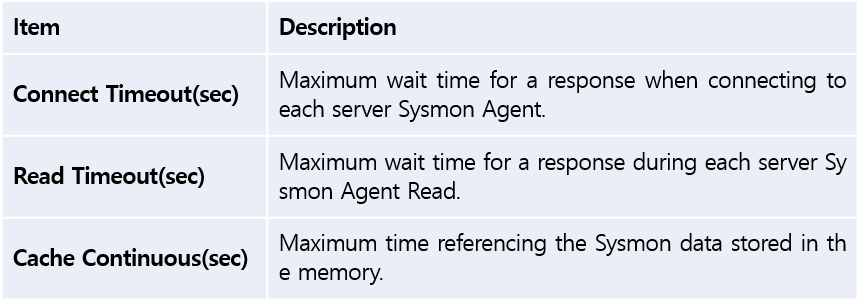
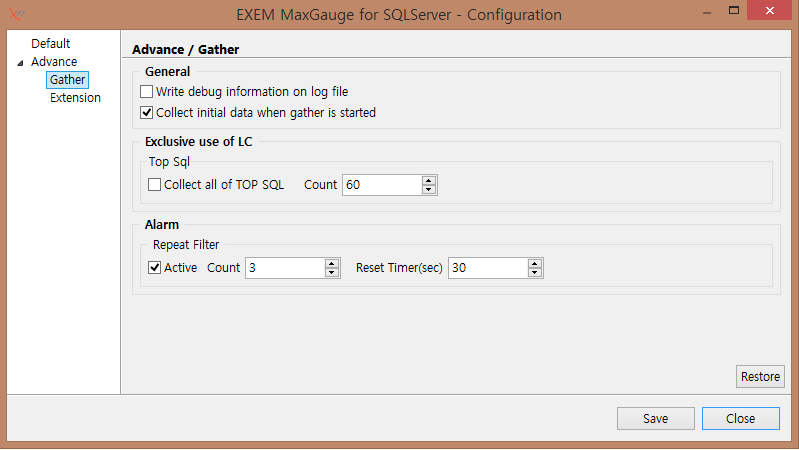
Image. Configuration –Gather Settings Screen
Configuration – Gather screen content is as follows.
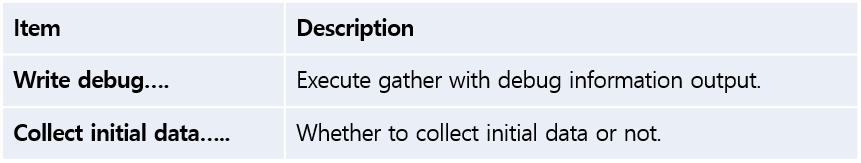
General
Exclusive Use LC
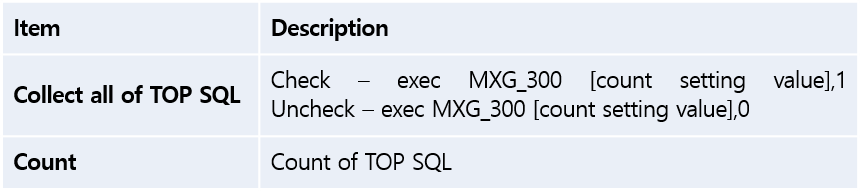
Alert
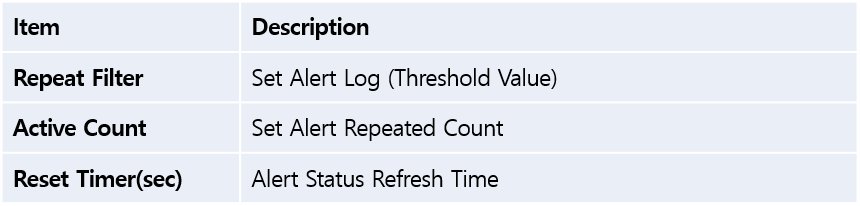
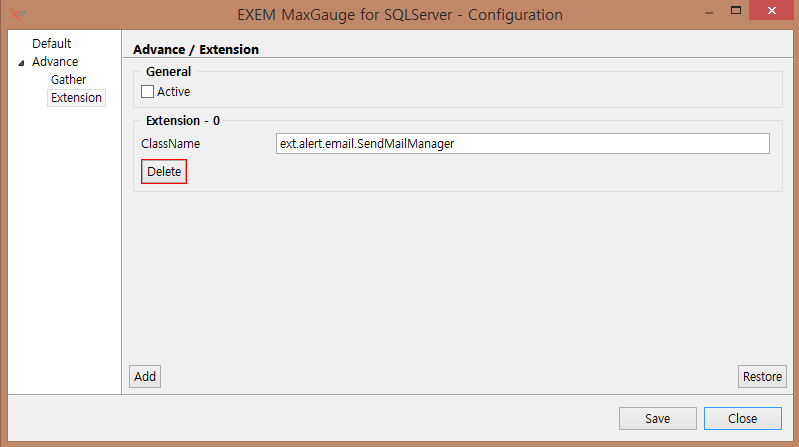
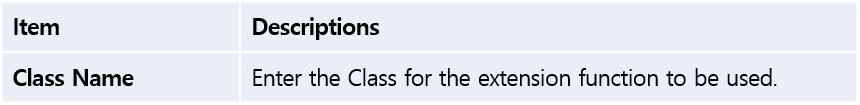
Image. Configuration – Extension Settings Screen
Extension Menu – Extension Plugin Management Screen content is as follows.
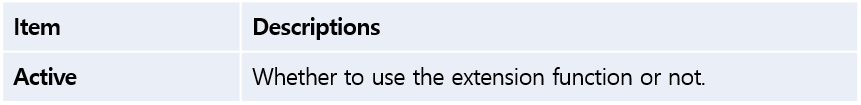
General
Extension – N
Note: Interworking with Alert Mails and even the SNS constructed when installing extension is possible.
Configuration – When Connect Test from the default screen is successful, click the Create Repository DDL button to complete installation.
When the Connect Test on the bottom of the Default Tab is successful, then click the Create Repository DDL button. Then the screen on which you can set the path for the DB File created in MFS will appear. If you keep the ‘Use Root Directory’ checked as in default condition, then the MFS DB File will be created in the SQL Server’s default Data File and Log File path. If you want to set a different path then uncheck the box and enter the desired path in the input box below. Once you’ve entered the path, click on the Create button and a confirmation window will appear and if you click OK, then the Batch program will be executed and DB will be created. After the DB is created, click the Close button to close the Configuration window.
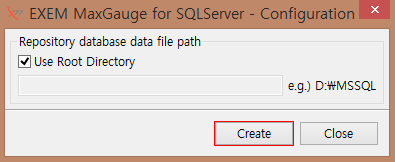
Image. MFS Data File Path Setting Screen
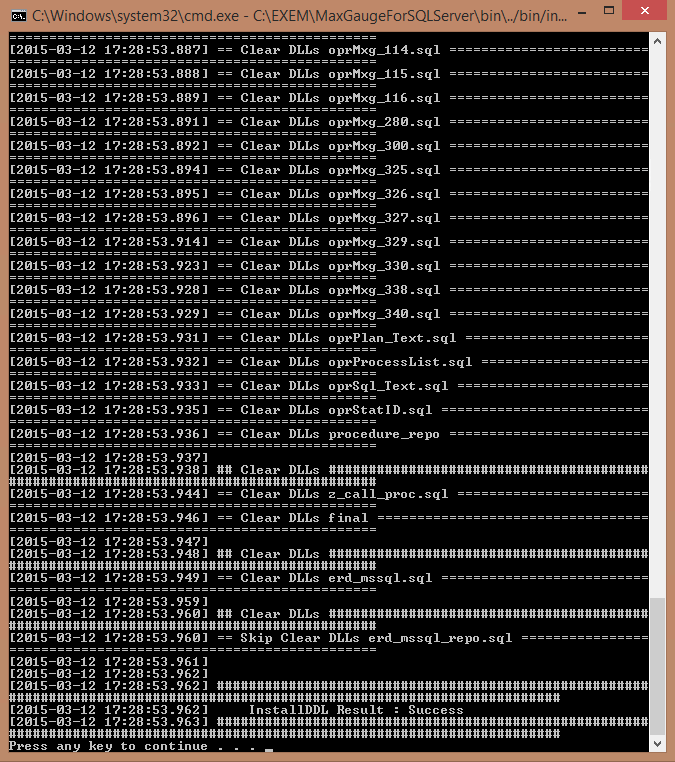
Image. Installation Complete Screen
When the message ‘InstallDDL Result : Success’ appears last, then the installation has been successfully completed.
Back To Top
Target Server Registration
To register the target server, you need to use the Service Manager Admin page.
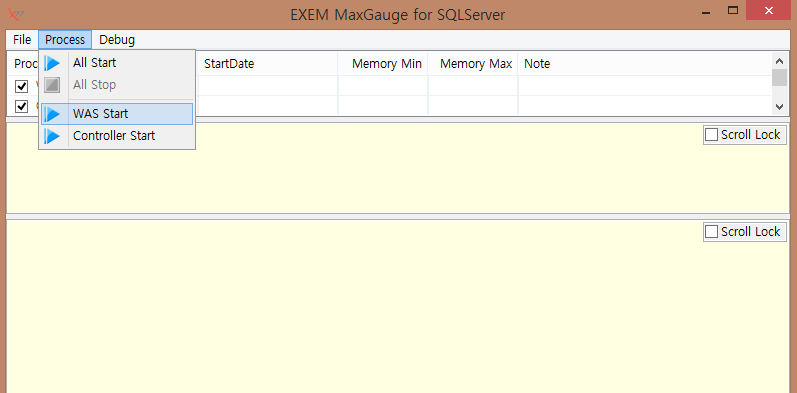
Image. Service Manager (MaxGauge4Web.exe)
Activate WAS Process in the service manager (MaxGague4Web.exe) in the previously installed install.maxgauge path. Once you start WAS Process, you can connect to the web page via Google Chrome. Start Gather Process only when you have completed the server registration.
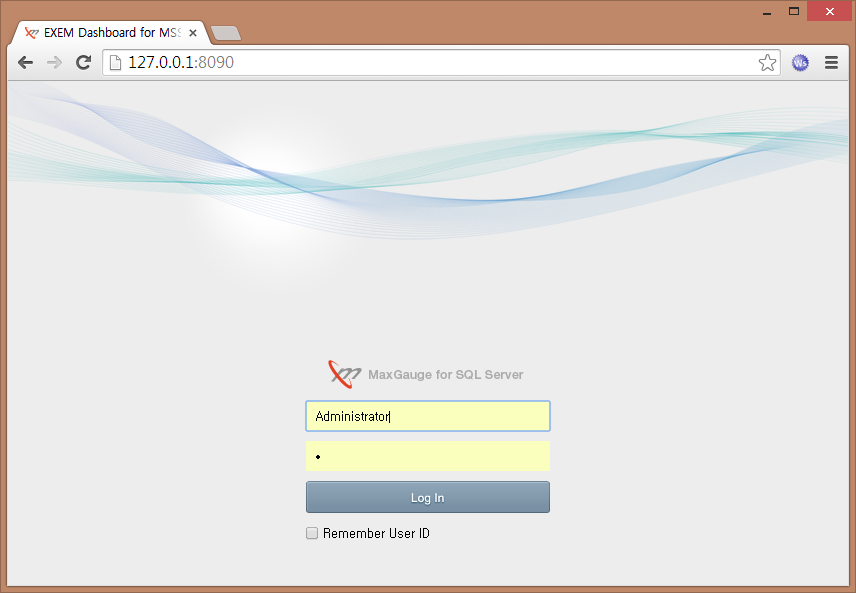
Image. Login Page
Connect to the MaxGauge WAS server using the Port number assigned (ex.127.0.0.1:8090) for the WAS service. Then, login to the Administrator account. Once you are logged in, connect to the Admin Page at the top and go to the server management menu and click the server menu.
Follow the order Login → Admin → Server Management → Server.

Image. Admin Server Page
Click the Add button on the server page and enter the monitoring target server information. Enter the server name, IP address, SQL Server service port, login account with sysadmin permissons, password, and sysmon service port; do the Connect Test to confirm the connection status. Create the stored procedure used in the product through Create Procedure and click the save button to register the monitoring target server.
Once registration is finished, go back to the service manager and stop the WAS service and select All Start. MaxGauge For SQL Server’s monitoring and logging service will now begin.
MaxGauge For SQL Server Installation Process
Through the steps above, you can add a server and begin the service.
Back To Top
Admin (Administrator Page) Instructions
The Admin Page is the place where you can set various settings for the product. There is a menu on the left side and the related page appears in the center.
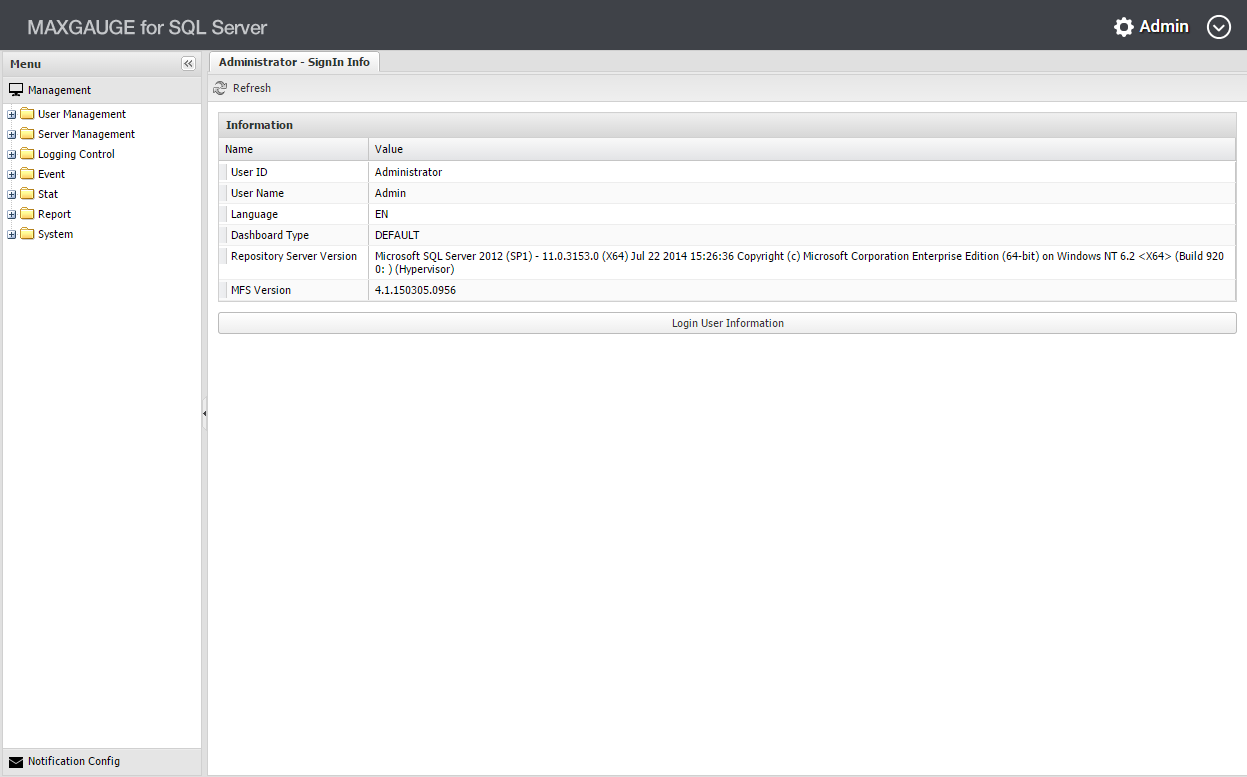
Image. Admin Main Screen
When you click on the ‘Login User Information’ button at the center bottom of Admin’s (Administrator Page) main screen, you can verify and edit the information of MFS account which you are currently logged into.
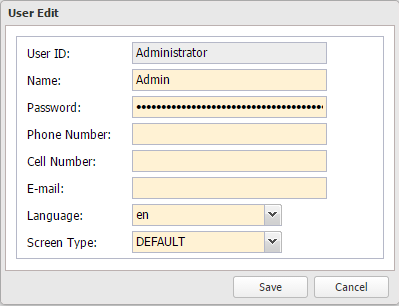
Image. Login User Information Screen
Back To Top
SUB) Management
Setting the menu for the overall operation and management of the product.
User Management
Registers the product user and allocates permissions for using Admin program and functions by each user.
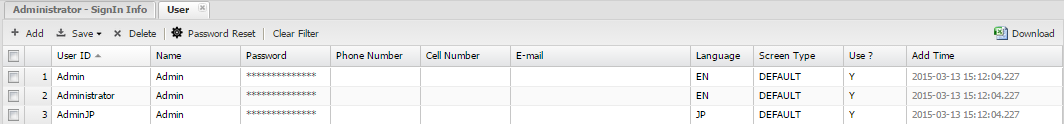
Image. Management – User Management – User Screen
User: Adds and saves the product user.
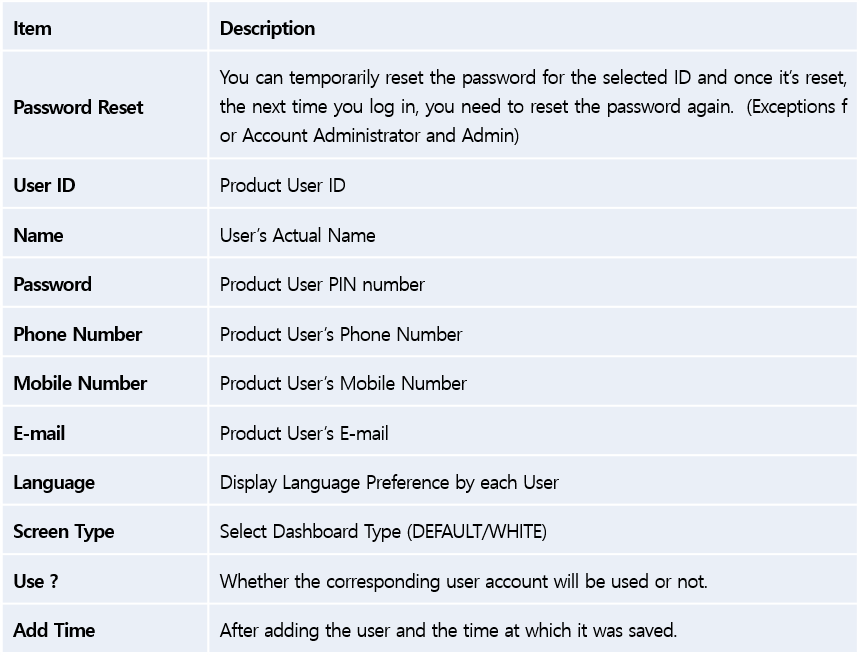
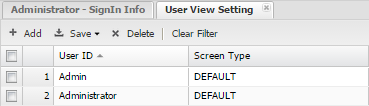
Image. Management – User Management – User View Setting Screen
Screen by User: Set the screen set by each user.
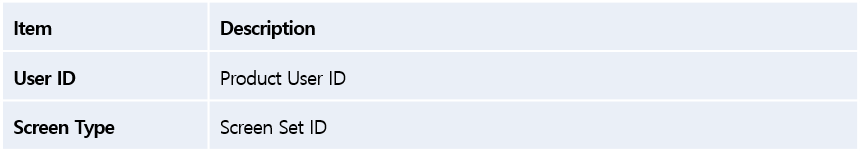

Image. Management – User Management – Program Authorization Screen
Program User Permissions : Set permissions to Add/Edit/Delete on Admin Page’s executing program.

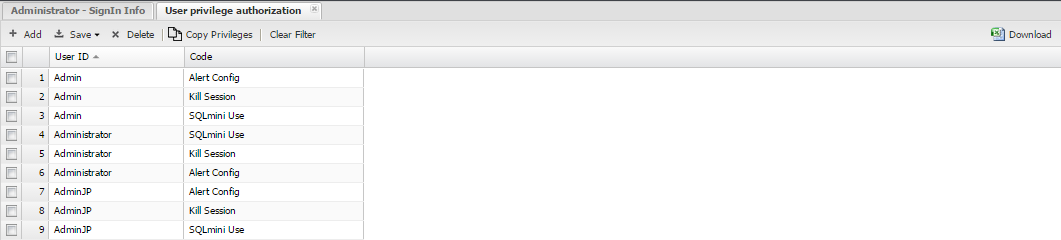
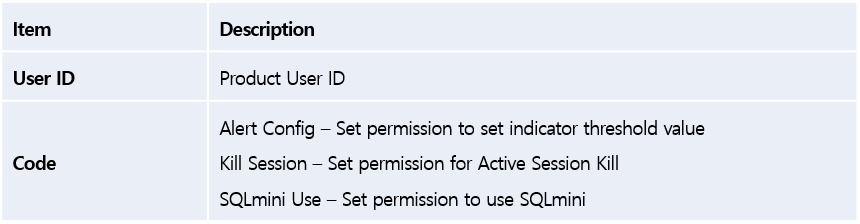
Image. Management – User Management – User Authorization authorization Screen
Function Permissions by User : Authorizes Alert Config/Kill Session Function by Product User.
Server Management
Registers the target DB server to be monitored and determine the Dashboard arrangement.
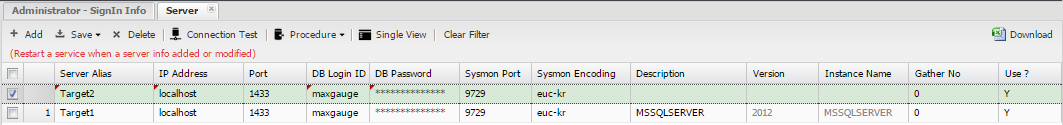
Image. Management – Server Management – Server Screen
Server: Can manage DB Server’s (Instance) Add, Edit, and Delete.
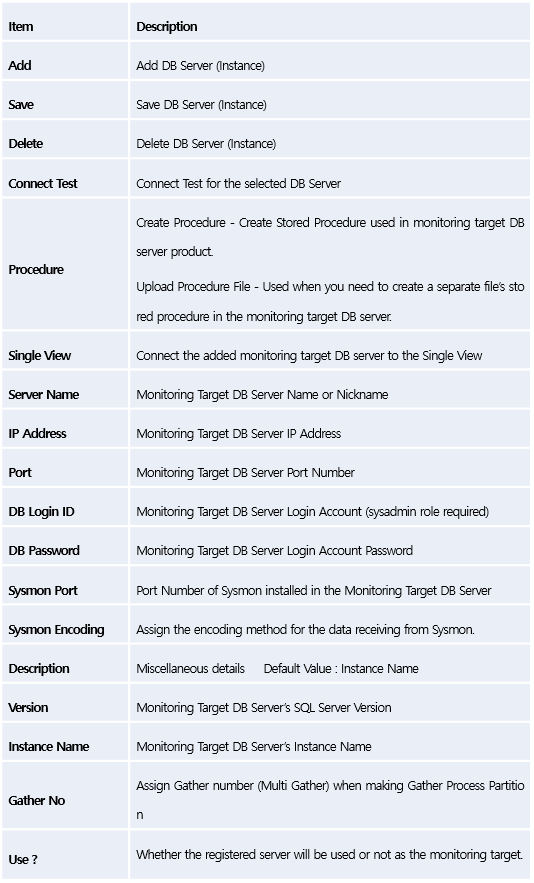
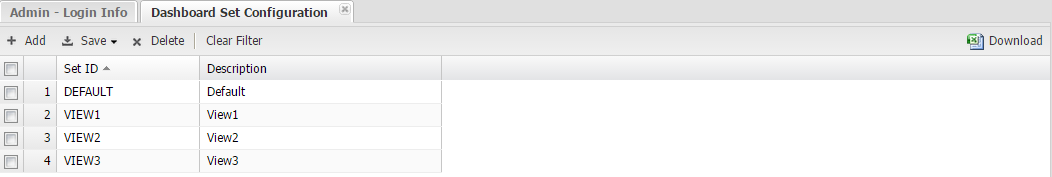
Image. Management – Server Management – Dashboard Set Configuration Screen
Dashboard Screen Set Configuration: Can configure the dashboard screen.
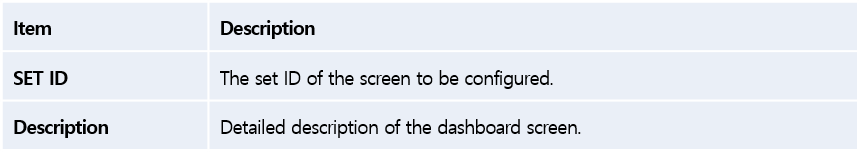
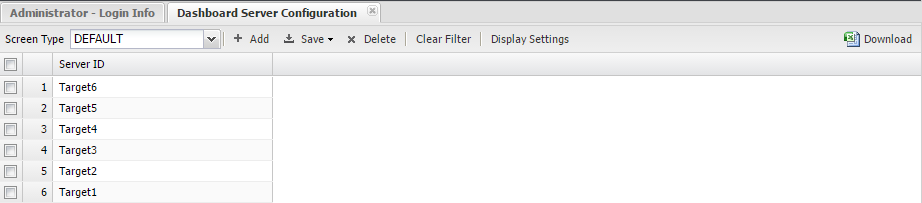
Image. Management – Server Management – dashboard Server configuration Screen
Server Settings by Dashboard Set : Select the Dashboard Screen Type (Default(Black)/White) for each registered server.
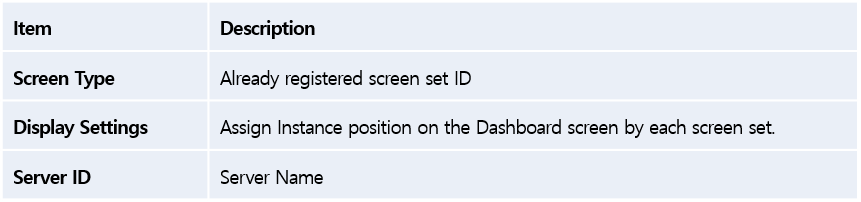
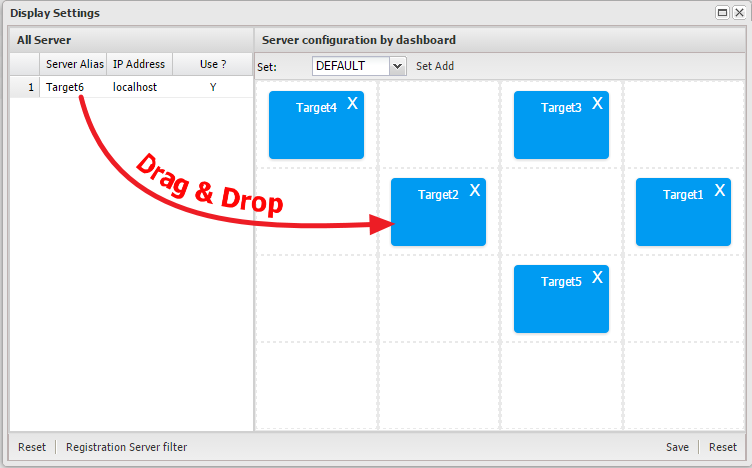
Image. Management – Server Management – dashboard Server configuration –Display Settings by Screen
Settings by Screen : Set Instance position on the Dashboard screen by each screen set.
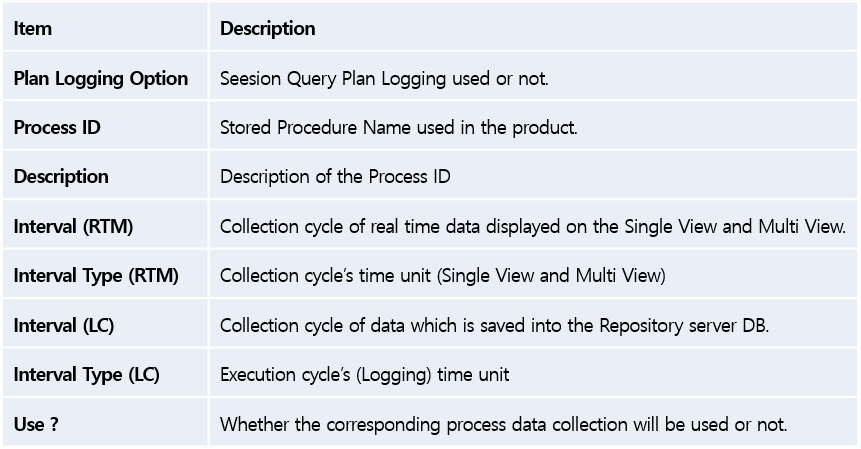
Logging Management
Set the Gather process’ logging collection cycle by function and back-up the collected DB in the repository.
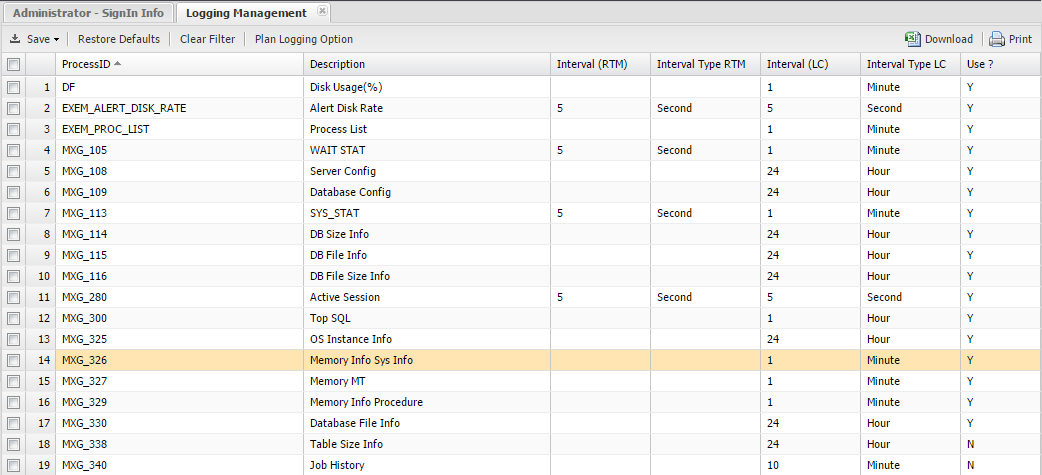
Image. Management – Logging Management – Logging Management Screen
Logging Management: Set the logging collection execution cycle by function.
Item. Management – Logging Management – Sysmon Manage Screen
Sysmon Management: Checks the version of the Sysmon (Agent) which is installed in the target server and updates.
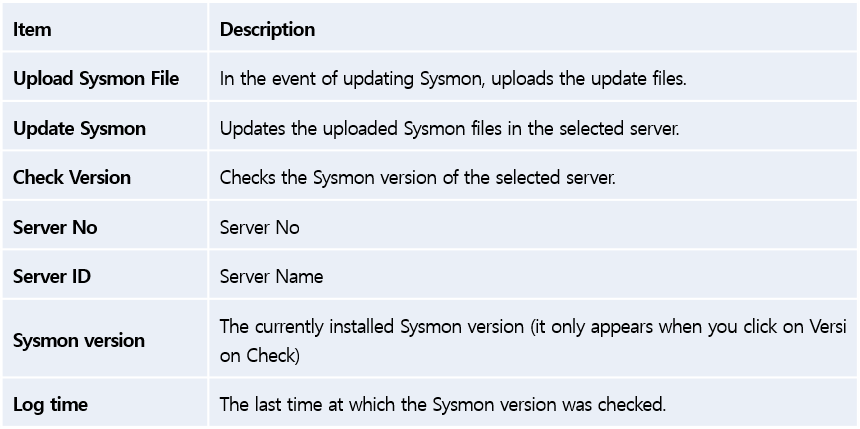
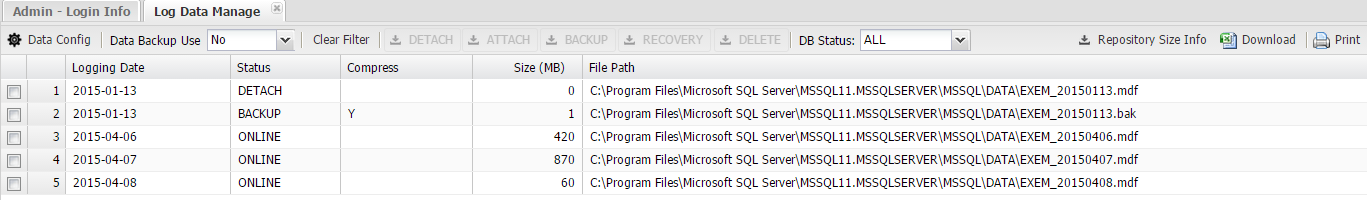
Image. Management – Logging Management – Log Data Manage Screen
Log Data Management: Can check and manage the status of the log database.
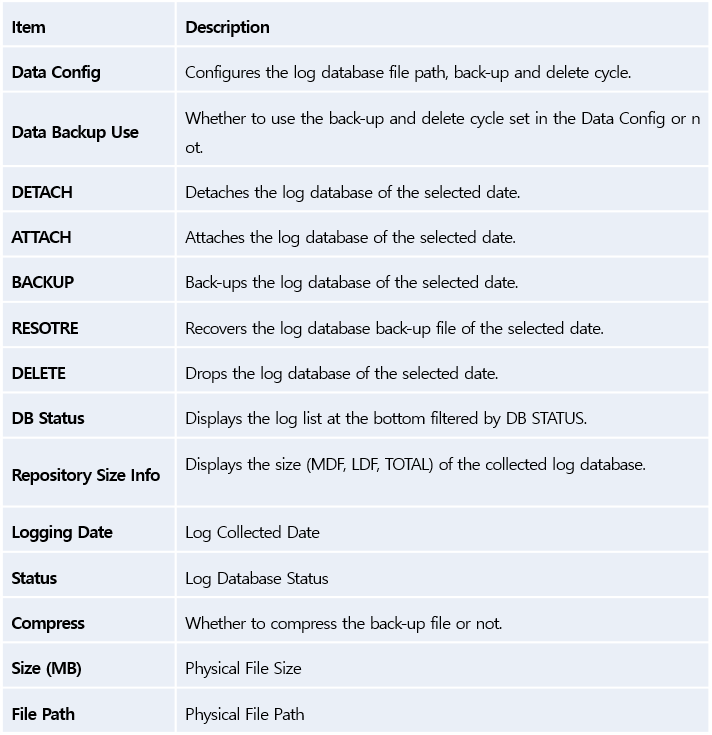
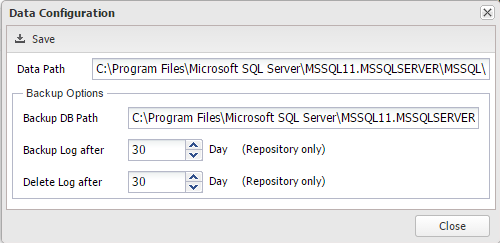
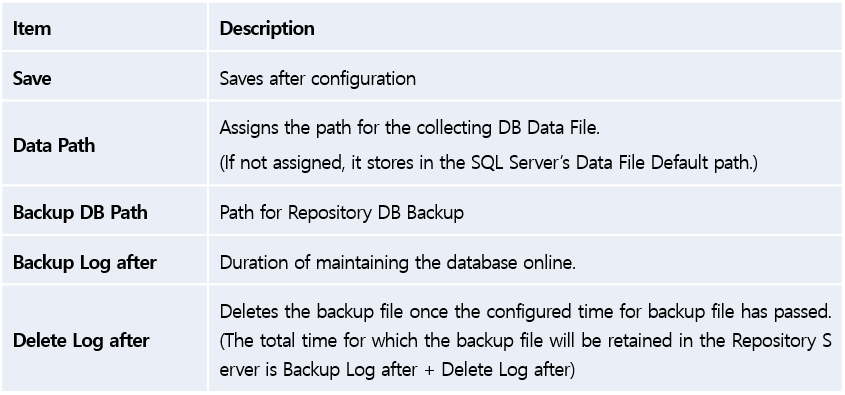
Image. Management – Logging Management – Log Data Manage – Data Config Screen
Data Config : Configures the storage location of the logging data file and the backup schedule.
Event Management
Configures the threshold values of the alarms by each indicator and checks the Windows Event Log and the Alarm records.
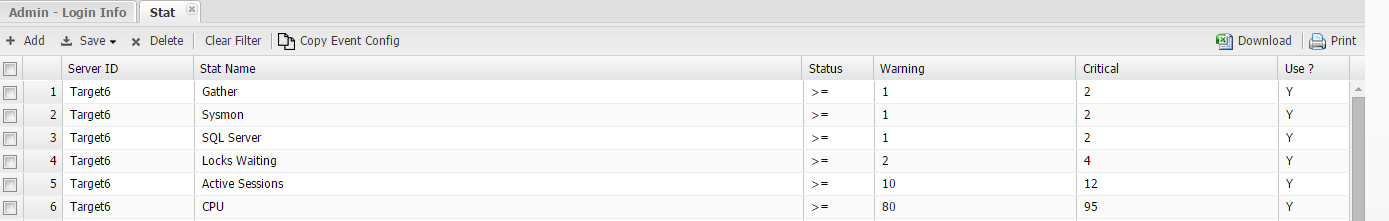
Image. Management – Event Management – Stat Screen
Performance Indicator: Select a server and configure the alarm threshold values in regards to performance indicators.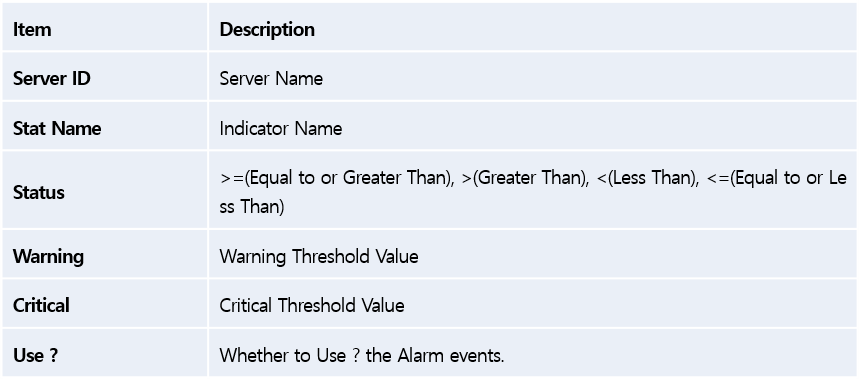
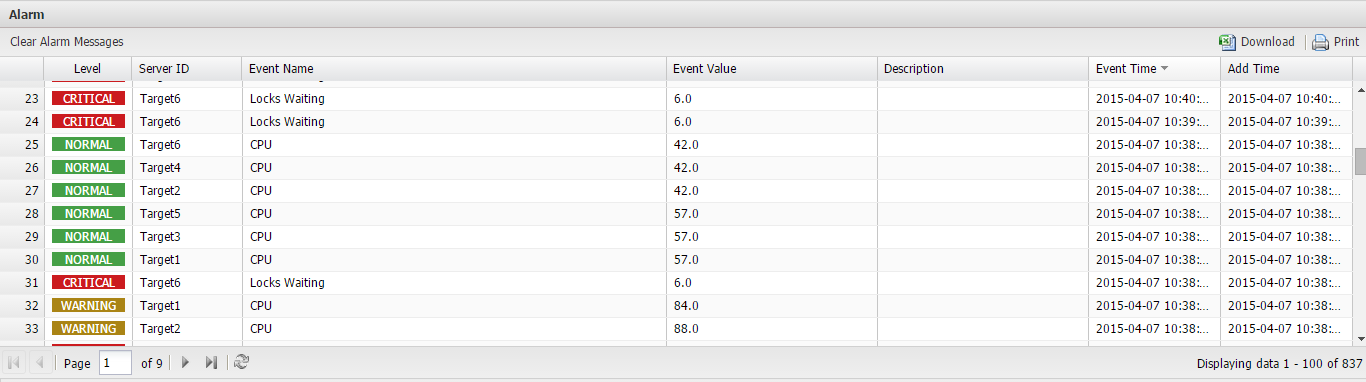
Image. Management – Event Management – Event History – Alarm Screen
Image. Management – Event Management – Event History – Windows Event Screen
Alarm History : Can check the set Alarm Event Log and Windows Event Log of the target servers.
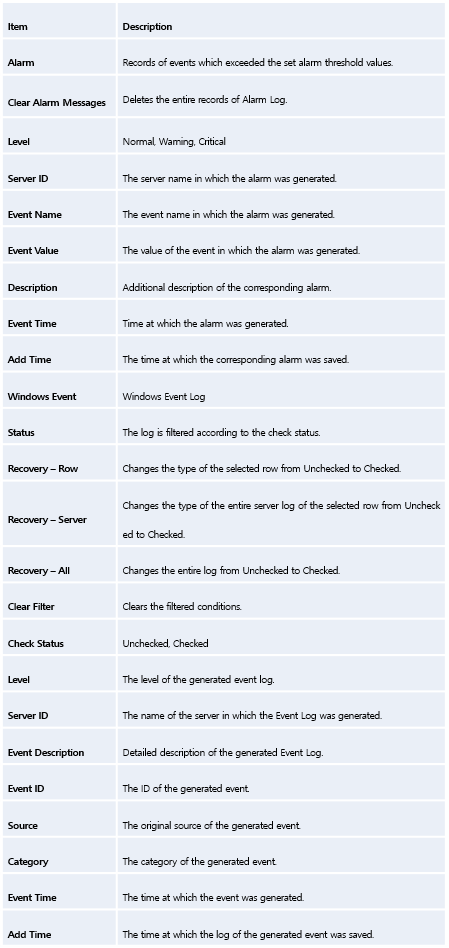
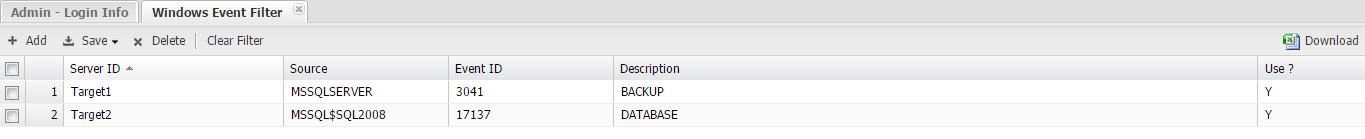
Image. Management – Event Management – Windows Event Filter Screen
Window Event Filter: Registers the events which you do not want to collect from the Windows Event Log, and filters them out.
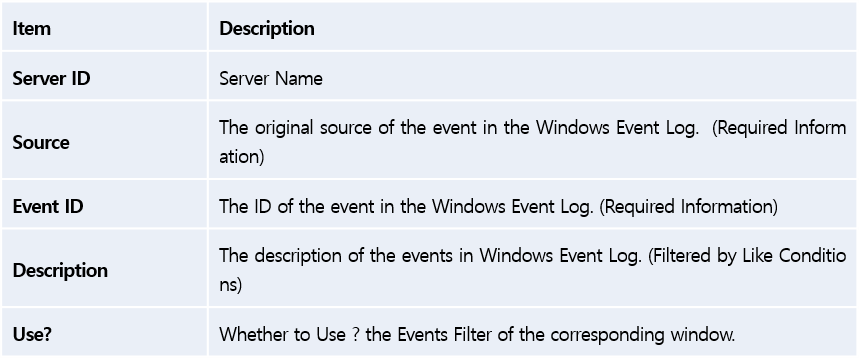

Image. Management – Event Management – Disk Screen
Disk: Configures the alarms on each operating server’s disk by the Drive Letter.
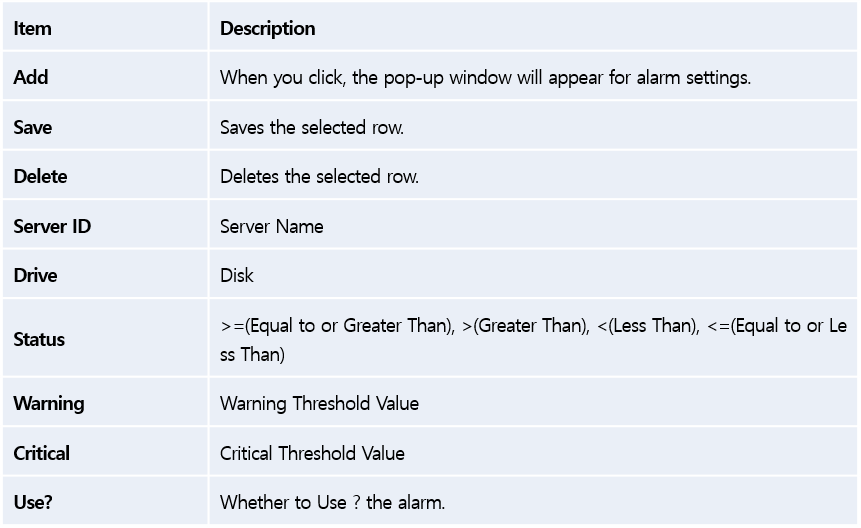
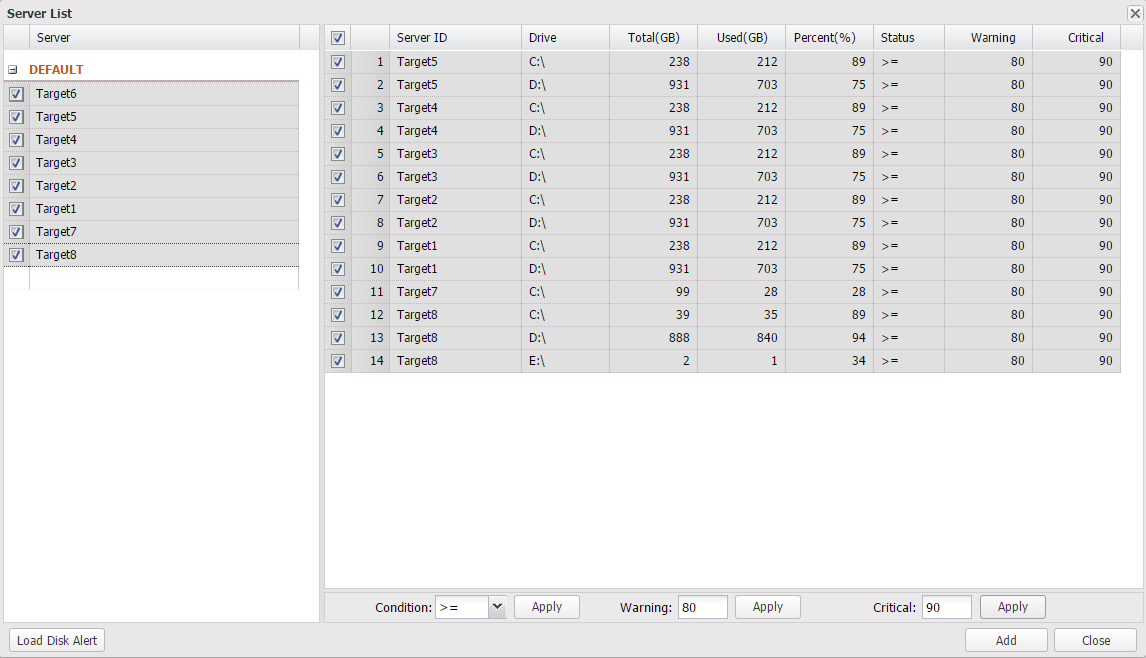
Image. Management – Event Management – Disk Screen (Click on Add, and the pop-up window will appear.)
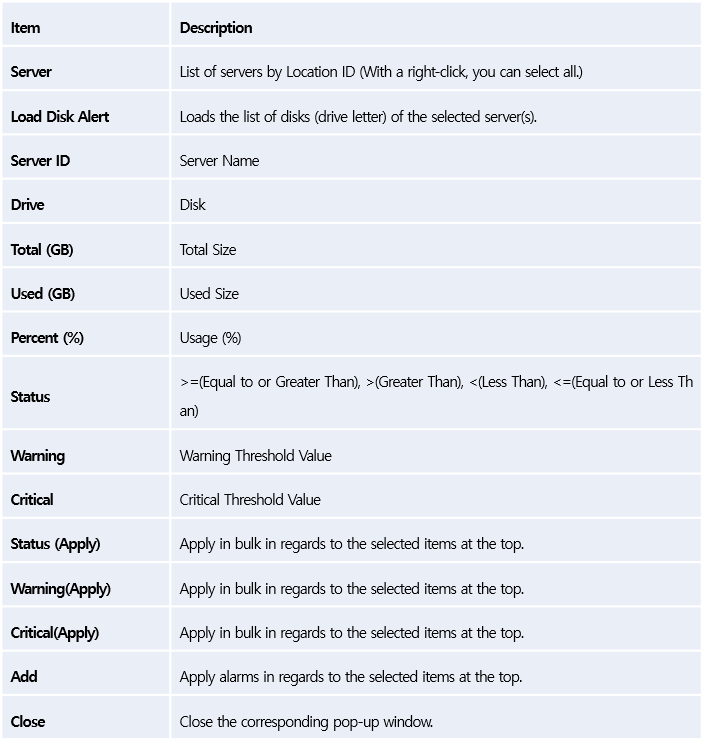
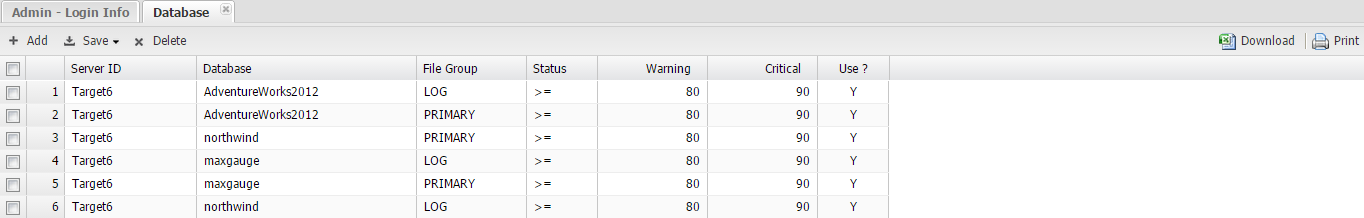
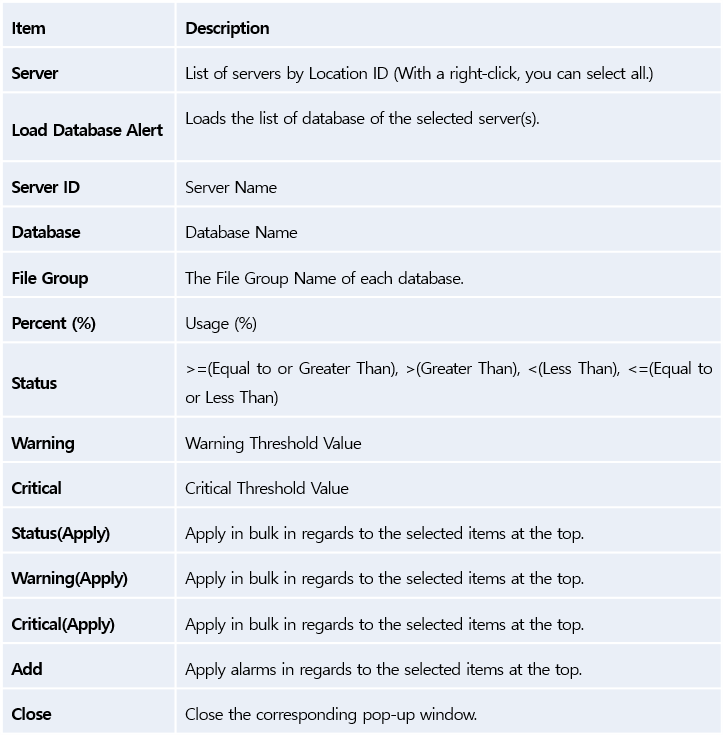
Image. Management – Event Management – Database Screen
Database: Sets the alarms by the database of each operation server.
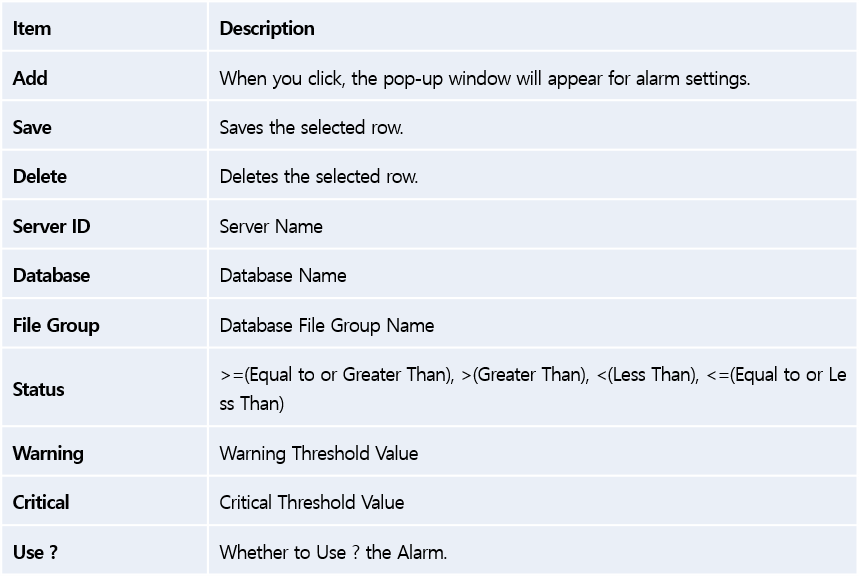
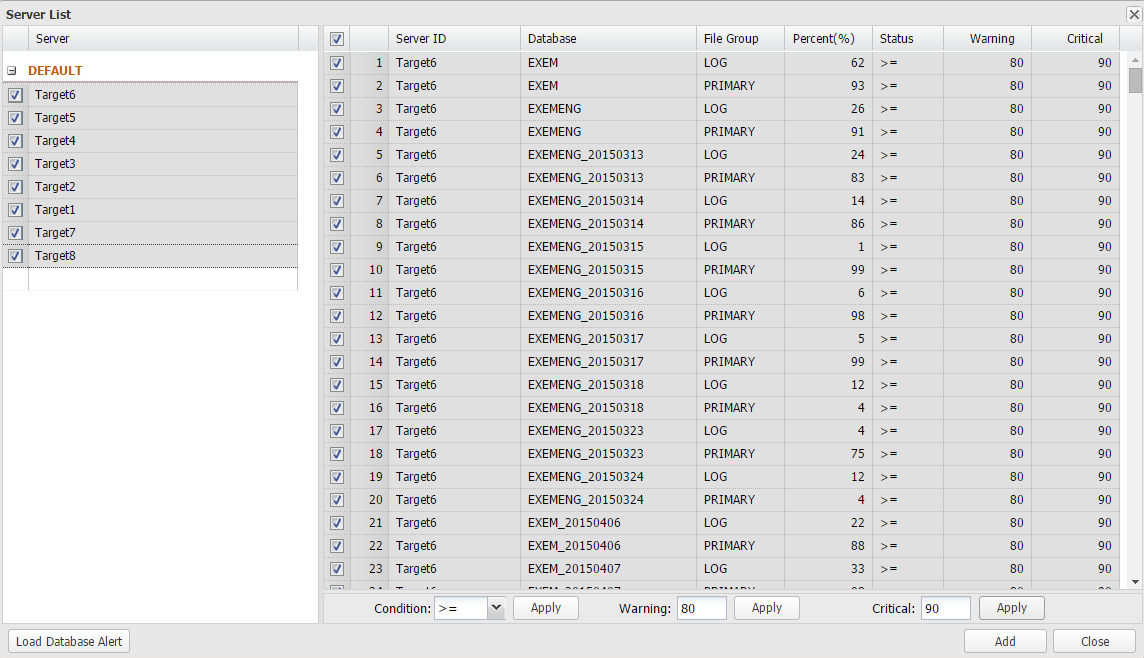
Image. Management – Event Management – Database Screen (When you click on Add, the pop-up window appears)
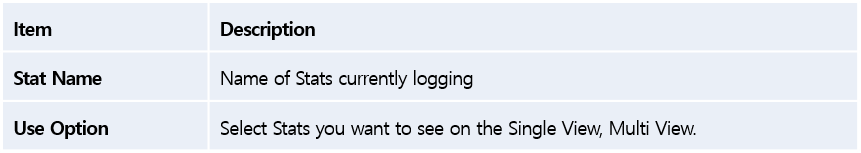
Stat Management
Select Stats you want to see on the Trend View(Single View, Multi View).
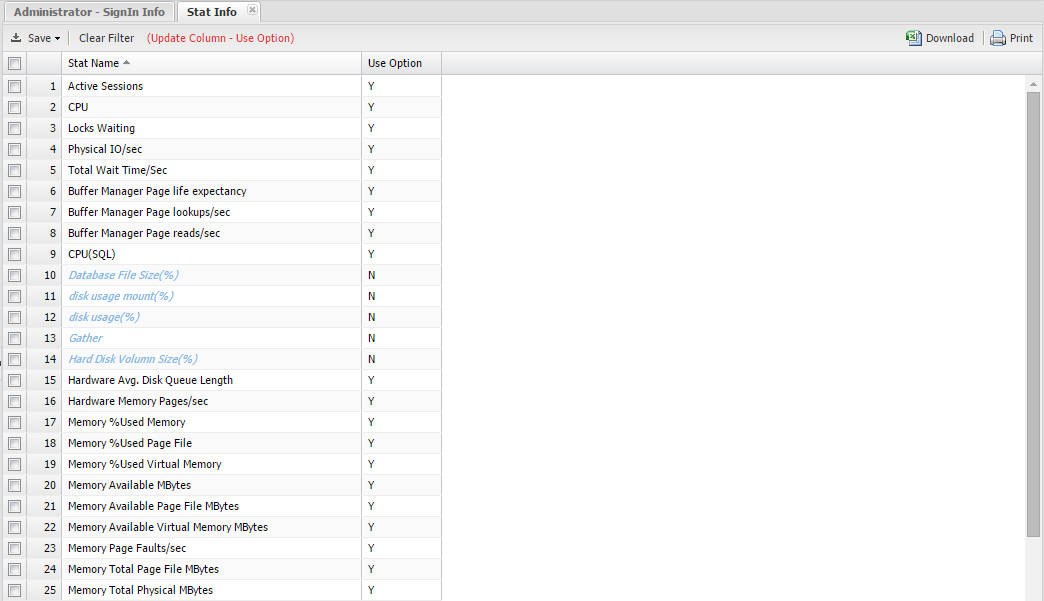
Image. Management – Stat Management – Stat Info Screen
Indicator Information: Check the indicators you want to check on the Single View.
Report
Outputs various information necessary for operation and management.
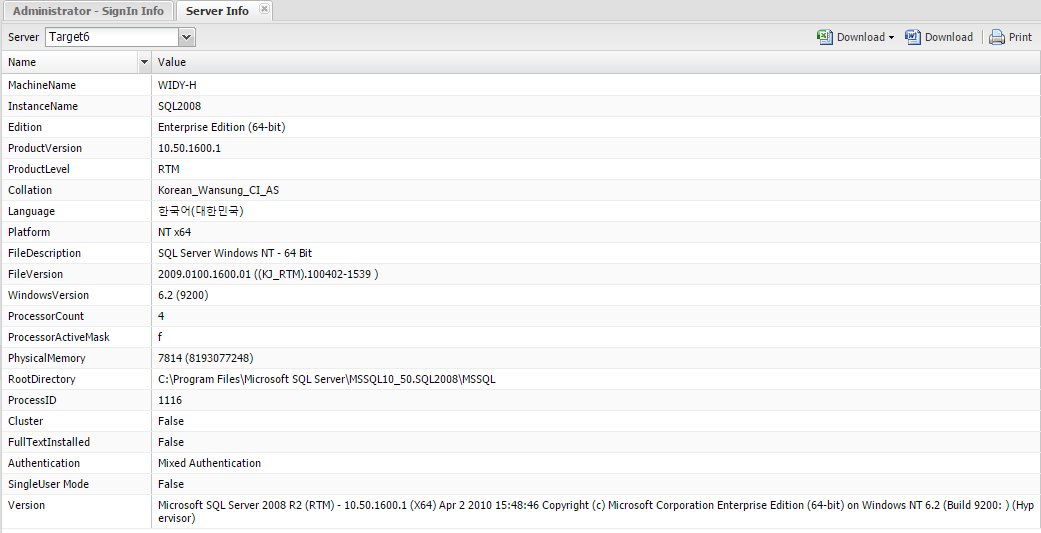
Image. Management – Report – Server Info ~ Job Info Screen
Report: You can select and output the desired server information.
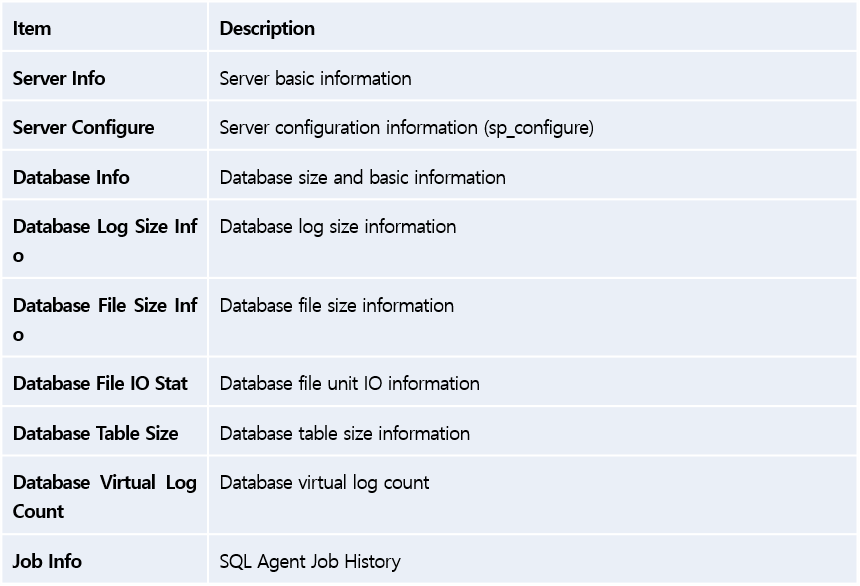
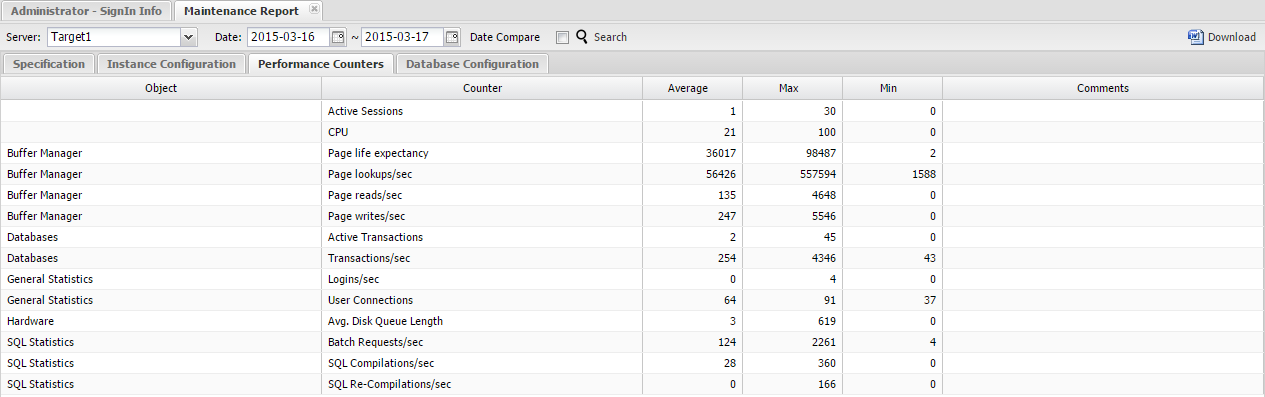
Image. Management – Report – Maintenance Report Screen
Maintenance Report: Monitoring Target Server Inspection Report
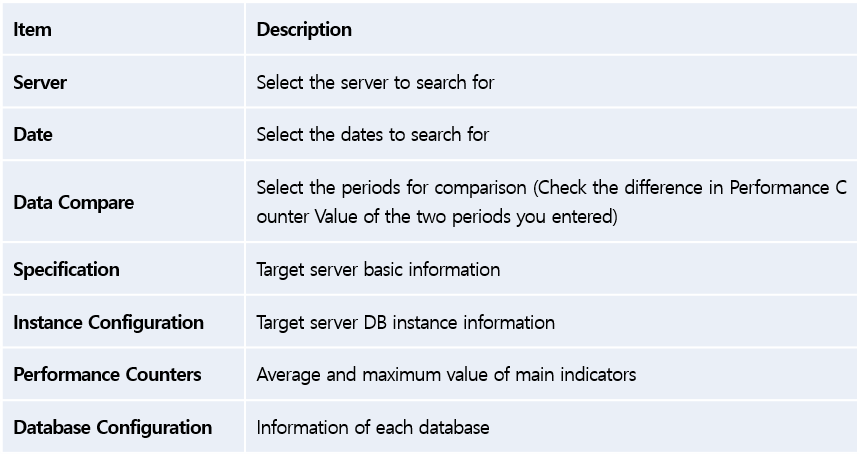
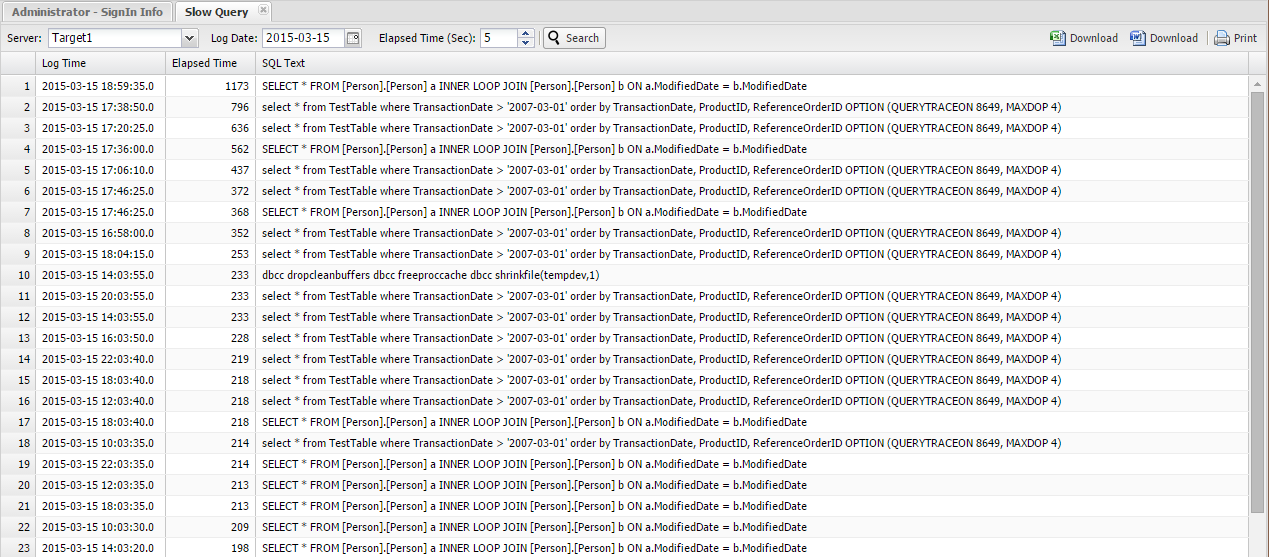
Image. Management – Report – Slow Query Screen
Slow Query: Search queries whose elapsed time is long by date
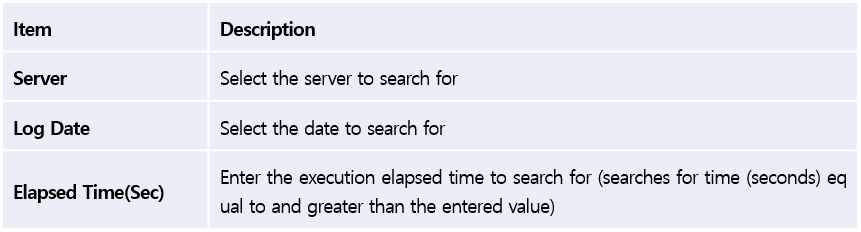
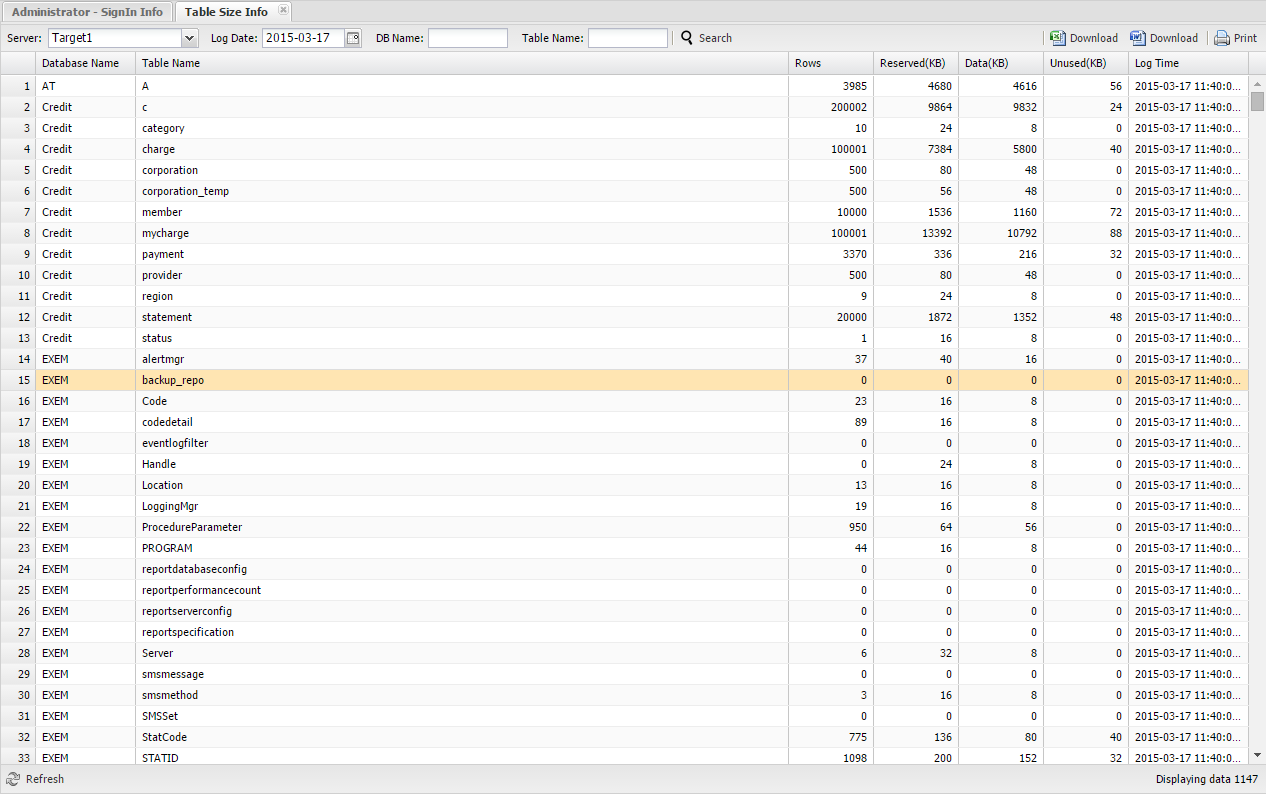
Image. Management – Report – Table Size Info Screen
Table Size Info : Each Operation Server’s Table Size Information
(You must mark ‘Y’ for Use ? of MXG_338 on the logging management screen.)

Image. Management – Report – Script Manager Screen
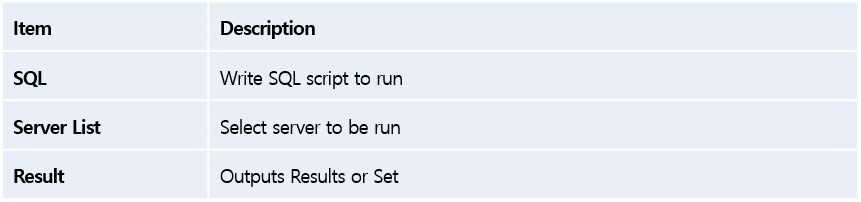
Script Manager : Write and run SQL script to be run in each operation server. (You may choose the server)
System
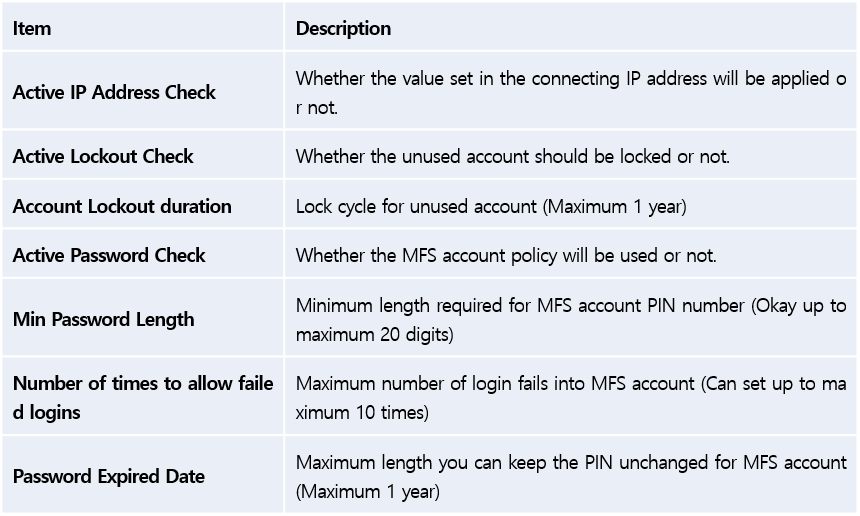
You can manage login policy required for MFS access and IP blocking.
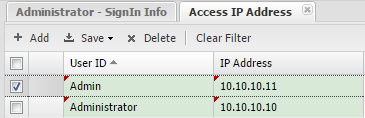
Image. Admin – System – Connecting IP Address Screen
Connecting IP Address: Function for setting specific account allowed to connect to MFS + IP
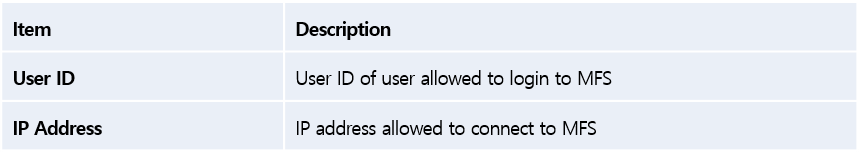
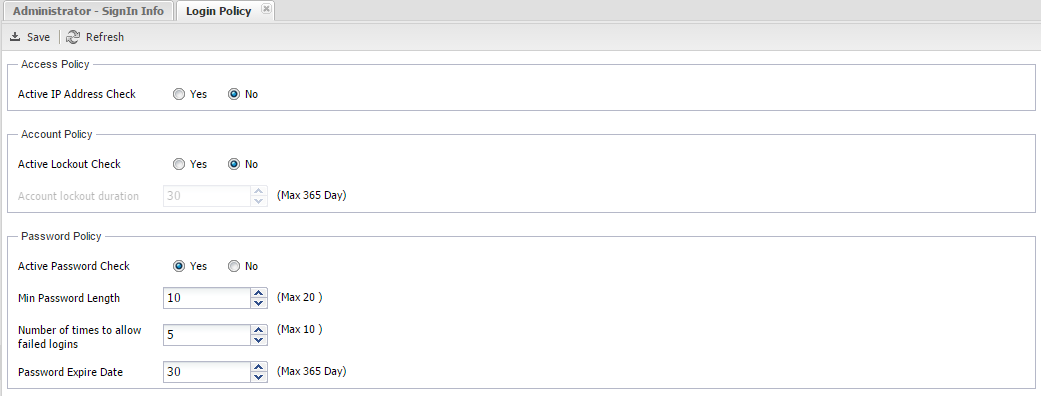
Image. Management – System– Login Policy Screen
Login Policy : Just like Windows(OS) account policy, you can set policy for MFS account.
Back To Top
SUB) Notification Config
You can set Alarm Mail Sending settings or Windows Event Log settings on this menu.
(When you click on the Notification Config item on the left bottom, the menu will be activated.)
Setup send
You can set the Mail Sending settings for email notification of alarms generated in MFS.
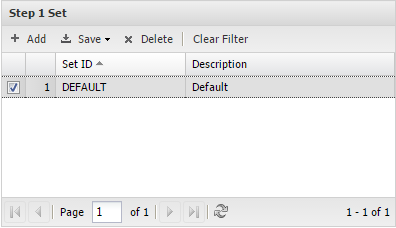
Image. Notification Config – Setup send – Step 1 Set Window
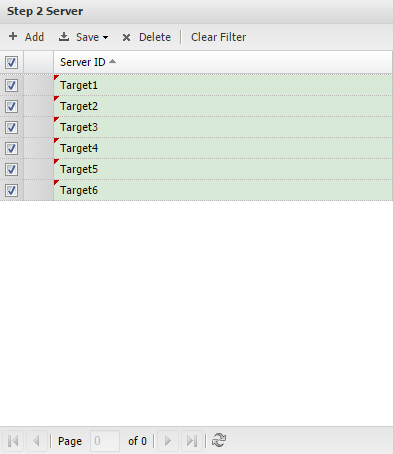
Image. Notification Config – Setup send – Step 2 Server Setup Window
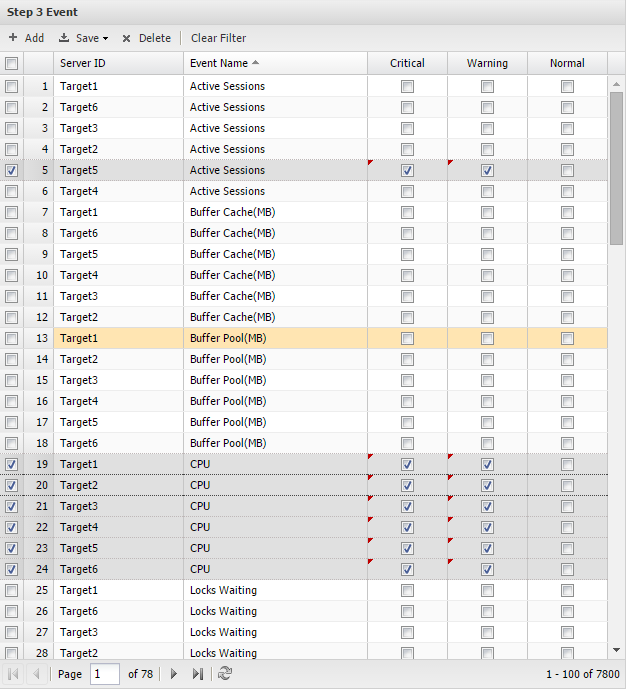
Image. Notification Config – Setup send – Step 3 Event Setup Window
Sending Set Settings: You can setup the notifications on to MaxGauge Repository server to which the notification will be sent. The notifications contain the indicators name and alarm level. There are 3 steps to this process and you must configure each step to move to the next step.
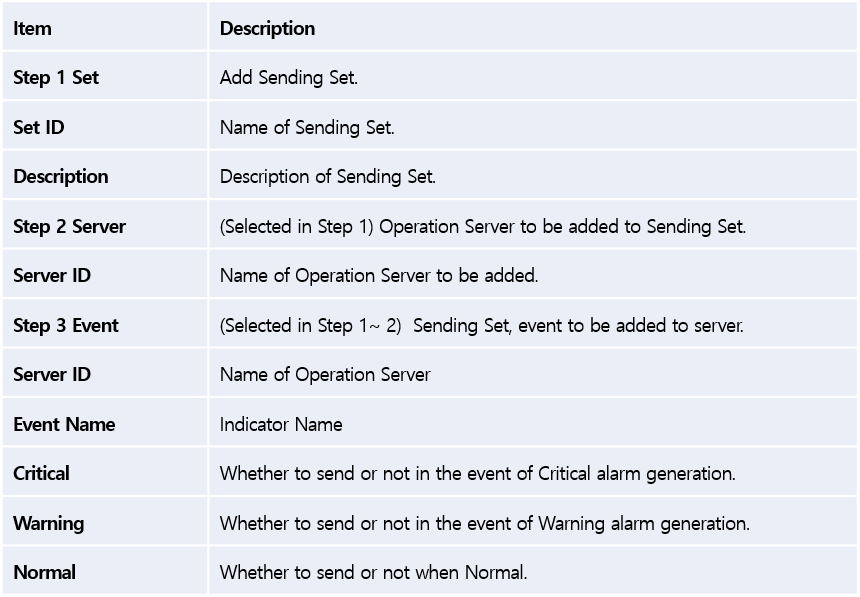
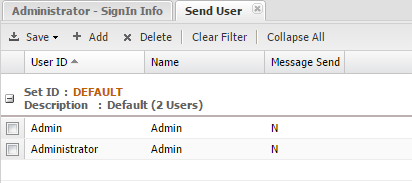
Image. Notification Config – Setup send – Send User
Mail Recipient Settings : You can set mail recipients (MFS Account) according to each set (group) set for the mail Sending Set settings.
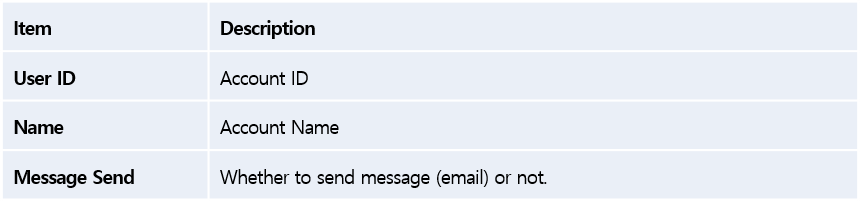
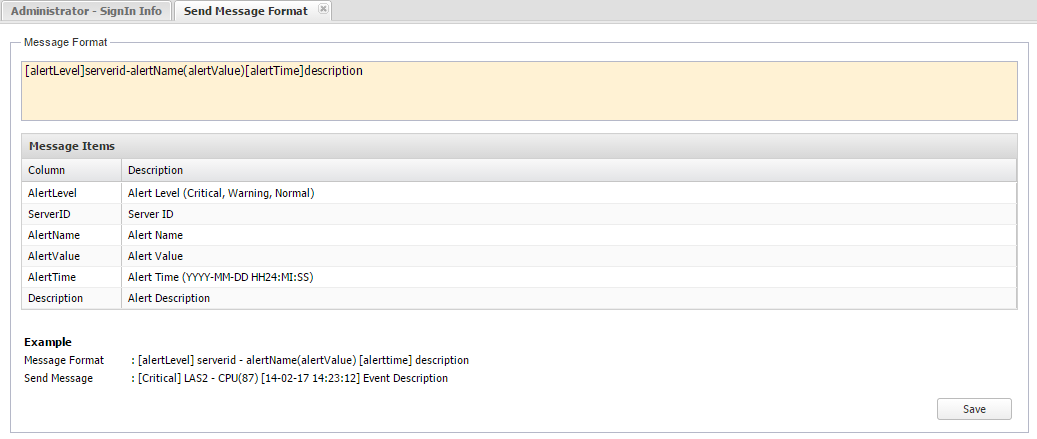
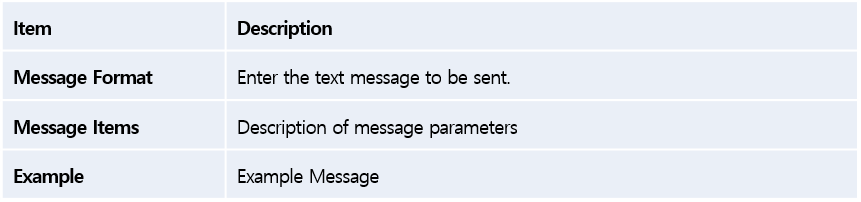
Image. Notification Config – Setup send – Send Message Format Screen
Message Sending Settings: You can set the message text to be sent via email.
Email, Windows Event
You can set the email SMTP server and settings for Windows event log of each operation server for alarms generated in MFS.
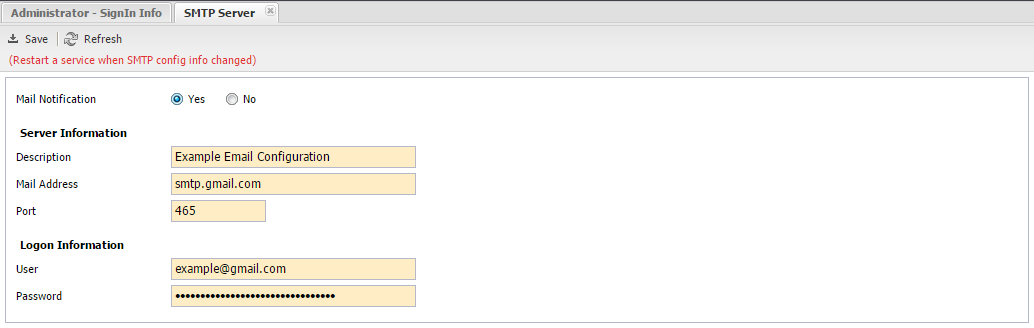
Image. Notification Config – Email, Windows Event – SMTP Server Screen
SMTP Server: You can set the SMTP server for the Email function. (When you change the settings information, you must restart Gather.)
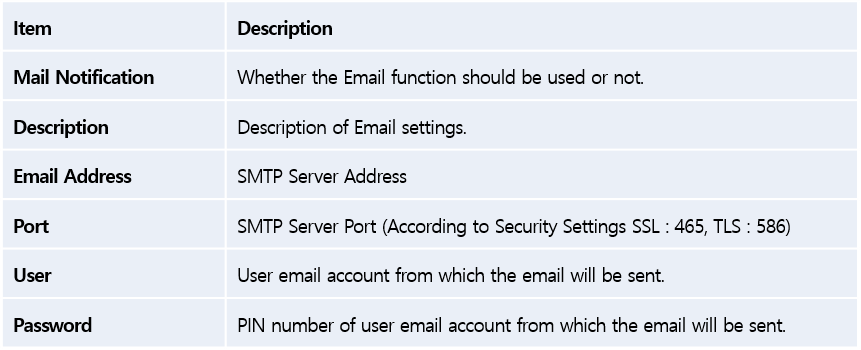
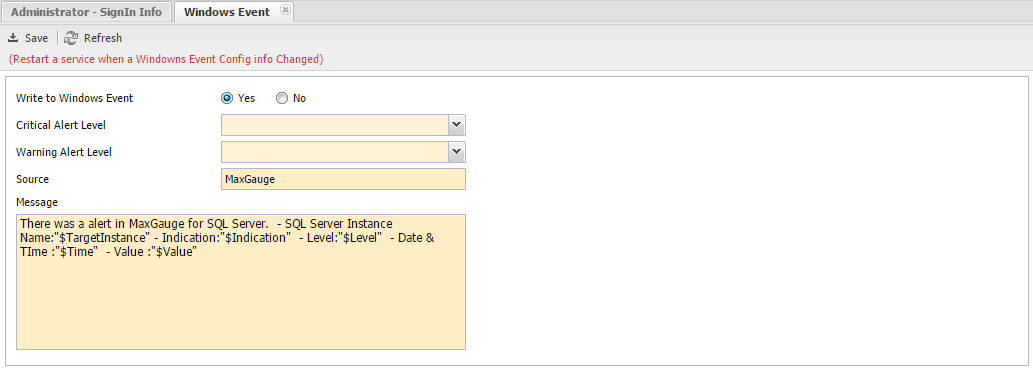
Image. Notification Config – Email, Windows Event – Windows Event Screen
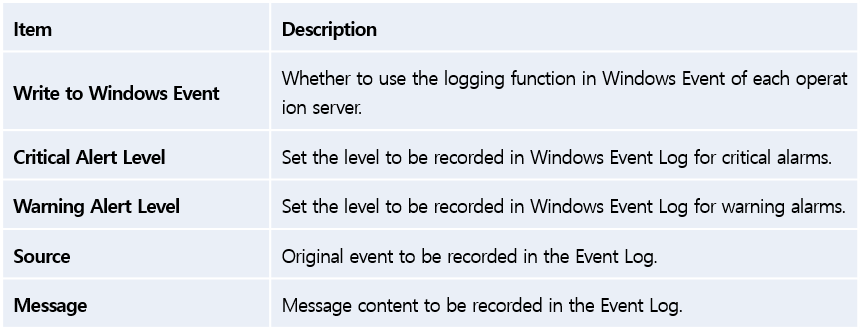
Windows Event: You can set how the alarms generated in Windows Event of each operation server will be recorded. (When you change the settings information, you must restart Gather.)
Back To Top
MAIN) 5. Dashboard
Back To Top
Main Screen
Dashboard initial screen is as follows: There two types background screen – Default (Black) and White.
The screen is largely composed of 3 sections. At the top section, you will find the current time and the main menu, on the left section, you will find the event related windows, and in the main section, you can check the instance status.
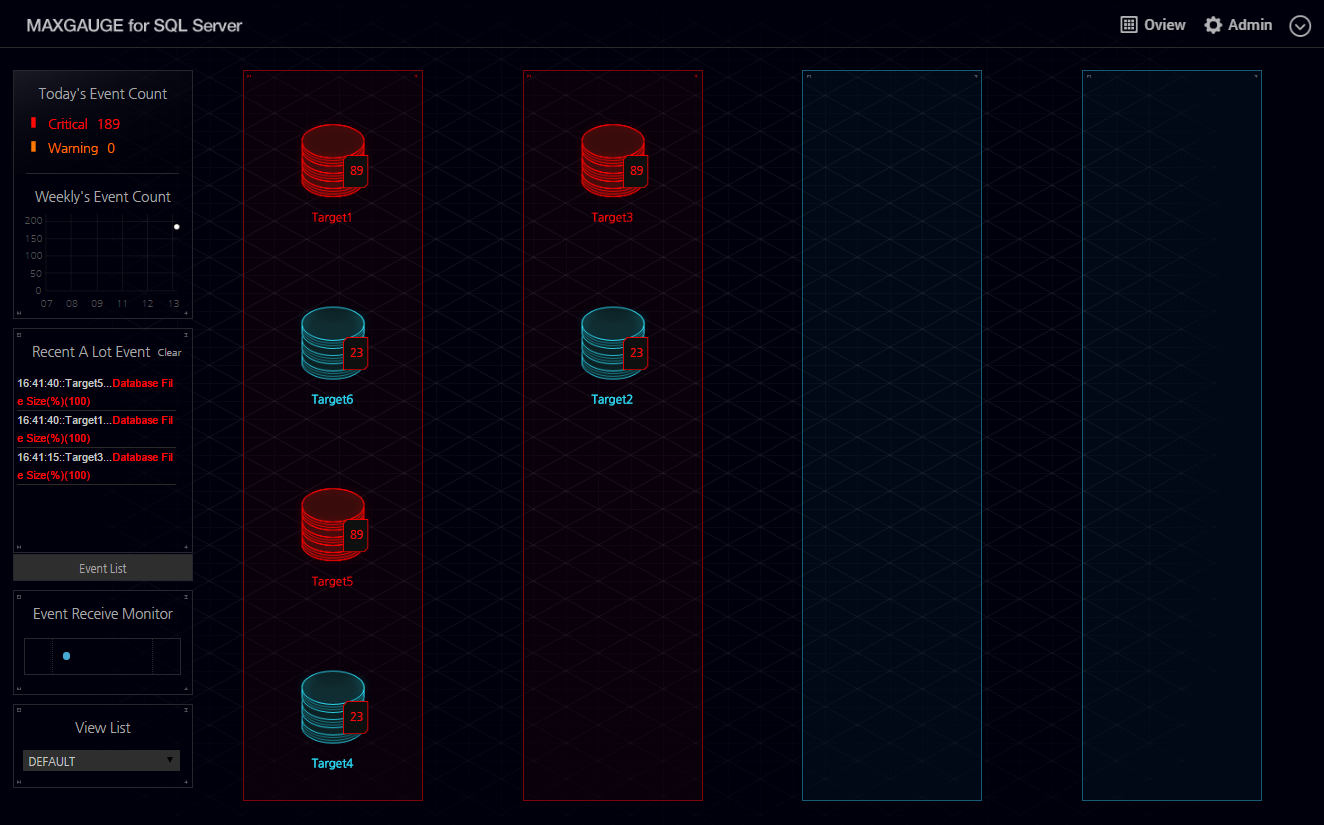
Image. Dashboard Main Screen (Default)
Back To Top
Daily Number of Events Generated / Weekly Number of Events Generated
Daily Number of Events Generated section displays the count of alarms (critical / warning) generated within one day.
Weekly Number of Events Generated section displays the count of alarms (critical only) generated during one week in a graph format.
Back To Top
Recent Alarm Generation Area
The Recent Alarm Generation section displays the time and description of the recently generated alarms. It displays up to 50 alarms in the list, in the order of most recent activity. When you click the Clear button, the list will be cleared.
In the event the Alert set indicator exceeds the threshold value, it displays the information in ‘Hour:Minute:Seconds::Server Name…Indicator(Value)’ format, and indicates yellow for warning, red for critical.
It also indicates the Windows Event by level. (Does not collect event information). It displays in the same format as the alarm, ‘Hour:Minute:Seconds::Server Name…Indicator(Value)’.
For an alarm, when it returns to normal value, alarm indicator will disappear. For an event, you must confirm from the Event List and then the indicator will disappear.
Back To Top
SUB) Event List Screen
When you click on the Event List button at the bottom of Recent Alarm Generation, a list of all the alerts and the Windows Event List unconfirmed by the administrator will be displayed.
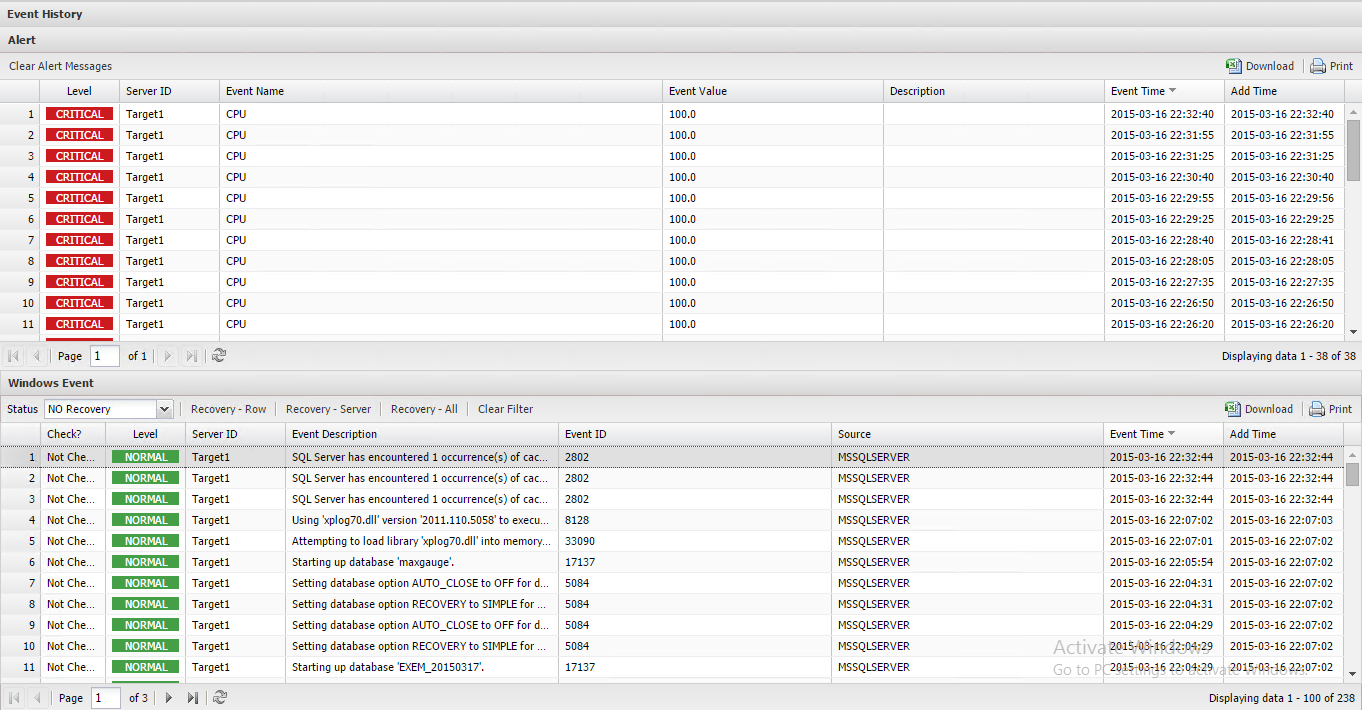
Image. Event List Screen
Event List screen is divided into Alert Log on the top half, and the Event Log on the bottom half.
The Alert Log displays the list of alarms generated for the indicators which exceeded the threshold value set by the user. When you click on the Delete Alarm Message button above the list, all alarm logs will be deleted and no longer appear on the list. On the right top, you will find the buttons for downloading in excel format and printing.
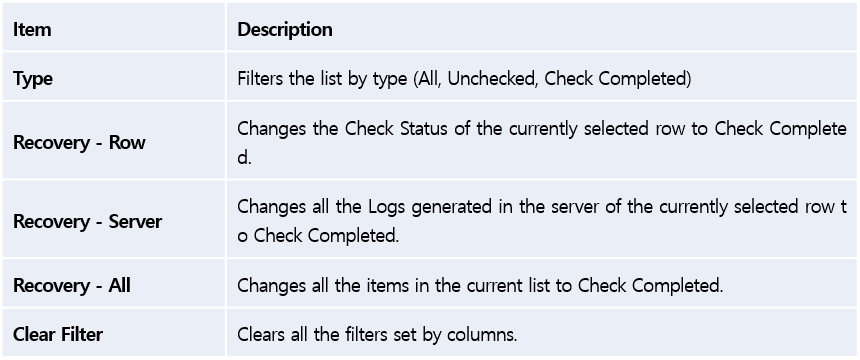
The Event Log displays a list of event logs generated in operation server OS. The menu items at the top are as follows.
Depending on the check status, the Windows Event changes the color of the number on the right of the instance and the box shape, therefore once the log has been viewed, you must confirm by changing it to Check Completed status.
Back To Top
Event Receive Monitor Area
The Event Receive Monitor allows you to check whether the MaxGauge For SQLServer Dashboard is functioning normally or not. A small circle continuously moving across the screen indicates that it’s operating normally. However, when there is no movement, you can assume there is a problem with the corresponding dashboard.
Back To Top
View List Area
The View List allows you to change the Dashboard screen Instance configuration by the Screen Set ID as set in the Admin. The Dashboard can only display up to 16 instances, therefore if you have more than 16 target servers, then you need to divide the screen sets into different View Lists for monitoring.
Back To Top
Menu Area
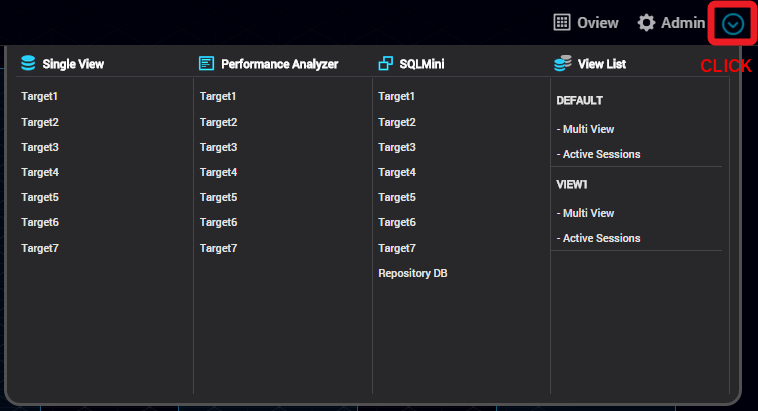
Image. Top Menu
The menu is located on the right top of the Dashboard screen. Except for the Oview, all other menu is commonly used across other screens as well. Through the menu, you can move from one screen to another. The Oview menu is only on the Dashboard screen. When you click on the arrow at the right end, a list of screen set and instances by each screen will appear. The corresponding instance list will only display the screen set the current user has and the instances included in that set.
Back To Top
Instance Area
The Instance area is divided into 4 groups and you can add up to 4 instance per group. You can put intances of similar task characteristics in the same group. You can register the server (Instance) and set the server group name in Admin’s ‘Server Management’ tab.
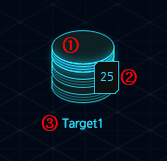
Image. Instance Description
①Instance Alert Status ② Generated Event Status ③ Instance Name
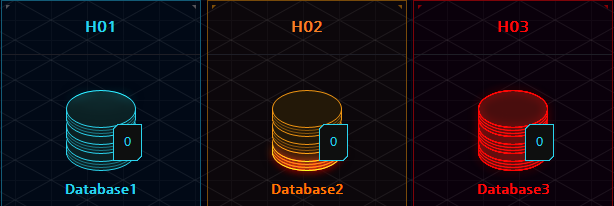
Image. Instance Alert Status (From Left: Normal, Warning, Critical)
The Instance Alert Status is expressed in different colors and for events, you can even check the number of events generated. You can move to the real time Single View either through the menu on the top or by directly clicking on the instance itself.
Back To Top
Oview
On the Oview screen, you can view a 24 hour trends graph of a single indicator with respect to all the instances registered in the corresponding screen set, on a specific date and compare it with today’s trends graph.
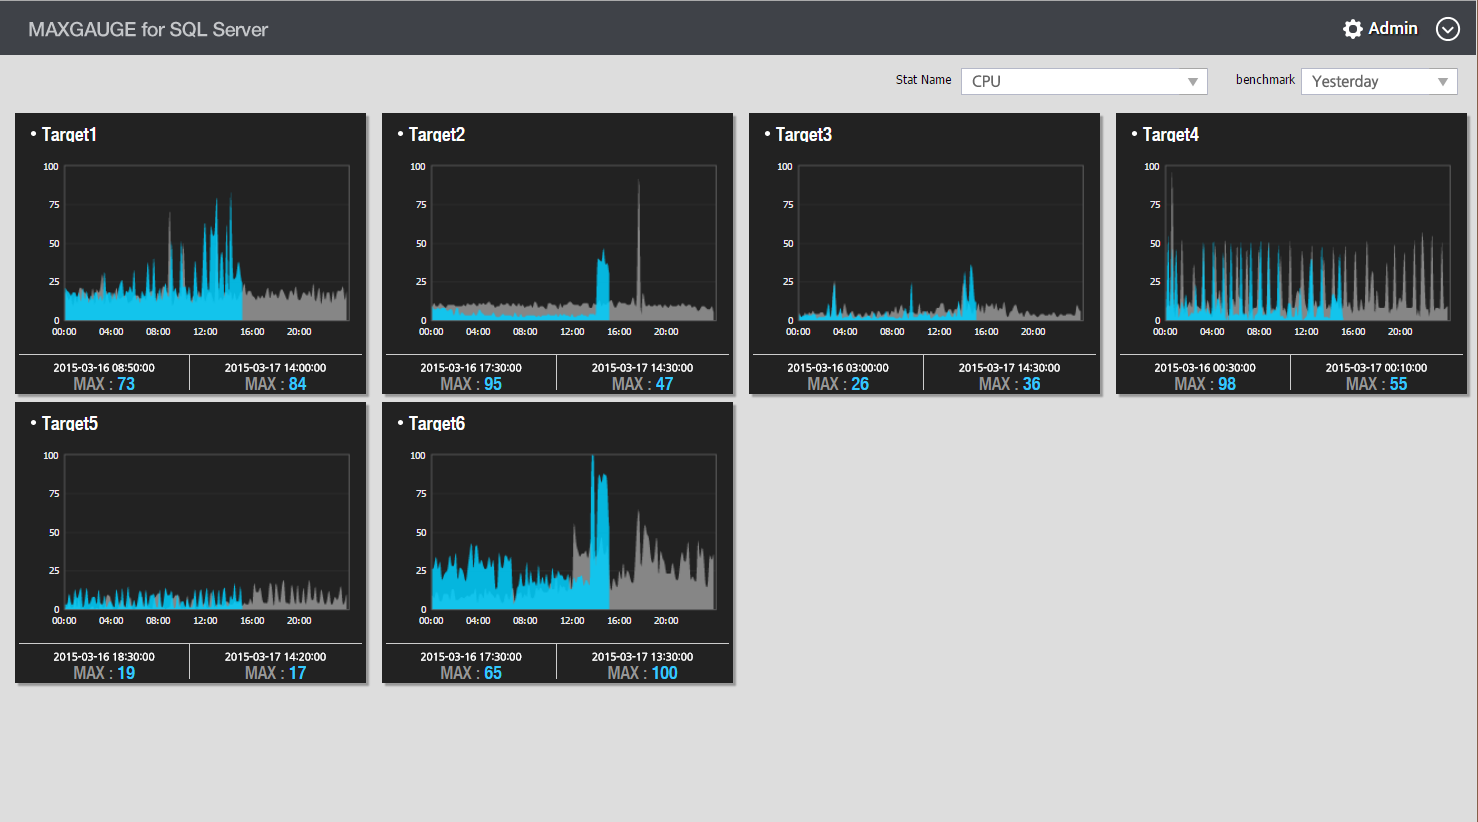
Image. Oview Screen
Back To Top
MAIN) 6. Single View
Back To Top
Connection
On the Dashboard screen, when you click on the instance image or use the top menu and select the Server Name from the Single View List, you will be directed to the Single View screen.
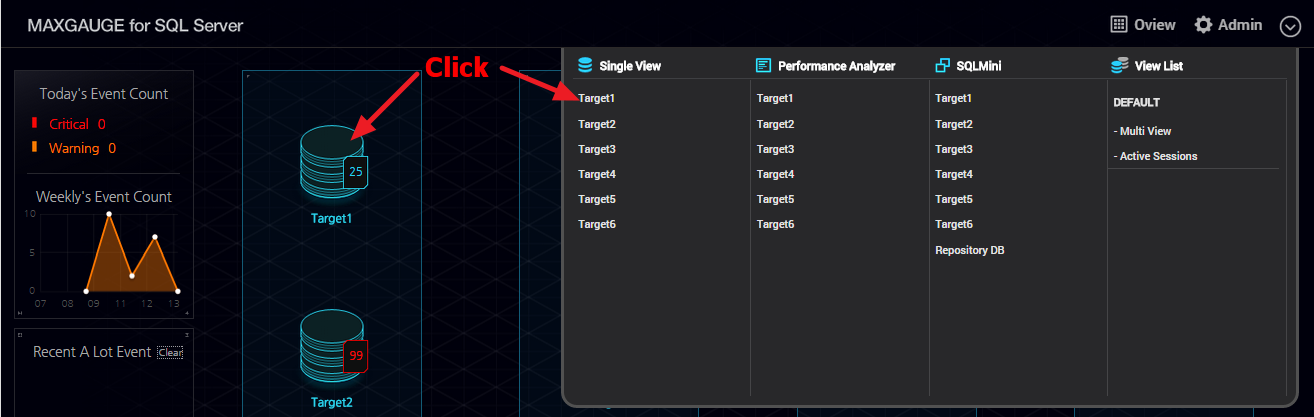
Image. How to Switch to Single View Screen
Back To Top
Main Screen
The main screen of MaxGauge For SQL Server Single View is as follows.
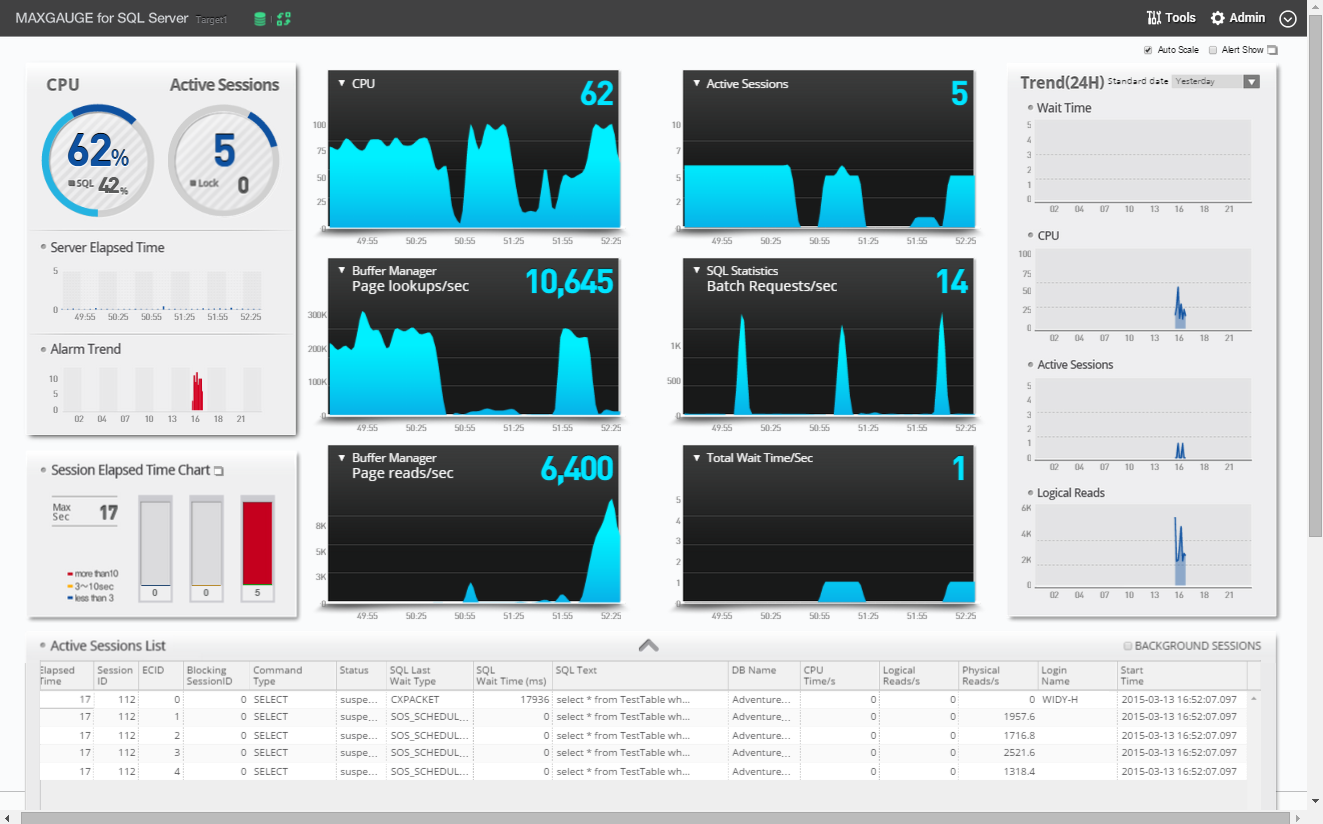
Image. Single View Main Screen
The MaxGauge For SQL Server Single View Main Screen allows you to quickly and effectively manage real time performance mangement of a SQL Server instance, by monitoring the performance issues from the system’s overall perspective through a single screen.
MaxGauge For SQL Server collects the data using the optimized system queries. Therefore, you can start monitoring as soon as it is installed, without any instance down time.
Through integrated monitoring of several indicators on a single screen, in the event of instance’s performance degradation and system failures, you can instantly track down the session and/or the SQL to quickly and effectively identify the root cause of the problem.
Back To Top
Main Indicator Graph Area
The Main Indicator Graph Area on the Single View’s Main Screen consists of 6 graphs, and on each graph, the user can change various information provided by MaxGauge such as SQL Server’s performance indicator, CPU indicator, and the I/O indicator of the corresponding database.
Especially, the SQL Server’s performance indicator provides all the performance information provided in the SQL Server, which helps you to be quick and effective in your task of real time monitoring and diagnosis.
Back To Top
SUB) Monitoring Target Main Performance Indicators
- CPU
- Active Session
- Page lookups/sec
- Batch Requests/sec
- Page reads/sec
- Total Wait Time/sec
The Main Indicator Graph Area plays a very important role in terms of providing database system’s performance information, and it displays 6 items.
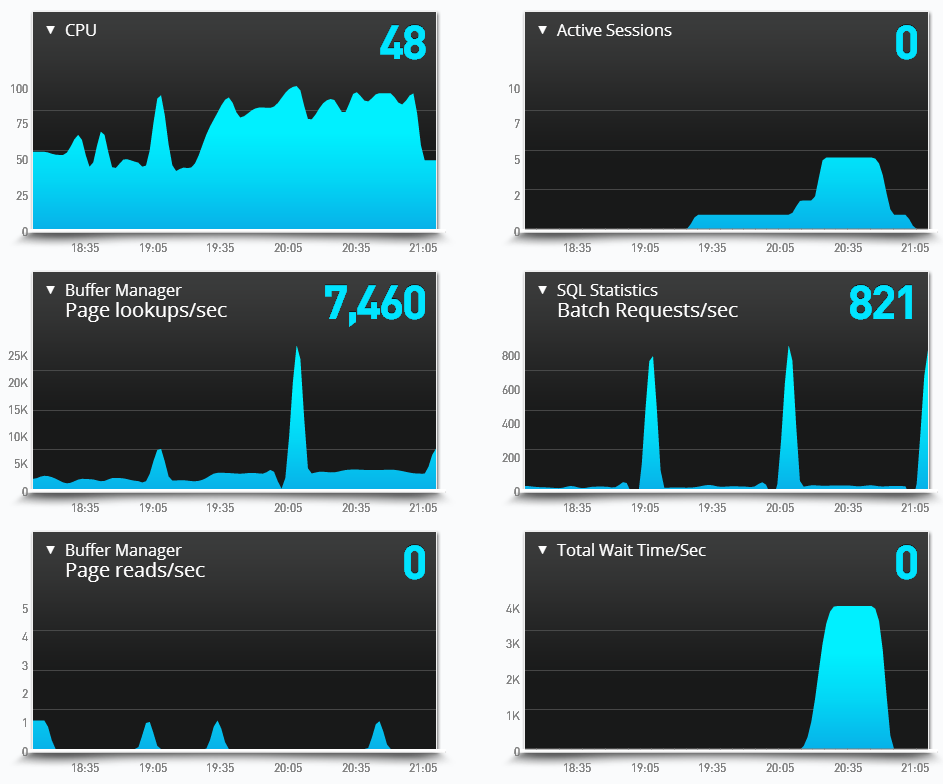
Image. Main Indicator Graph
The default indicators are as follows –CPU, Active Sessions, Page lookups/sec, Batch Requests/sec, Page reads/sec, and Total Wait Time/Sec . You can change the position of each indicator by dragging the indicator name to the desired position. You can also change the monitor indicator by clicking on the inverted triangle ▼ in front of the indicator name.
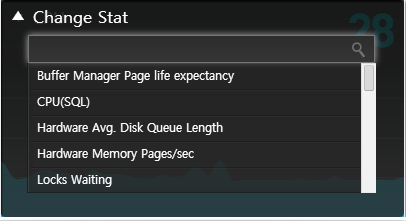
Image. Indicator Item Change Screen
Back To Top
Server Elapsed Time Area
This area displays the process time of queries executed to collect indicator and Active Sessions in the target server, and it helps to assess the target server’s DB query load or the network issues.
Back To Top
Alarm Trends Area
You can check the number of system errors generated in the Error Log and the Event Log by time.
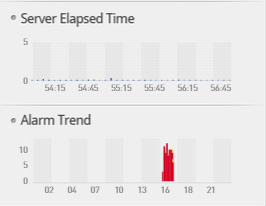
Image. CPU, Active Sessions, Server Process Time, Alarm Trends Graph
The server process time displays the actual delay time in the server in ms unit, and displays the number of alarms generated during one day in a trends graph. In the reference image above, you can note that a high number of alarms were generated between the 14th hour and the 17th hour.
Back To Top
Session Elapsed Time Chart Area
You can check the current active sessions’ distribution chart by elapsed time.
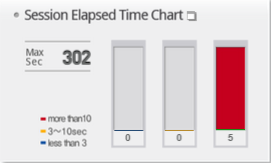
Image. Session Elapsed Time Distribution Chart
This graph displays the distribution based on the execution time of current active sessions. The time under 3 seconds, 3~10 seconds, and more than 10 seconds are each expressed in blue, yellow, and red, respectively, and is displayed by ratio. In the reference image above, there is 0 under 3 seconds, 3 sessions that are running 3~10 seconds, and 2 sessions that are running for more than 10 seconds. You can open the Active Sessions List in a new window by clicking on the graph or clicking on the new window button on the right of the ‘Session Elapsed Time Distribution Chart’. The new window displays more detailed information than the basic information displayed in the previous Active Sessions List screen.
Back To Top
24 Hour Trends Area
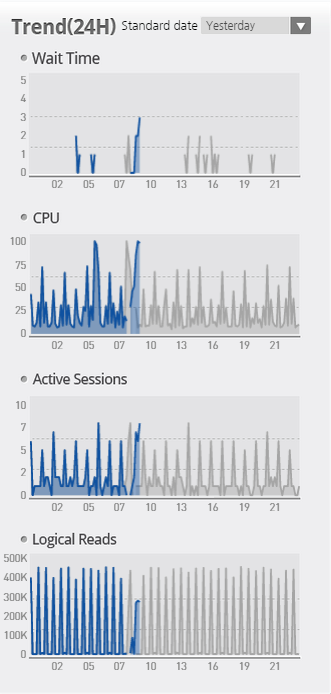
Image. 24 Hour Trends
The 24 Hour Trends graph allows you to compare today’s log trends and the reference date’s trends to see the difference. You can choose from 4 selections — ‘yesterday’, ‘1 week ago’, ‘1 month ago’, and ‘specific date selected by user’ (Choose from the calendar), and as for main indicators, 4 main monitoring target indicators are fixed and can be changed.
Back To Top
Active Session List Area
You can check the current active sessions information.
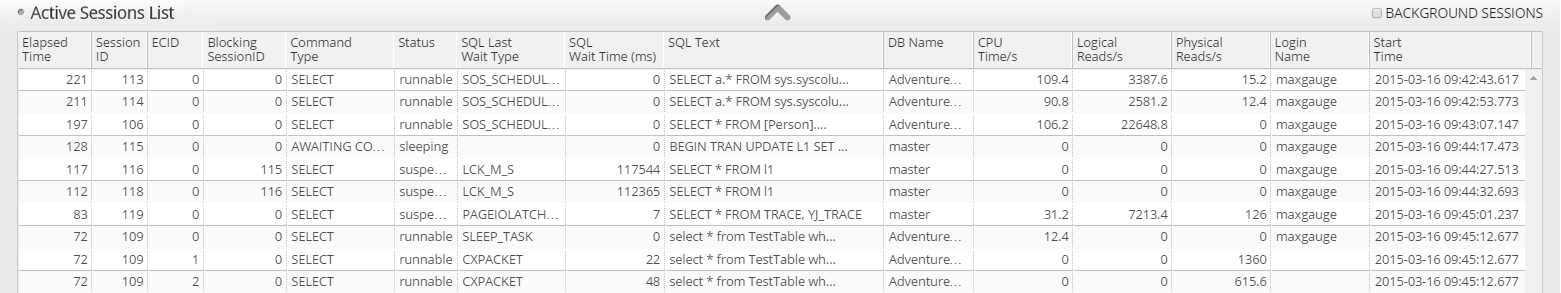
Image. Active Sessions List
The current Active Session List will appear at the bottom of the Single View. It displays key information of the current active sessions and if you wish to check further information, you can click the graph on the Elapsed Time Distribution Chart or the new window button to look at more detailed information. You can also use another method by double-clicking on a specific session from the Active Sessions List to open up the Session Detail Window which will display detailed information regarding the session you have selected.
Active Session List
If you want to see more information than the default information on the Active Session List, simply click the graph on the Session Elapsed Time Distribution Chart or click the New Window button to see more detailed information. The Active Session List opens in a new window displaying more indicators and you can even filter out sessions based on the Elapsed Time to check on specific sessions.
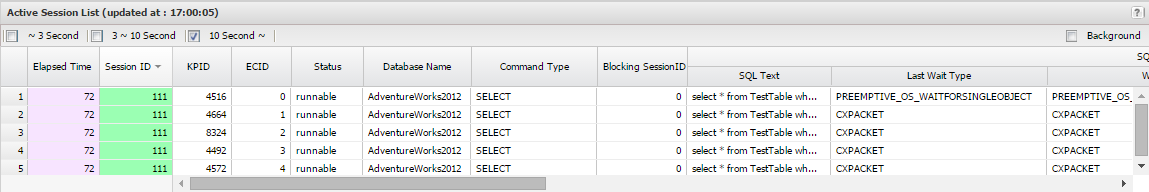
Image. Active Session Screen
The Active Sessions refer to sessions currently executing in the instance. When you check the ‘Background’ located on the top right corner, the information of the background sessions will be included in the list.
Back To Top
Top-Down Tracking Method
The image below illustrates the tracking process of the session and SQL through a top-down approach method as realized in MaxGauge.
The greatest advantage of MaxGauge is that you can quickly assess and identify the root cause through the top-down approach method by which you can track down the root cause from the main screen to ‘Active Session List’ > ‘Session Detail’, and to the lowest ranking SQL levels, and also by quickly collecting all necessary performance information for immediate analysis.
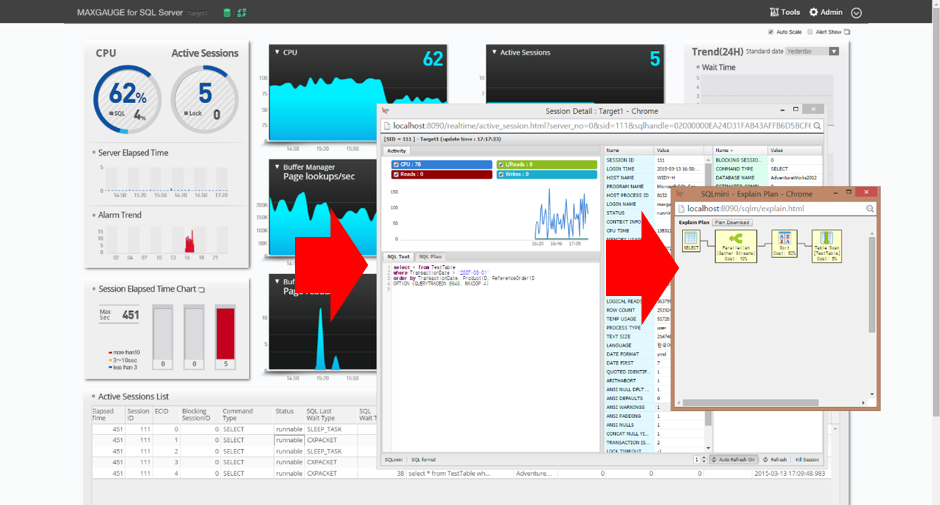
Image. Top-Down Method Tracking
Session Detail Screen
The Session Detail provides detailed information of a specific session in the database system and its functions are as follows.
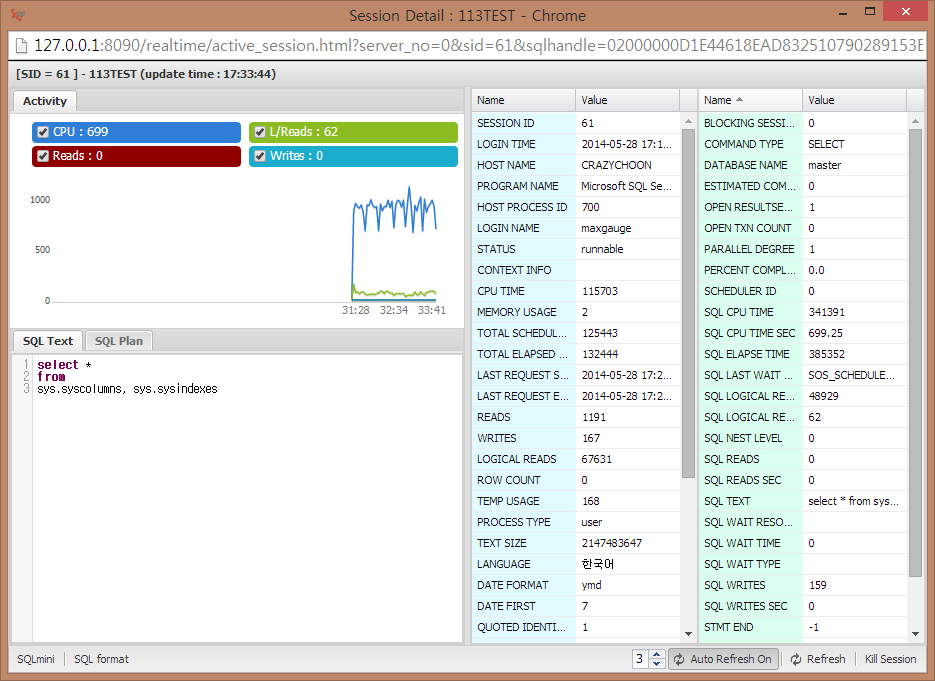
Image. Session Detail Screen
The performance indicator’s description and acitivity levels since the time the individual session was connected until the present time.
The performance indicator’s description and activity levels between the present time and the previous time.
Various kinds of system information related to session execution.
The SQL statement’s content and execution plan, and other related performance indicators since the time the individual session was connected.
The comparison of session’s activity level indicator and the system’s total indicator.
Session kill function
Session Detail’s Function Overview
The Session Detail provides detailed information of a specific session in the database system and its functions are as follows.
Main Activity Area
The Main Activity area displays the session’s 4 main indicators (CPU, Logical Reads, Writes, Reads) in a trends graph. You can even interwork with the overall system’s usage amount to compare and easily figure out how much of the system’s overall resources the session is using up.
Session Control Area
You can either Refresh or Kill the corresponding session’s information.
Info Area
The Info Area outputs the information related to the session. It displays the session’s Session ID, Login Name, connected host name, program name, and other information related to the session.
SQL Text Area
You can check the SQL Text currently executing in the session.
SQL Plan Area
You can check a predicted execution plan of the SQL currently executing in the session.
Main Activity Area
In the Main Activity area, the 4 main indicators — Logical Reads, CPU, Reads, and Writes — which have the greatest impact are displayed in a trends graph by each Refresh Interval.
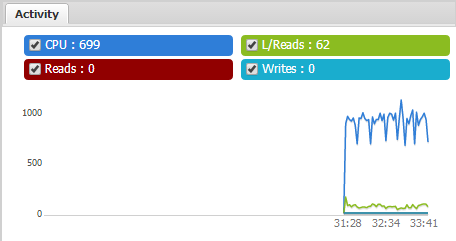
Image. Session Detail > Main Activity Area
Info Area
The Info area outputs the session information.
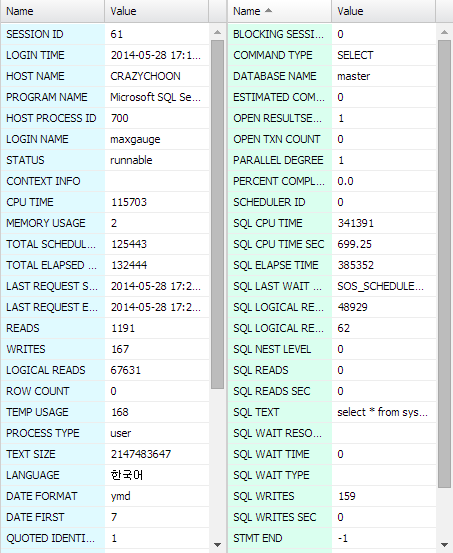
Image. Session Detail > Info Area
SQL Text Area
The SQL Text area displays the SQL query currently being executed.
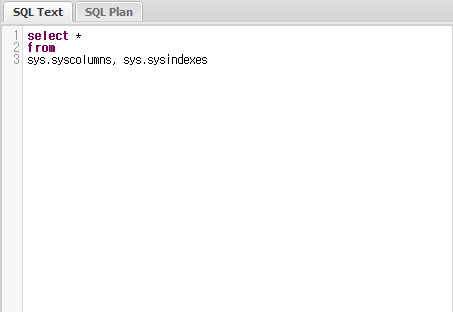
Image. Session Detail > SQL Text Area
When you click on the SQL Format right below the SQL Text Area, the SQL queries will be sorted automatically. When you click on the SQLmini, you will be connected to the SQLmini Window connected to the corresponding target server.
SQL Plan Area
In the SQL Plan Area, you can check the predicted execution plan of the currently executing query.
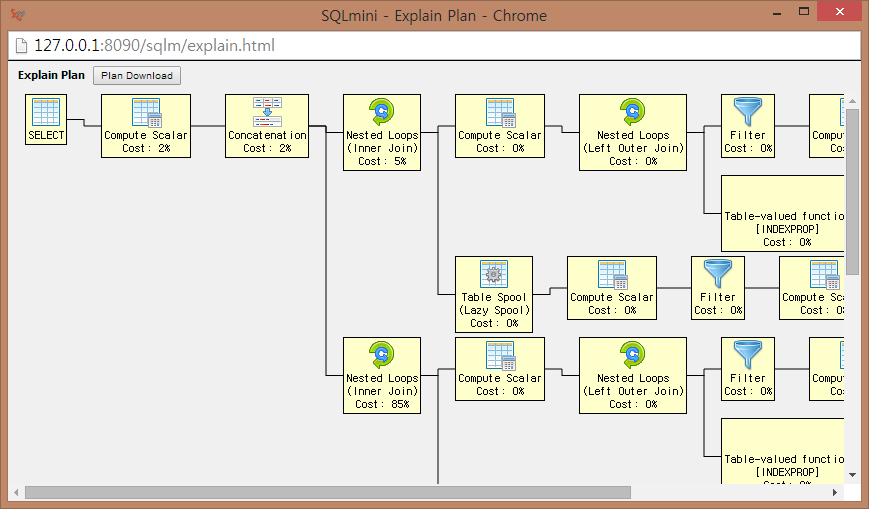
Image. Session Detail > SQL Plan Area
Session Detail Screen Execution Method
The Session Detail screen executes in the following methods:
Double-click the session you want to see from the Active Session List in MaxGauge’s Main Screen.
Once the list of sessions have been output by double-clikcking on the Active Session List in MaxGauge’s Main Screen, double-click the specific session you want to see.
Use the Lock Tree menu on MaxGauge’s Tool screen to output the session list and then, double-click the session you want to see.
Back To Top
Tools
At the top of MaxGauge For SQL Server Real Time Monitor, click on the Tool menu to connect to the Tool screen as shown below. You can click to use each function on the left panel.
Counter/Wait
The Counter/Wait displays only the counter and wait information of the instance currently being monitored, whose values have variation.
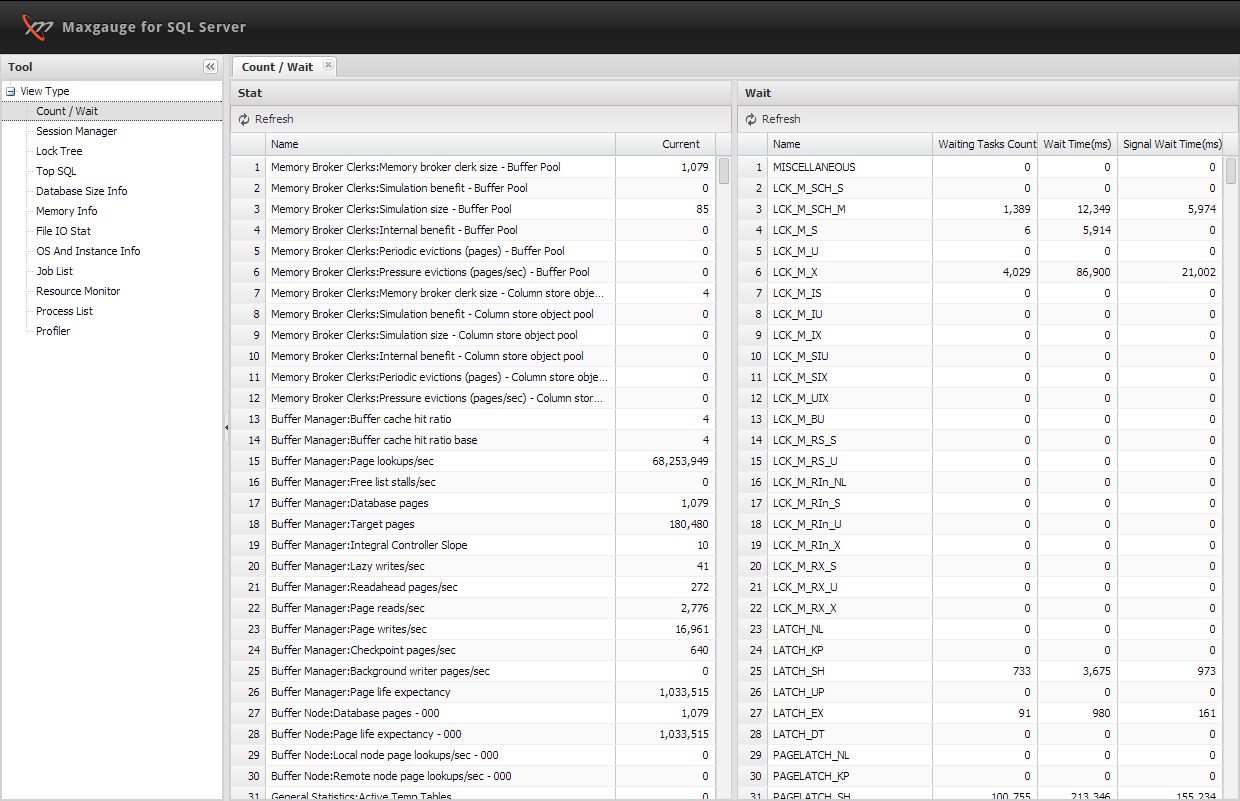
Image. Tool – Counter/Wait Execution Screen
Session Manager
The purpose of the Session Manager is to monitor all sessions connected to the database system. Among all the sessions currently running or the connected sessions, it helps to locate a specific session for the user by applying several conditions.
On the Session Manager Main Screen, it searches the active sessions only. When you change the conditions and click on the Refresh button at the bottom, it displays the sessions that fit the conditions out of all the sessions connected to the instance. The more sessions connected to the instance, the longer the elapsed time, therefore, it is best to search with specific conditions.
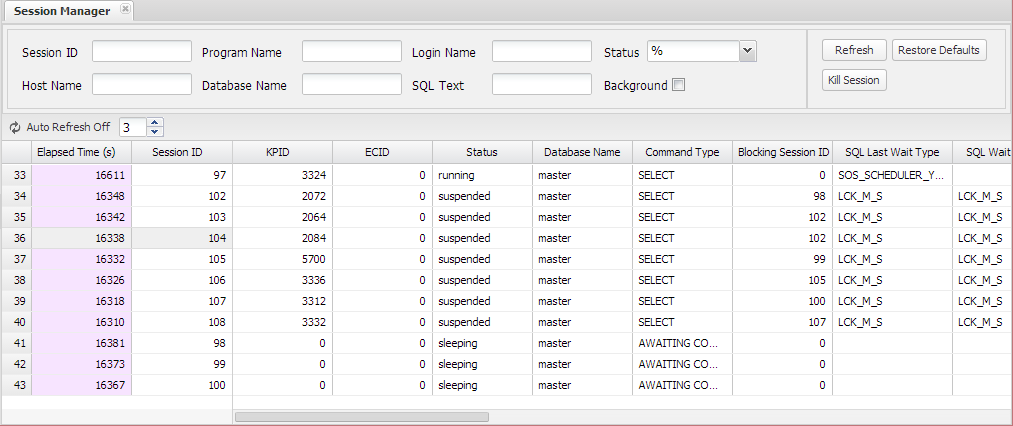
Image. Session Manager Execution Screen
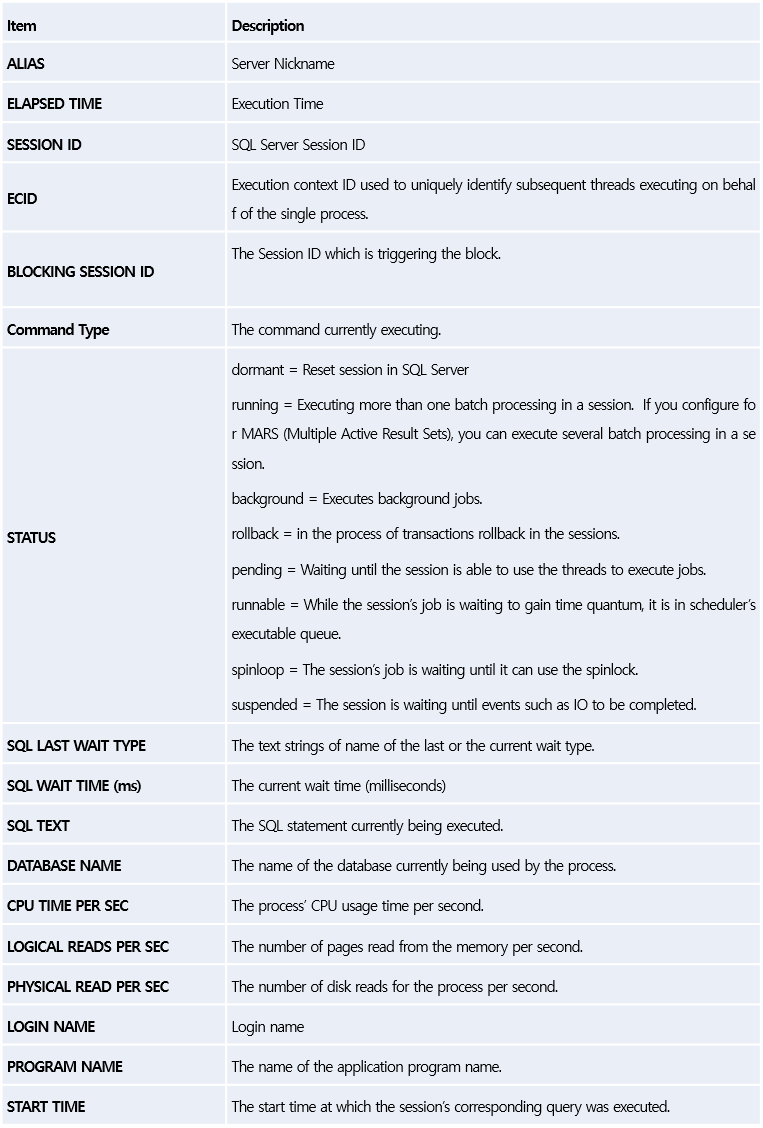
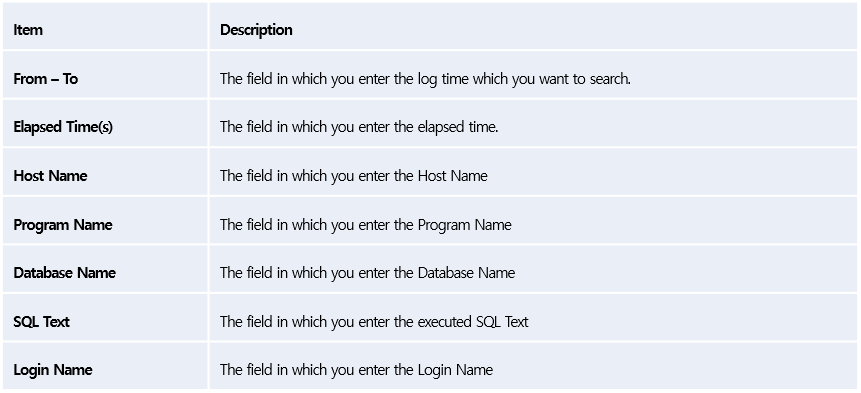
The following table explains the search conditions.
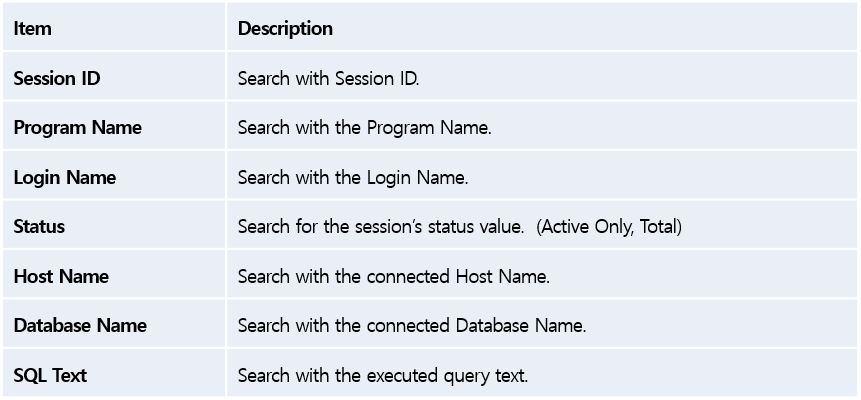
You can use the mouse or the arrow key to select from the sessions displayed in the Session Manager’s results window. The selected sessions will show inverted colors. The Kill Session which forces the session to quit, is not allowed on a selection of multiple sessions. This is because much caution needs to be taken when forcing shut-down of a session that is connected to the system. The session selected last becomes the target of Kill Session function.
Lock Tree
The Lock Tree screen displays the information of lock wait sessions and the sessions that triggered the lock out of all the sessions currently connected to the database system in a tree structure.
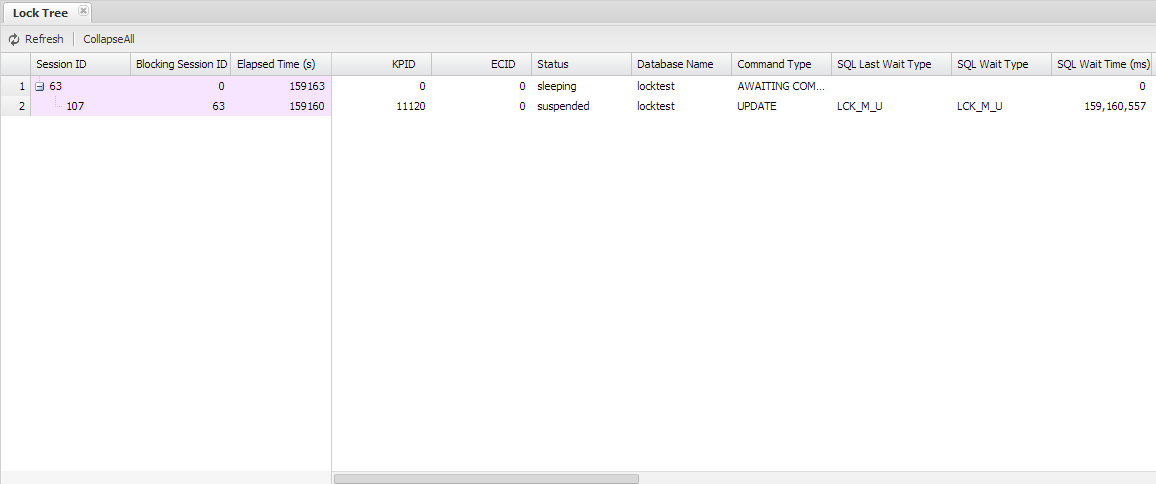
Image. Lock Tree Execution Screen
The Lock Tree screen displays the relationship between the selected lock-held instance and the request in a hierarchy, which helps you to distinguish the lock relationships among the sessions in a short period of time.
The Lock Tree screen items are the same as the Session Manager.
Top SQL
The TOP SQL screen provides the search function by using a part of the SQL text used in the query text. You can also search by various conditions such as CPU, Usage Time, Physical Reads, Logical Reads, Execution Time, and combining the Total, Last, Max, and Min value of the Execution Count. In a high-volume database, the search may take a long time.
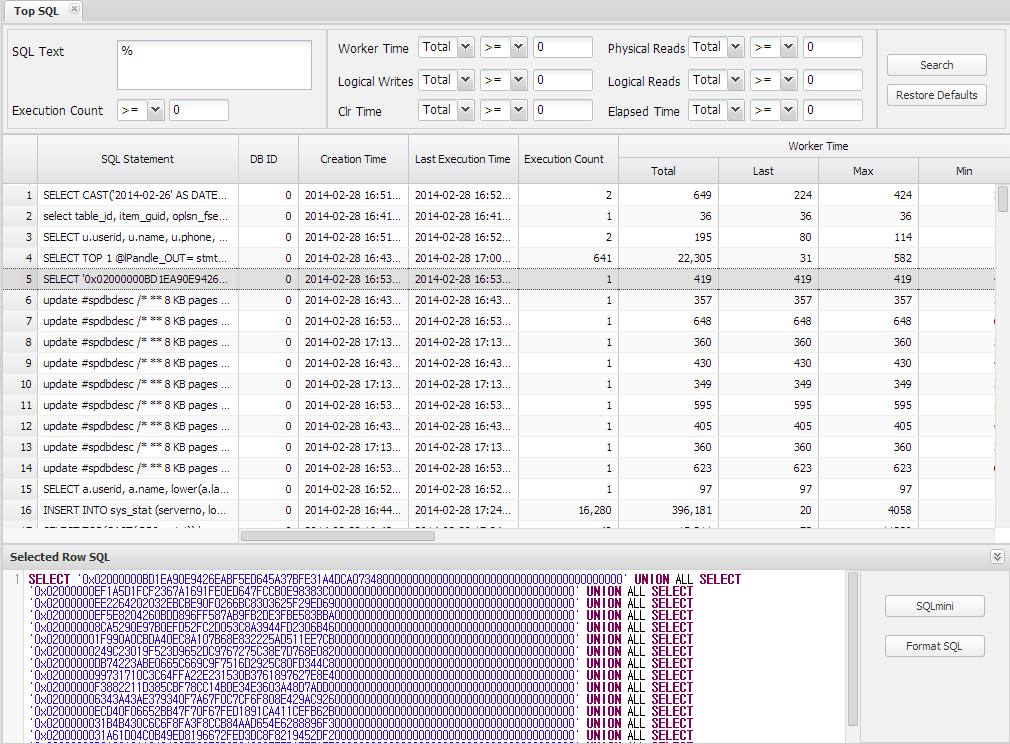
Image. TOP SQL Execution Screen
Database Size Info
The Database Size Info displays the data, log size and the number of virtual files, back-up status, recovery model information of all the databases currently in the corresponding instance.
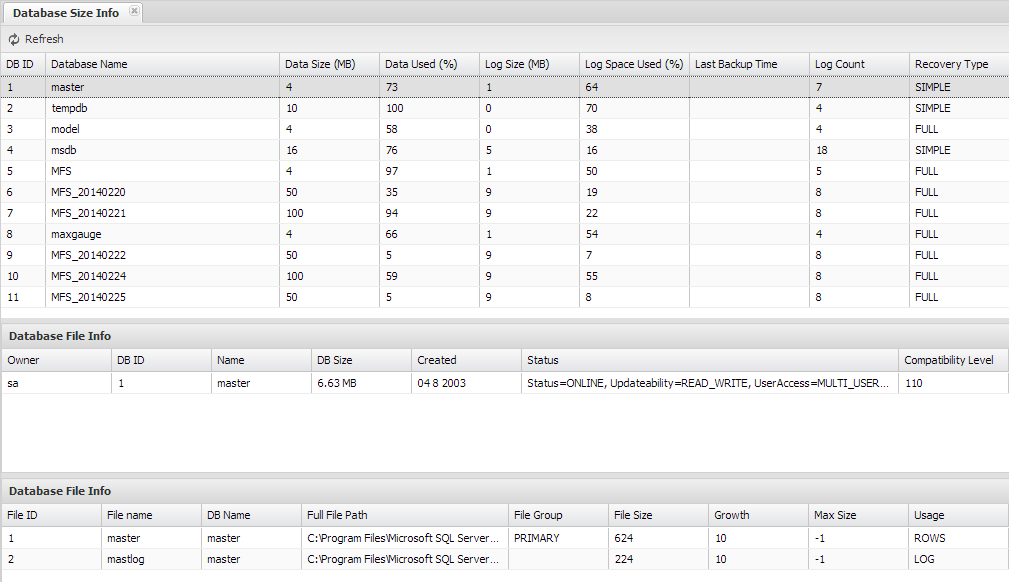
Image. Database Size Info Execution Screen
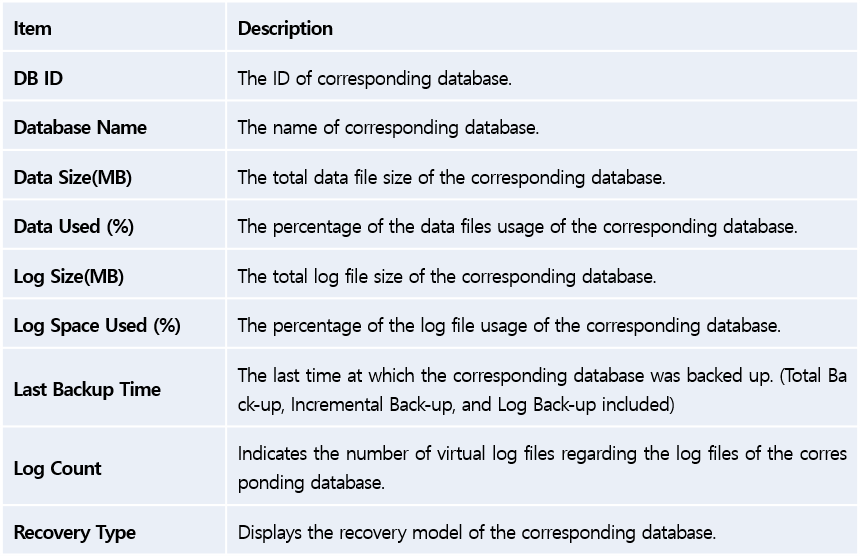
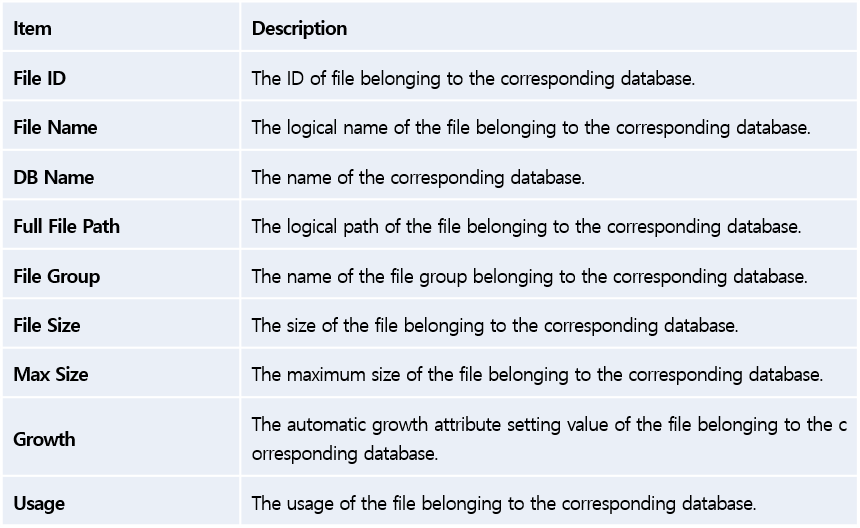
The following table explains the items in the Database Size Info screen.
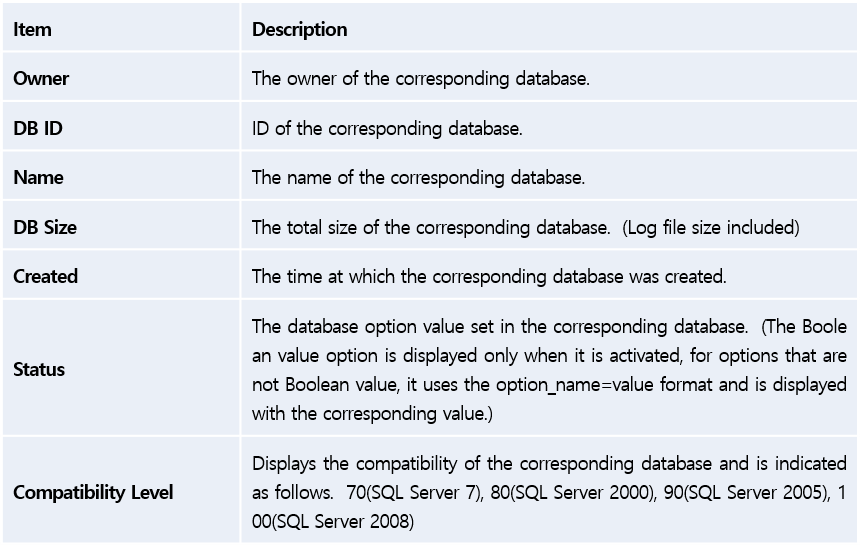
The following table explains the items which become available when a specific database has been selected.
The following table explains items displayed on the second screen, when a specific database has been selected.
Memory Info
You can instantly check the total memory usage at the current time and the Buffer Pool usage status, and among all the objects in the Buffer Cache, you can identify which object has the highest memory usage and the Procedure Cache usage status as well.
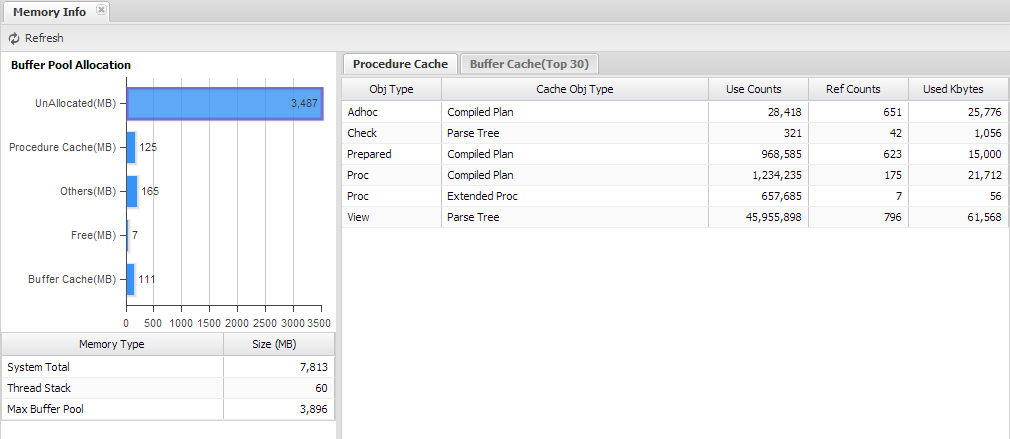
Image. Memory Info Execution Screen
On the bottom left of the Memory Info screen, it displays the System Total Memory Size, SQL Server Buffer Pool Size, and Thread Stack Size, and right above that is a detailed information about the Buffer Pool (Buffer Cache Size, Procedure Cache Size, Others, Free Space, and Unallocated Size).
On the right-side grid, it displays detailed information of Procedure Cache and Buffer Cache. The details for Procedure Cache is directly displayed on the grid, but the details for Buffer Cache requires an extra step of confirmation through a Message Box to see the information. This is because the Buffer Cache is of bigger size that it may take a long time to process.
File IO Stat
On this screen, you can check IO status of the data files and the log files used throughout the entire instance. You can even check each file size, maximum file size, automatic growth settings, and the number of reads and writes generated, and bytes used for reads and writes, and the wait information. By reviewing such information, you may be able to consider relocating the data files and the log files.
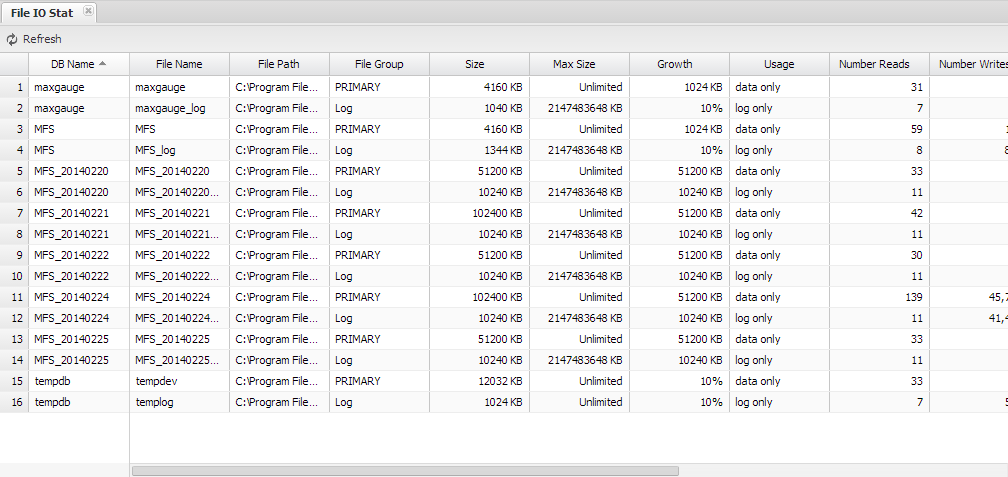
Image. File IO Stat Execution Screen
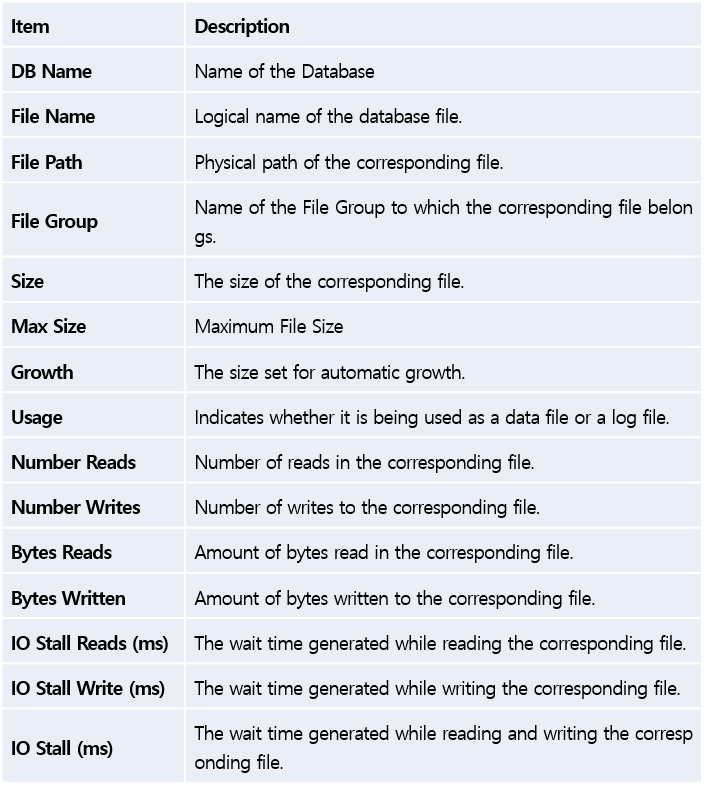
The following table explains the items on the File IO Stat screen.
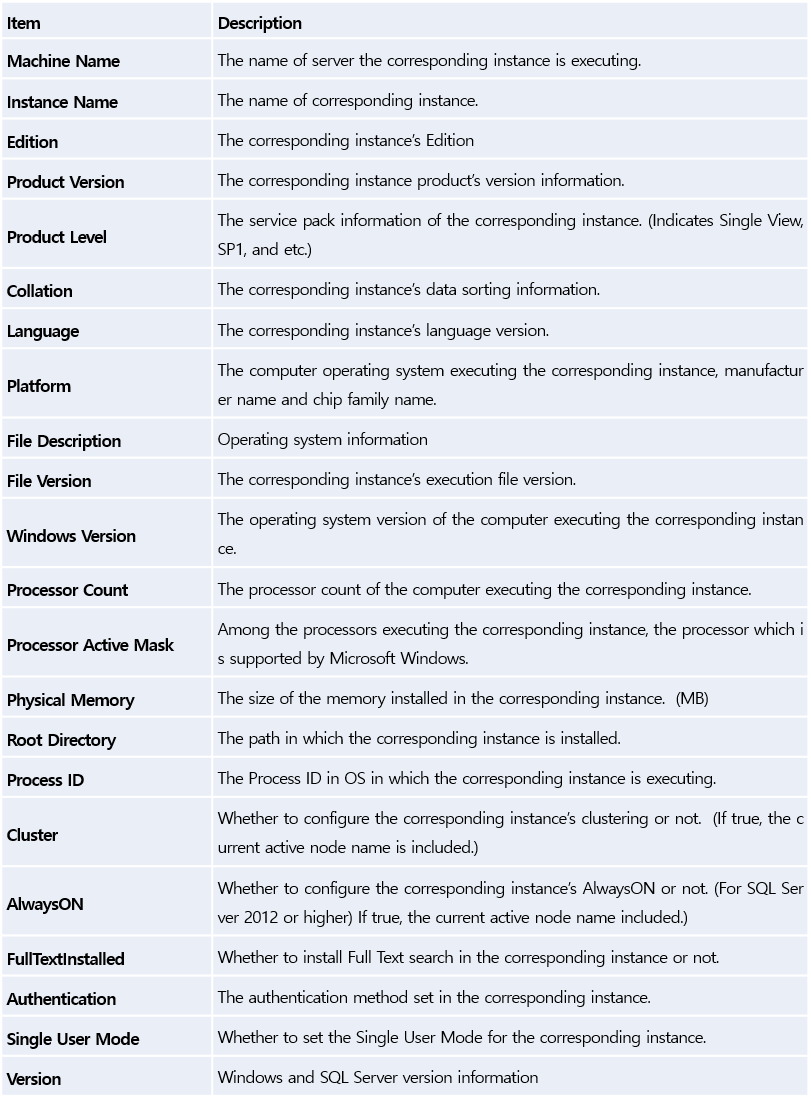
OS and Instance Info
This area provides detailed information regarding the OS and the instance. It not only provides information regarding the OS version and the service pack, but it also provides other various information such as total memory size and processor count, SQL Server version, and collation.
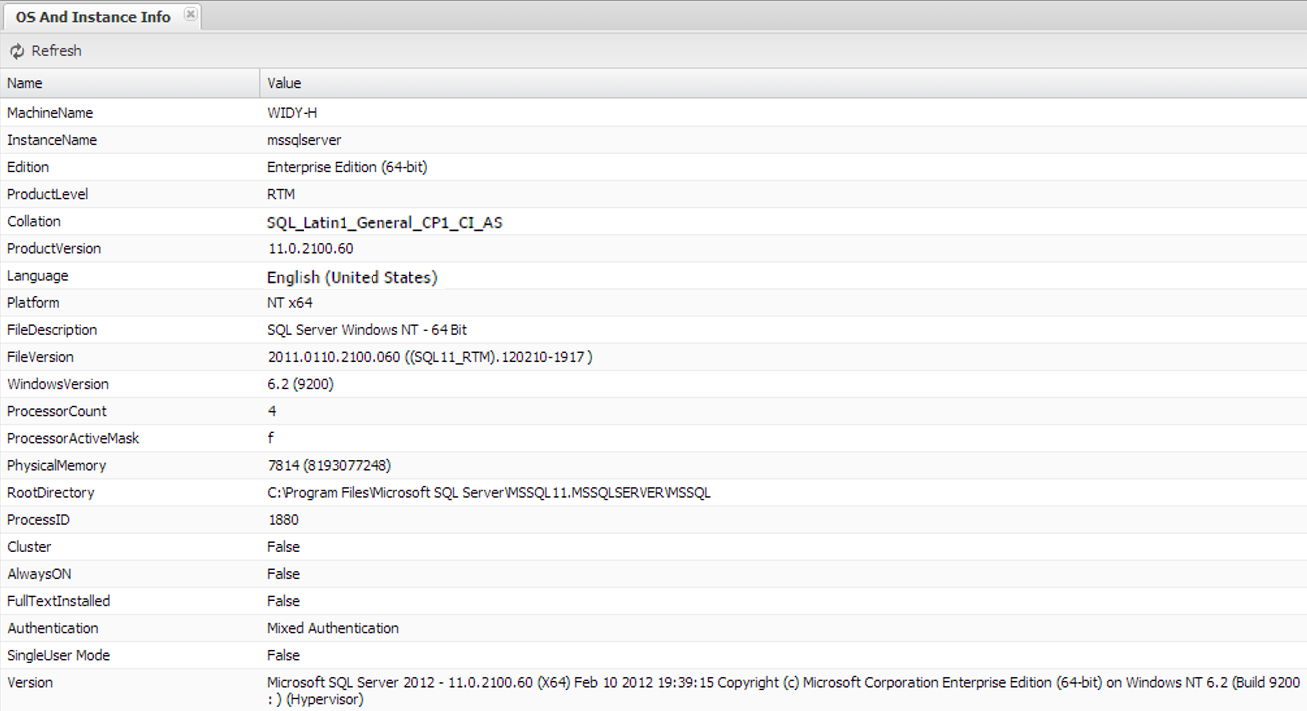
Image. OS And Instance Info Execution Screen
The following table explains the items on the OS and Instance Info screen.
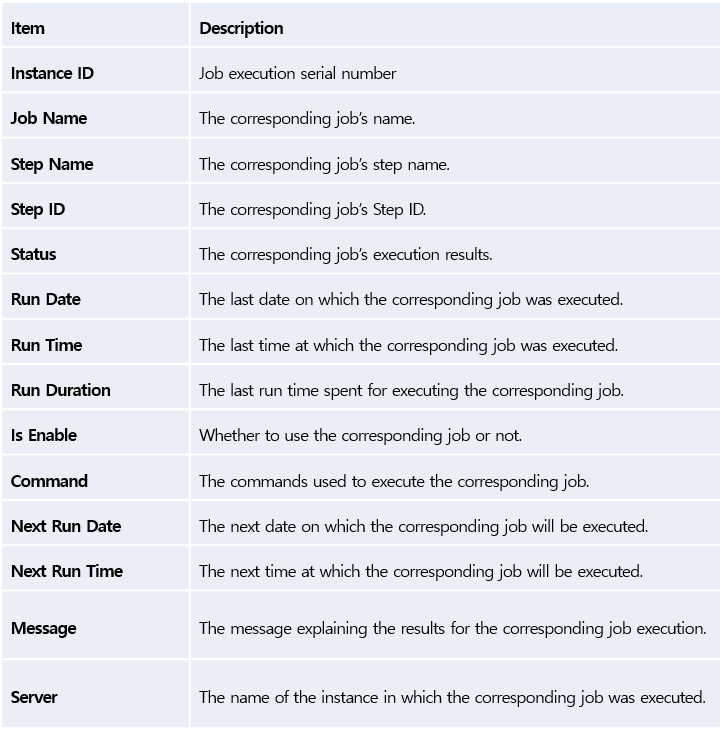
Job List
On this screen, you can check the results of jobs executed in the instance. By default, jobs that have failed most recently will be displayed at the top. Depending on the circumstances, it will display the job results in six different statuses such as– All, Fail, Success, Retry, Cancel, and In Progress.
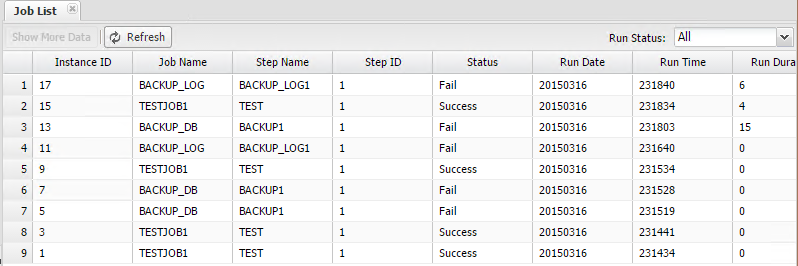
Image. Job List Execution Screen
Resource Monitor
The Resource Monitor provides the resource information (Scheduler, Memory, Disk) updated in real-time. It provides information such as the level of load on the scheduler, memory usage and disk usage status in real-time, which helps to maximize the use of the hardware.
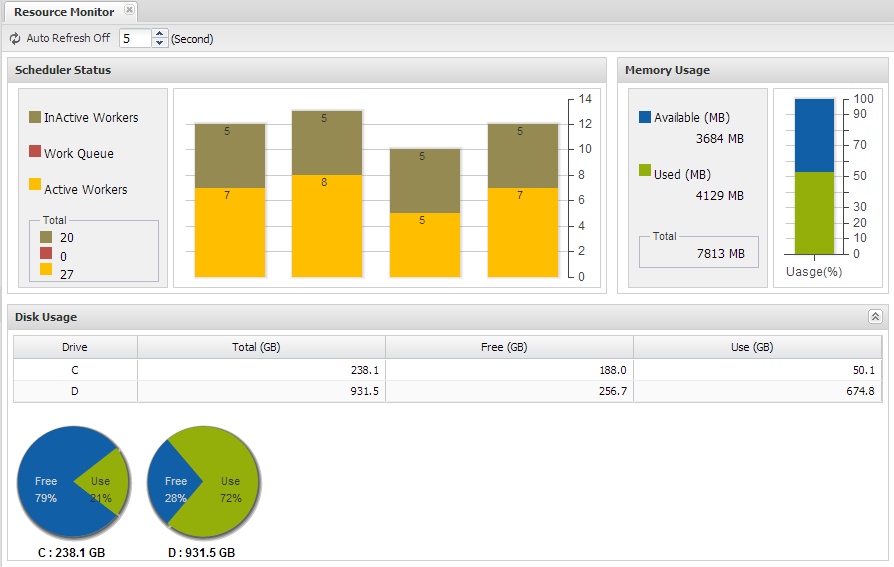
Image. Resource Monitor Execution Screen
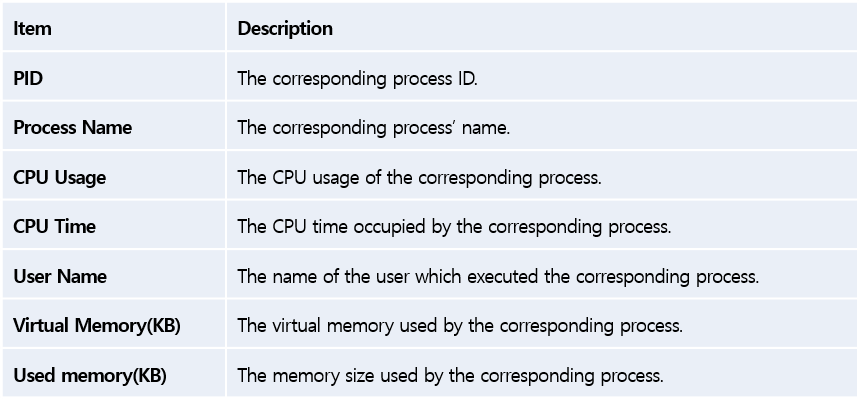
Process List
The Process List provides information regarding the processes currently executing in OS. In the event the CPU usage is high, you can easily identify which specific process is using up the most CPU.
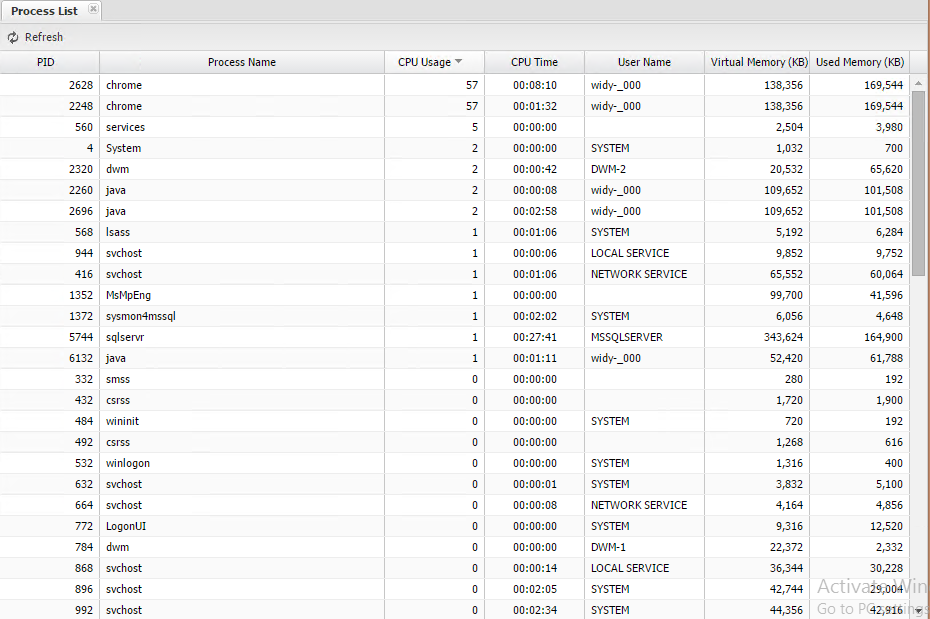
Image. Process List Execution Screen
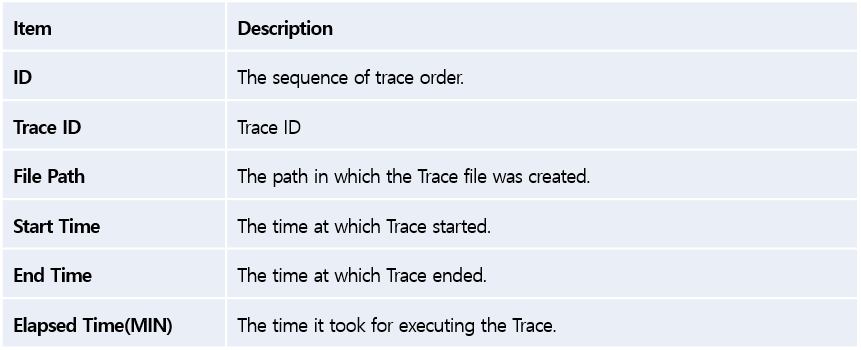
Profiler
This function allows you to collect Traces in the target server. This may be used to catch a session which was not identifed by MaxGauge. By adding conditions to Duration and Reads, you can execute a profiler. As shown below, click on the Trace Start at the top and give Trace creation path and filtering conditions to start, and then select the corresponding trace and then click Trace Stop to end.
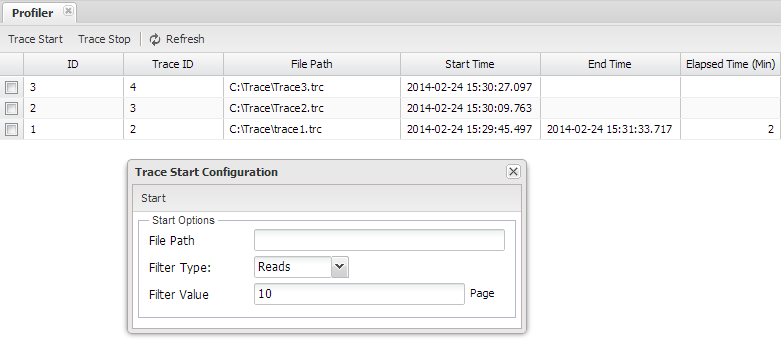
Image. Profiler Execution Screen
Back To Top
SQLmini
Execution Method
There are two main methods for executing the SQLmini. The first one is executing through the SQLmini on the menu at the top right corner of every screen. The second is by clicking on the SQLmini on specific screens such as the Session Detail Window and the Top SQL window. If you execute through the menu, you can access without any content, and if you access through the Session Detail and the Top SQL, then the selected SQL statement will appear on the screen.
Main Screen
The SQLmini can be considered as a miniture version of the SQL Server’s SSMS function. This is a powerful function which allows you to connect to the server currently being monitored to execute SQLs in real time, and also, to verify the execution plans as well. In addition, you can also check the information of an object through the object finder.
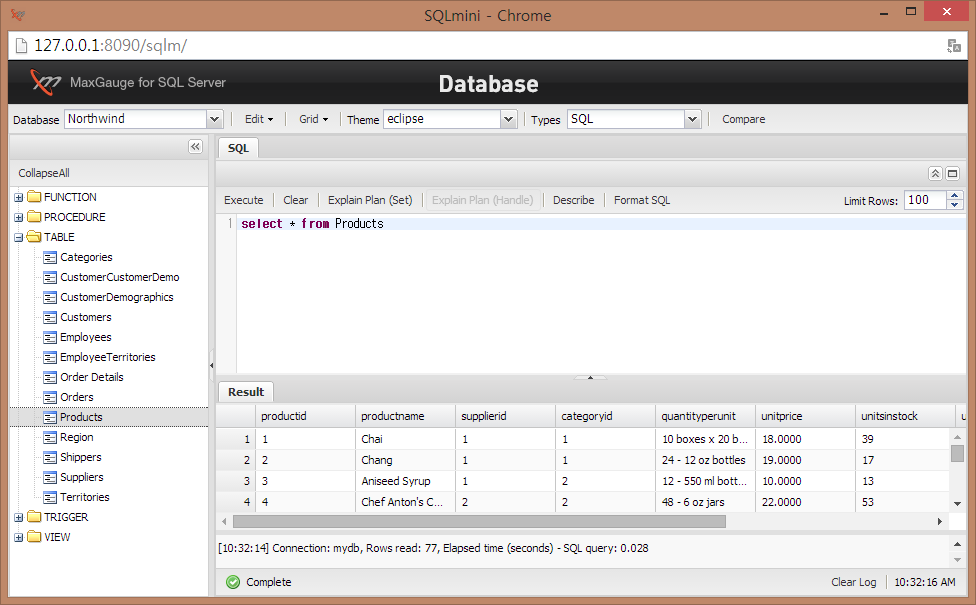
Image. SQLmini Screen
Object Finder Area
The Object Finder area is similar to the SSMS’ object finder through which you can check the objects within the database. By selecting the database, you can see the objects (Function, Procedure, Table, Trigger, View) within the corresponding database, and in the event of SQL execution, it allows you to execute in the corresponding database.
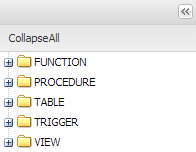
Image. SQLmini Object Finder
Menu Area
The Menu includes the option for database selection, and other functions such as SQL Type, Window Theme, and Compare, which have been designed to provide convenience when writing the SQL statement.

Image. SQLmini Menu Area
SQL Edit Area
SQL Edit’s items are as follows.
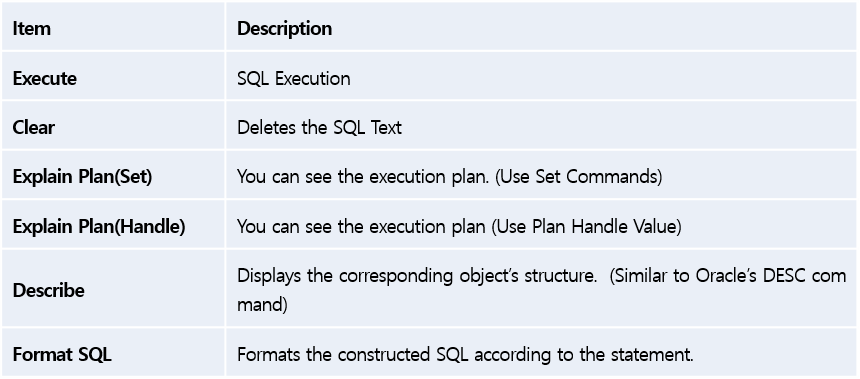

Image. SQLmini Table Structure Information and Checking the SQL Execution Plan
SQL Execution and Results
When you have the written SQL and executed on the SQLmini, then the execution results table will be output as shown below. By default, the maximum number of rows output for results is 100, and you can adjust the number of rows through the Limit Rows on the top right corner.
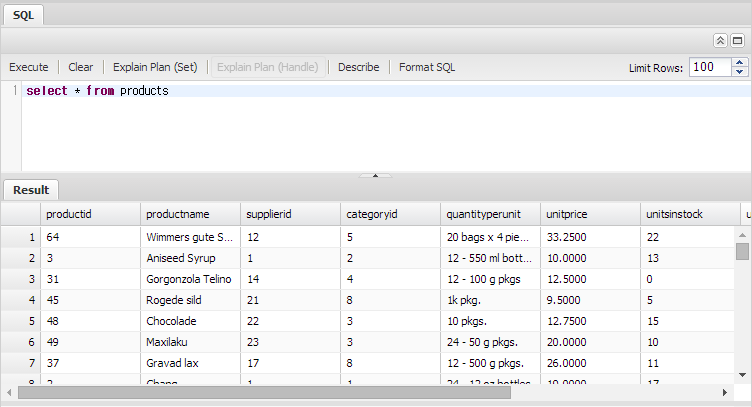
Image. SQLmini SQL’s Execution Results
Back To Top
Miscellaneous Functions
PA Screen Switch Function
When you drag the mouse over the desired time on the 24 Hour Trends of Alarms Generated Yesterday and Today, it switches to the PA screen of the selected time period.
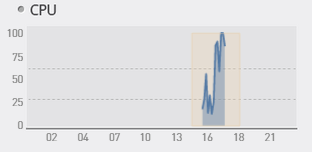
Image. Switch from 24 Hour Trends to PA Screen
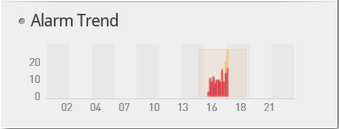
Image. The PA Screen of the Time Selected from the 24 Hour Trends
Screen Changes in the Event of an Alarm
When an alert is generated according to the settings in Admin, the corresponding indicator graph changes in color. The CPU indicator and the Active session indicator on the left top corner of the Single View also change in color according to the alerts. If you check the Alert Show on the top right of the Single View, the event appears in the event of an alarm. When you click on the small window-shaped icon next to the Alert Show, you can check the current Windows Events and Alarms.
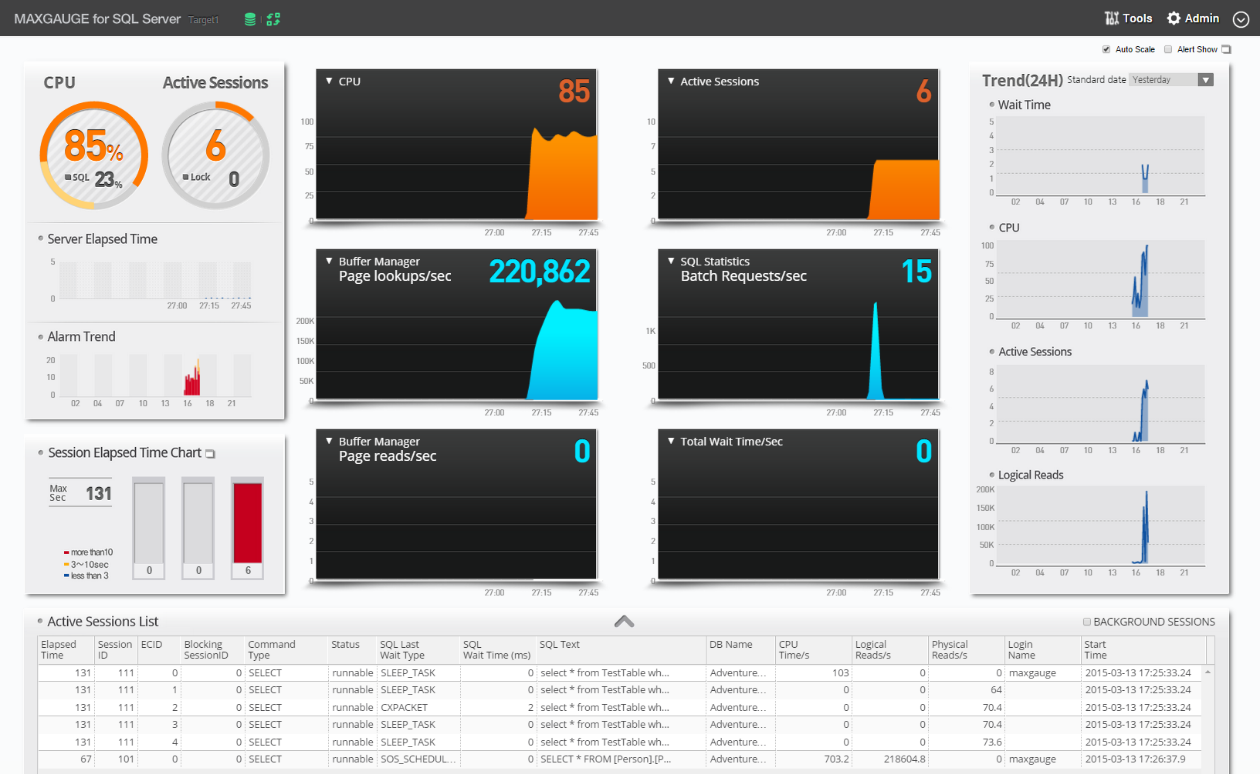
Image. Monitoring Screen in the Event of an Alarm (Warning)
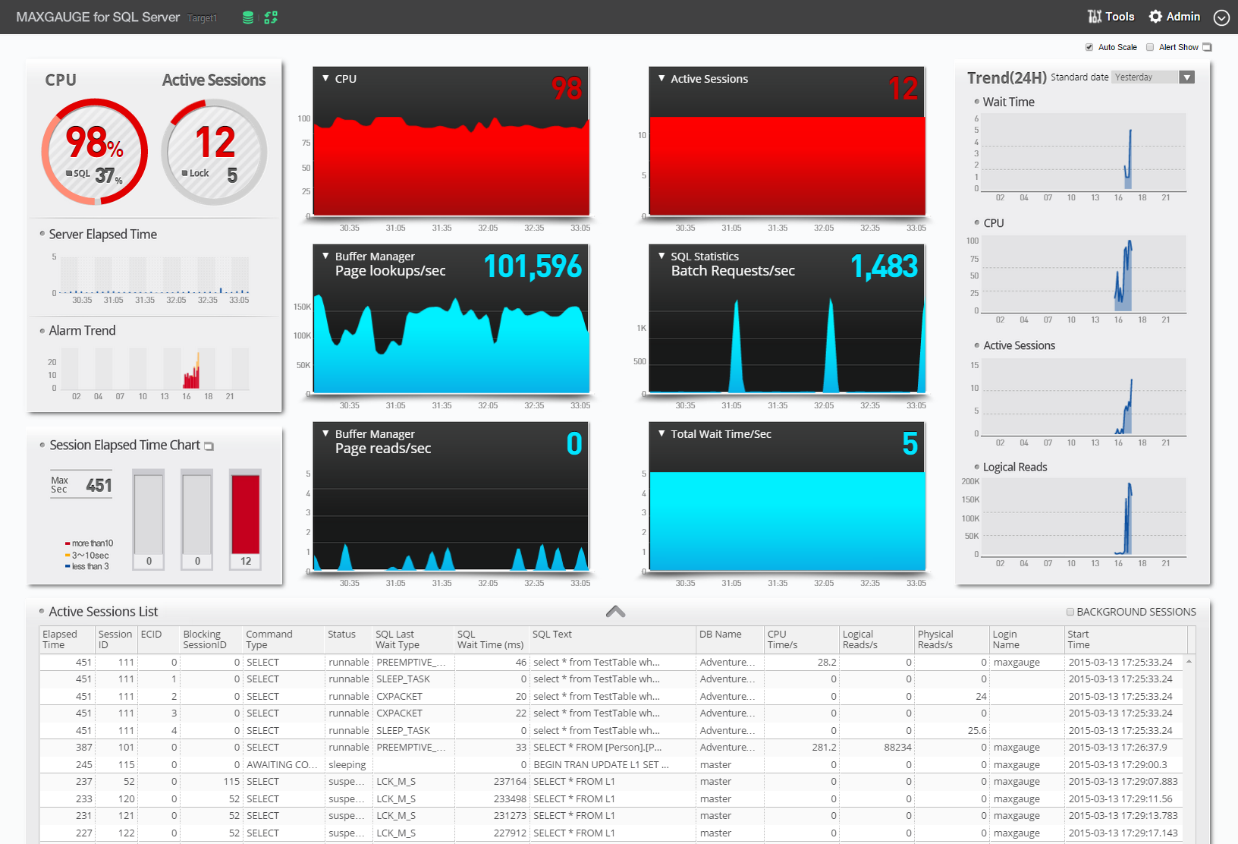
Image. Monitoring Screen in the Event of an Alarm (Critical)
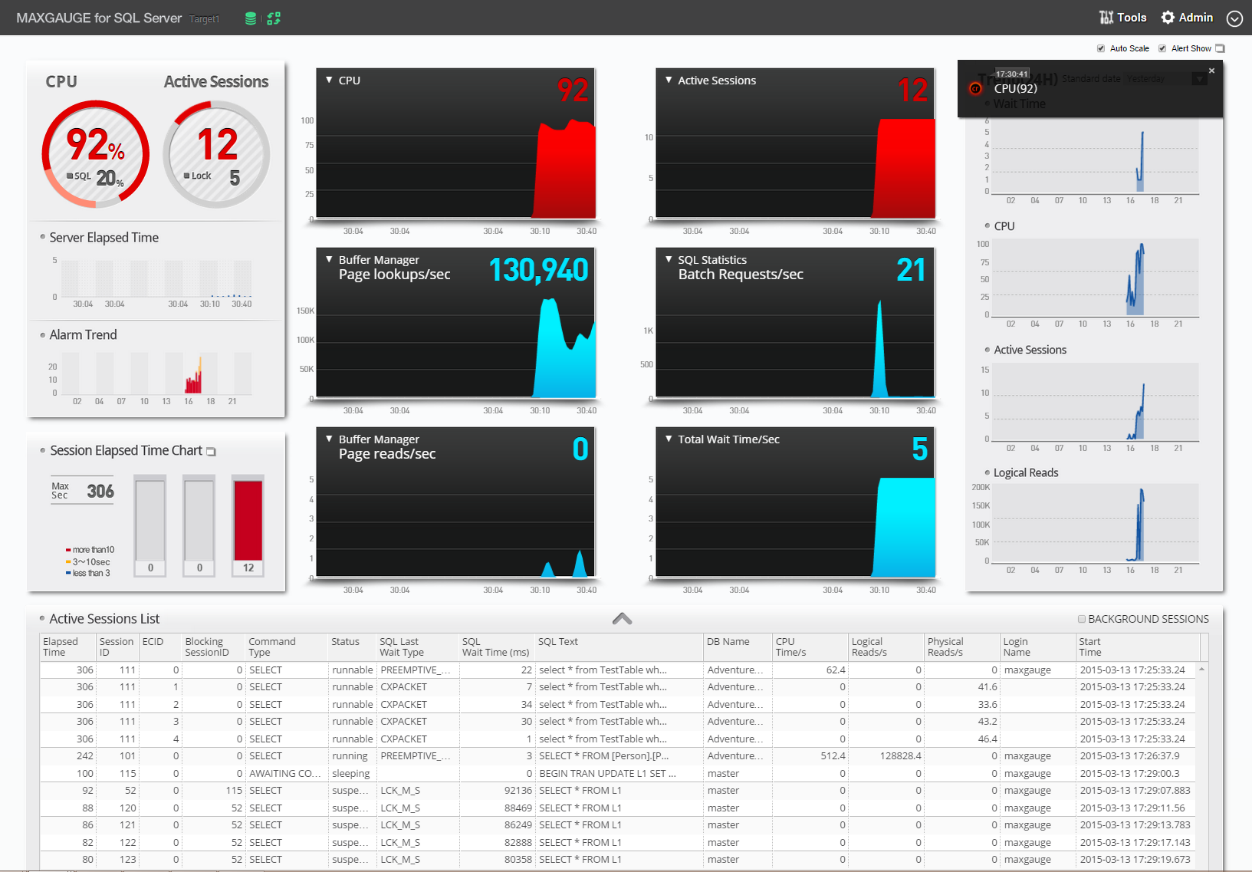
Image. Monitoring Screen in the Event of an Alarm (Critical) and ‘Alarm Show’ is checked
Back To Top
MAIN) 7. Multi View
Back To Top
Main Screen
The Multi View main screen is as follows.
On the left is the Server List menu and at the bottom is the Active Sessions List. In the center, you will find the main graphs expressed accordingly to each characteristics.
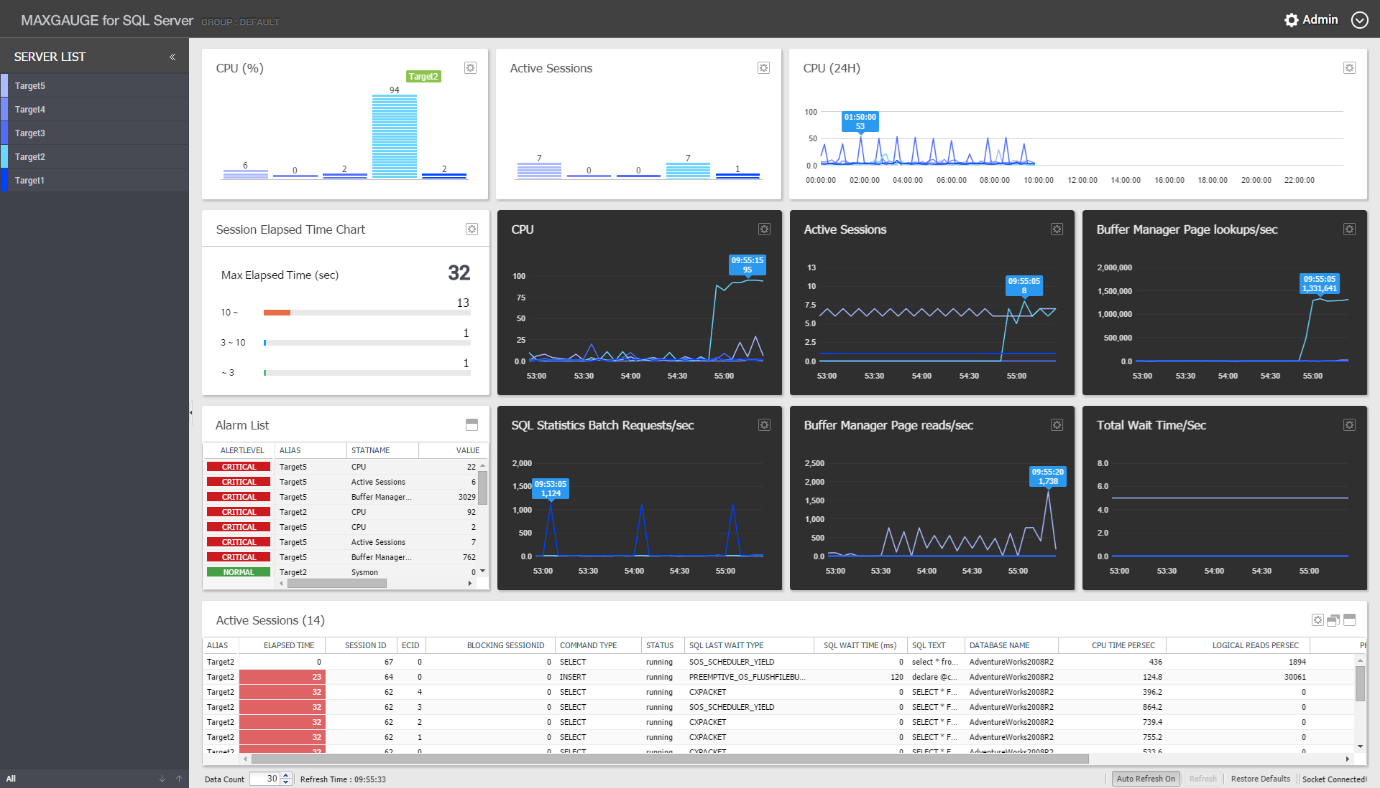
Image. Multi View Main Screen (Default)
Back To Top
Server List Area
On the Server List Area, you can verify the color designated for each server and its status.
When a database service or the SYSMON Agent service has been halted, it checks and indicates the status of the server. When a database service has stopped, it displays the message, ‘SQL Server Down’, and when a SYSMON Agent service has stopped, it displays the message, ‘Sysmon Disconnect’.
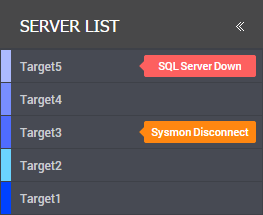
Image. Server List Area
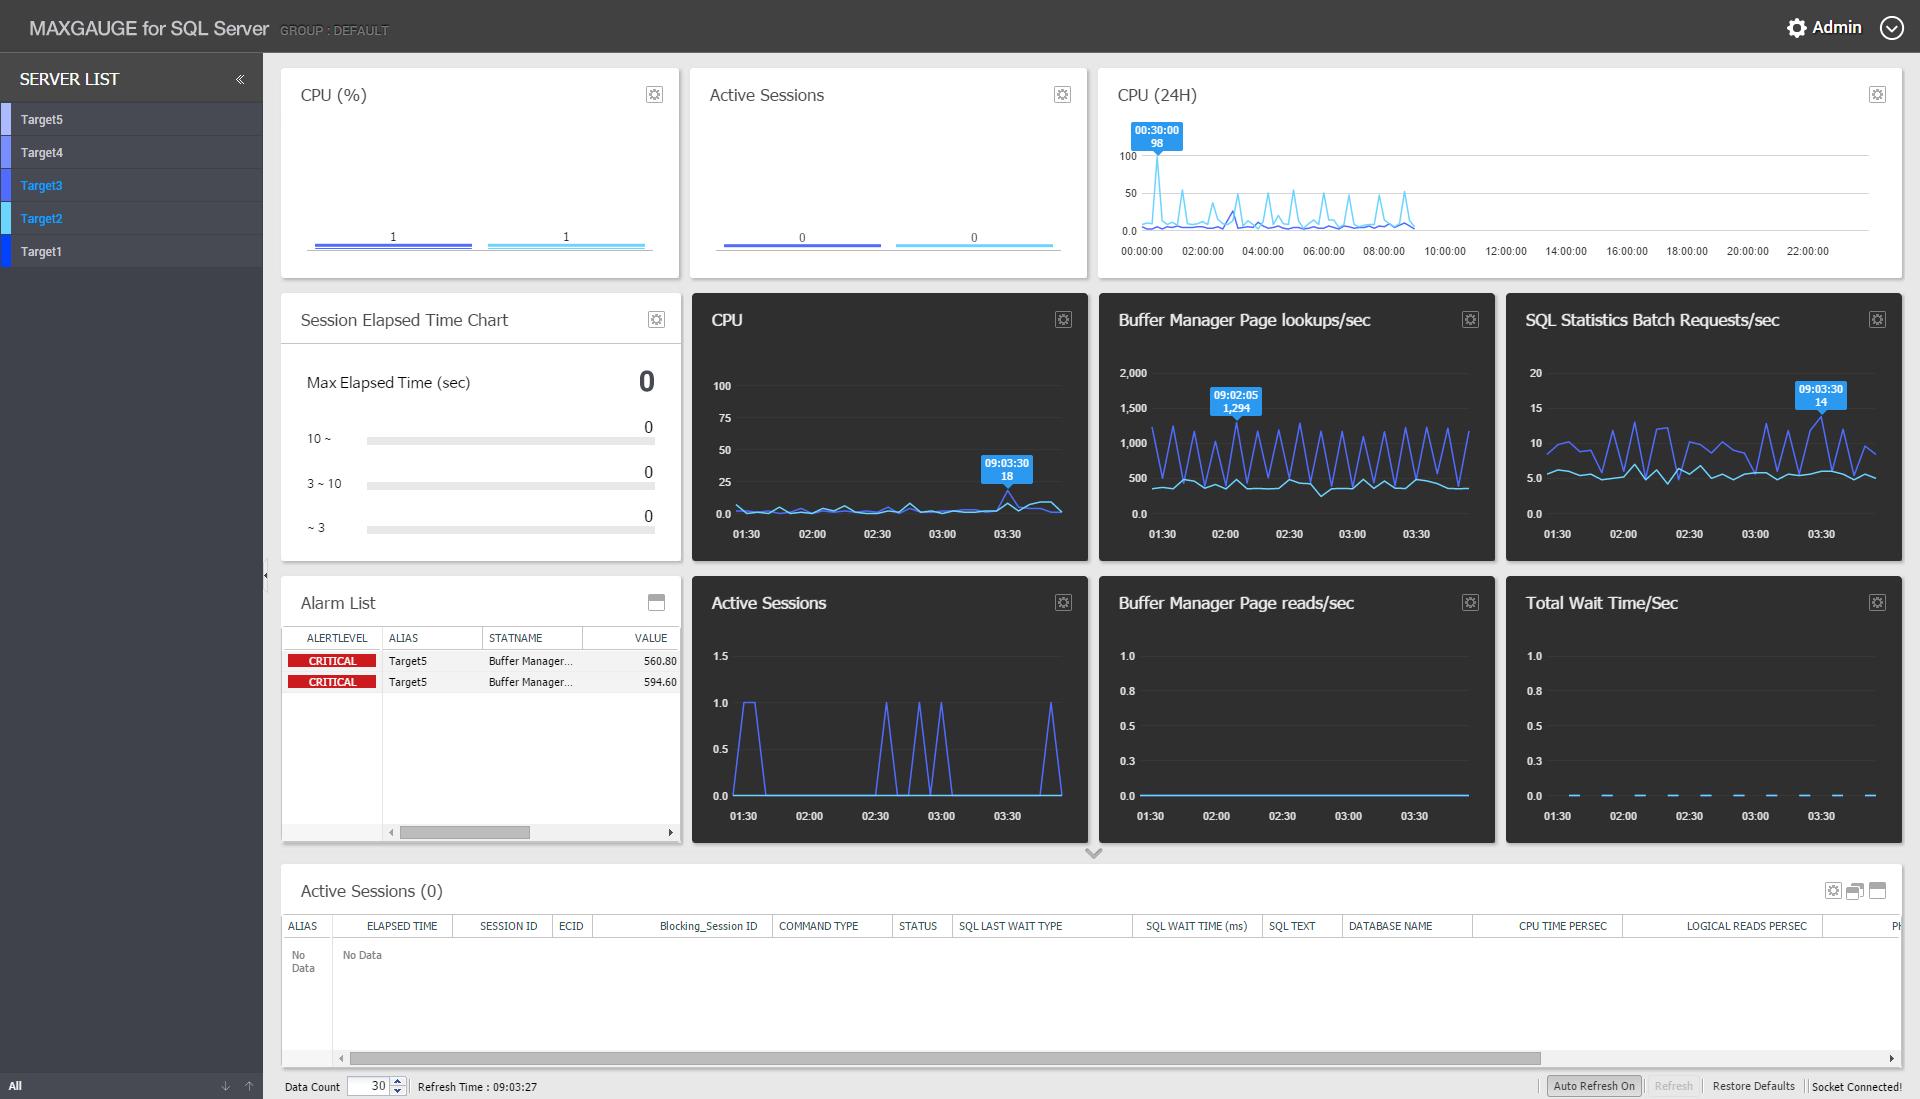
Image. Target2 and Target3 Selection Screen
The Server List area allows you to select and control a server. You can select a server with a mouse click. By using the Ctrl key, you can select multiple servers. In the Multi View graph, only the selected servers will be displayed. By default, it display all servers. You can use the Hide button to hide the server list.
Back To Top
Active Sessions Area
The Active Sessions area displays the active sessions of the server selected in the current Multi View. According to the process time, the Elapsed Time column will be indicated in color. When you double-click on a session, the Session Detail window will appear. You can filter the sessions with the mouse right-click menu. The menu options on the right top are as follows: Active Sessions Settings, Active Sessions View(new window), and Active Sessions View(current window).
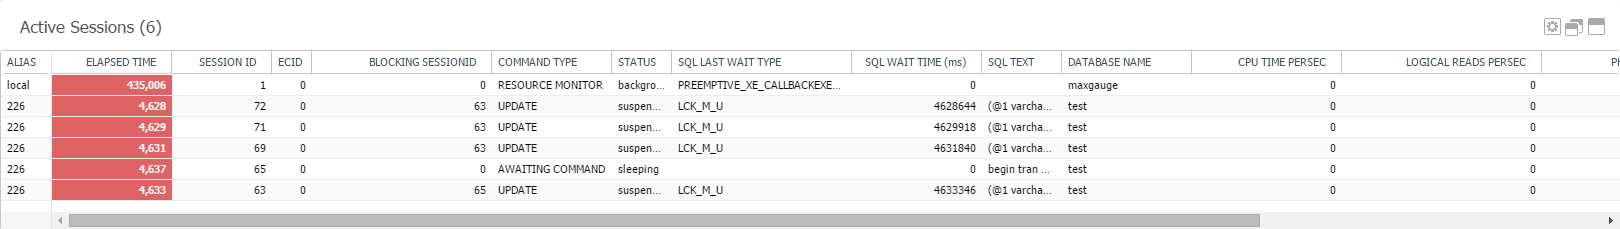
Image. Active Sessions Area
Active Sessions Settings
This is the settings screen for the Active Sessions List. You can check the active sessions filter list on this screen. You can set the Elapsed Time. When a session exceeds the set time, it will be indicated in red color. You can also filter out by the Program Name. The filtered out sessions will no longer appear on the Active Sessions List.
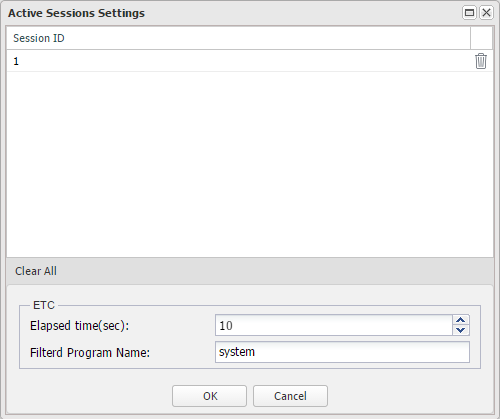
Image. Active Sessions Settings
Active Sessions View (New Window)
You can open the Active Sessions List as a new window and see it in full view.
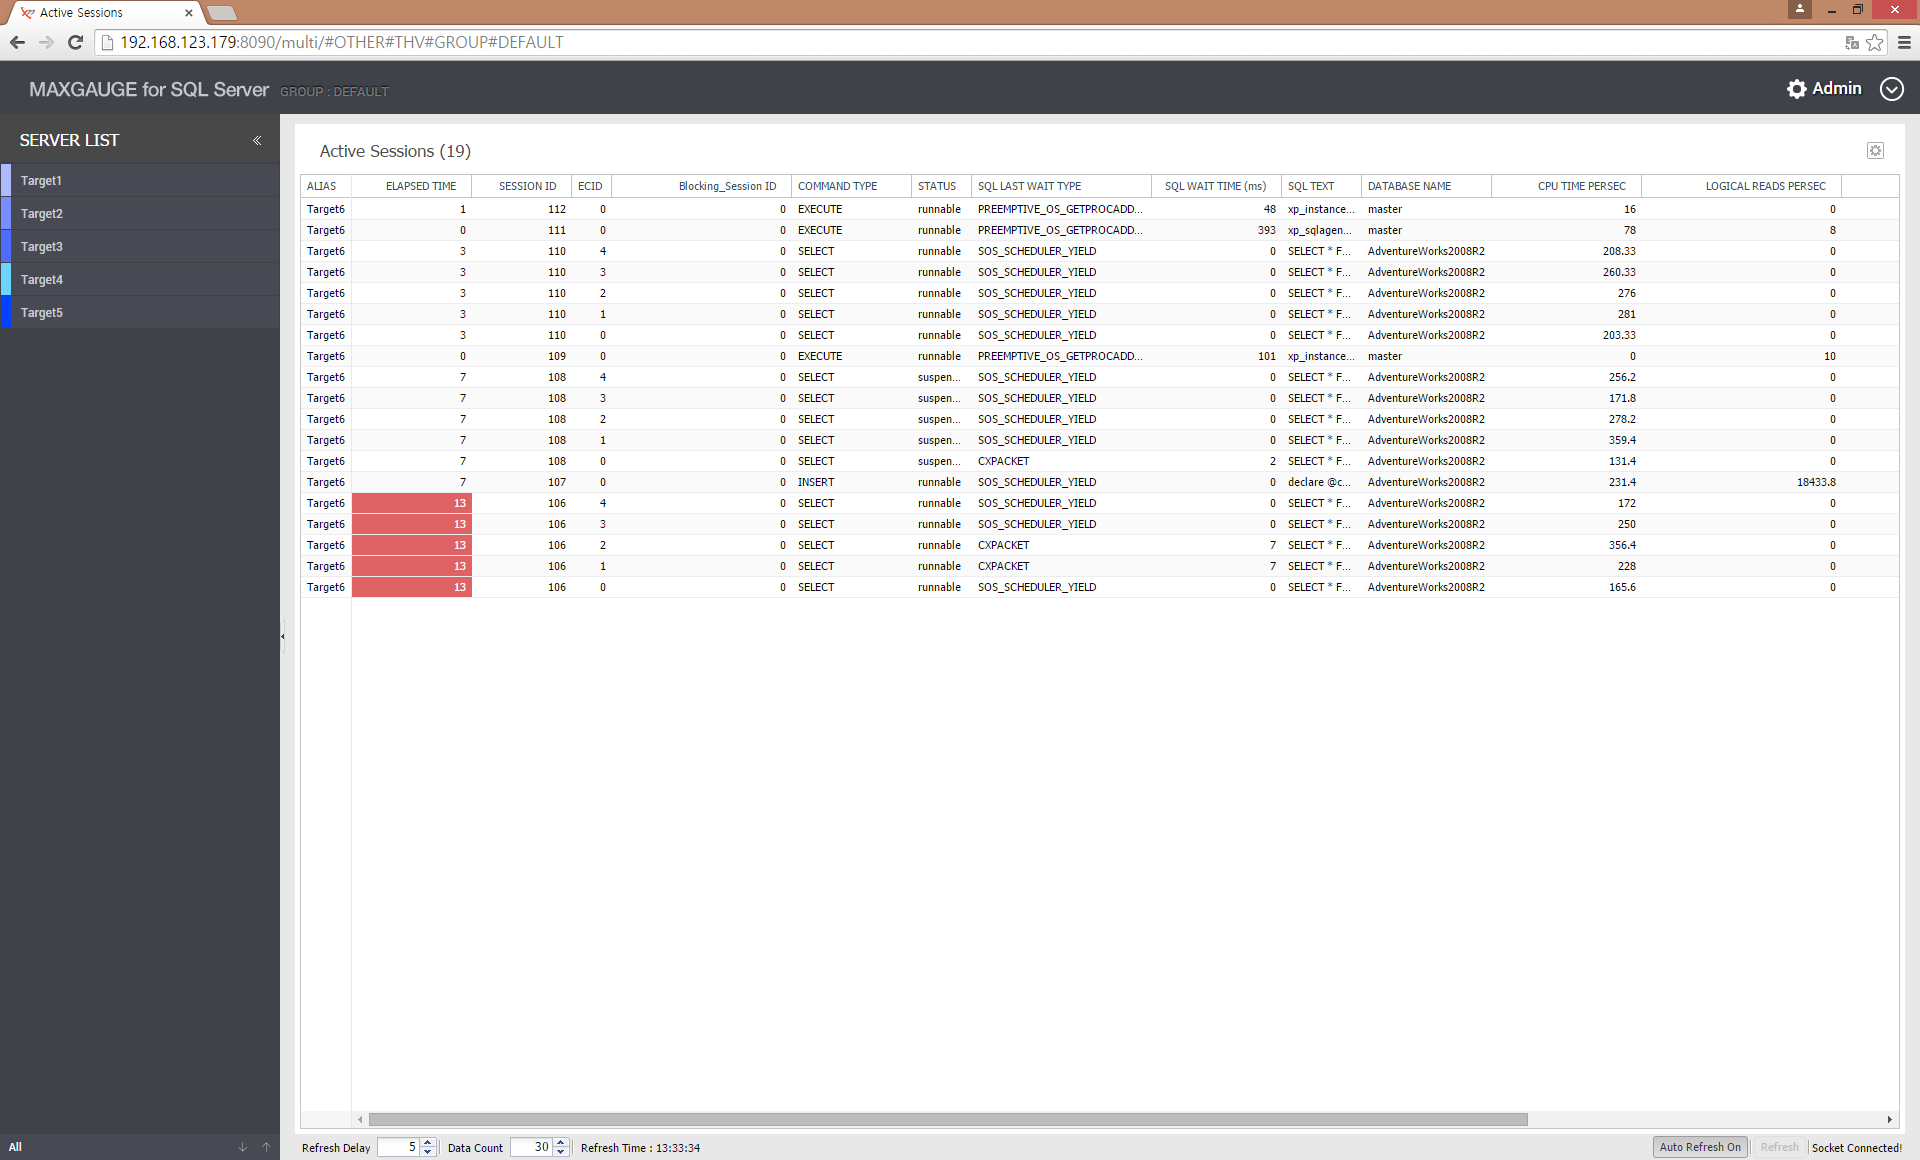
Image. Active Sessions View(New Window)
Active Sessions View (Current Window)
You can open the Active Sessions List in the current window and see the detailed session information.
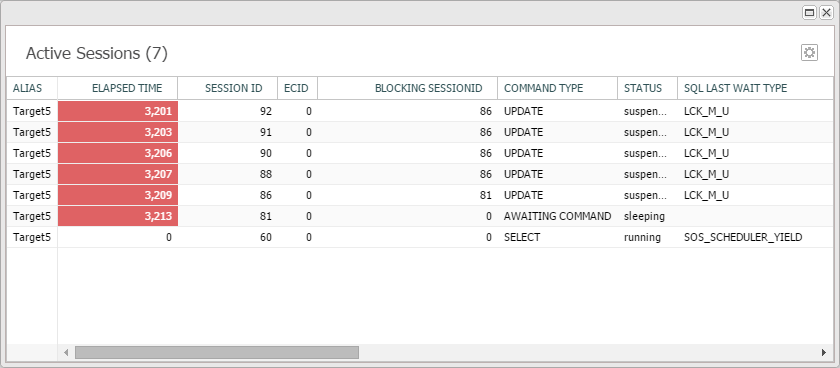
Image. Active Sessions View(Current Window)
Back To Top
Main Graph Area
In the Main Graph area, you can monitor the main performance indicators. The data is classified into 5 types of graphs according to its characteristics. When you put the mouse over the graph, its server name, graph values, and other information of the corresponding graph will be displayed. With an exception to ‘Alert List’, all other graphs have a settings button on the top right through which you can set the graph’s maximum value.
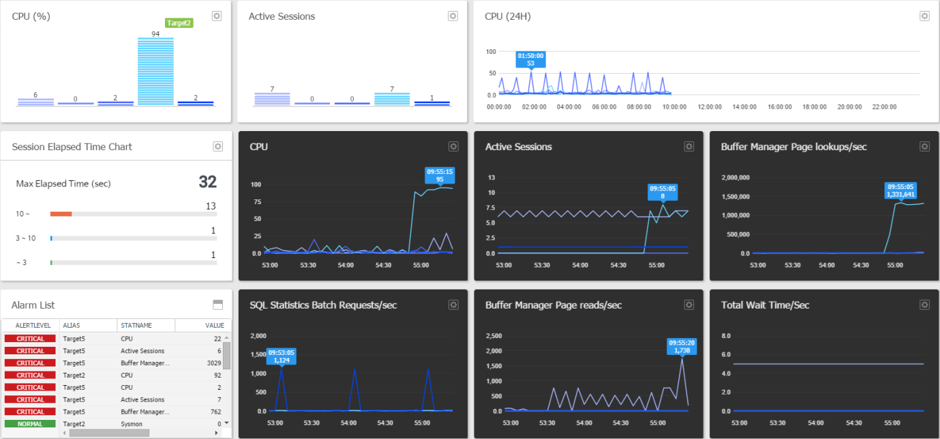
Image. Main Graph Area
Back To Top
SUB) CPU (%), Active Sessions
This grid displays the current value of CPU and Active Sessions. The CPU and Active Sessions are fixed. You can adjust the graph’s maximum values through the settings button. When you put the mouse over the graph, its corresponding server name will be displayed.
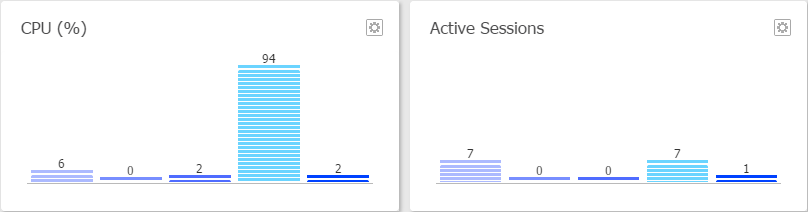
Image. CPU (%), Active Sessions Graph
Back To Top
SUB) 24 Hour Trends Graph
The 24 Hour Trends Graph displays the trends from 0 hour to the current time within the day. The time at which the value was the highest is indicated with a box displaying the time and value. You can select the indicator name and change the indicator. You can change the graph maximum value through the settings button. When you put the mouse over the graph, its corresponding server name, time, and value will be displayed.
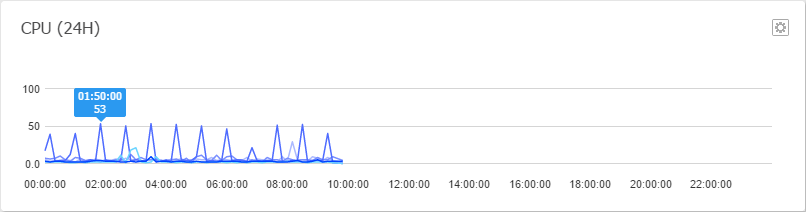
Image. 24 Hour Trends Graph
Back To Top
SUB) Session Elapsed Time Chart
The Session Elapsed Time Chart displays the distribution of execution time of the current active sessions. They are fixed into 3 categories—under 3 seconds, 3~10 seconds, and over 10 seconds. You can change the graph maximum values through the settings button.
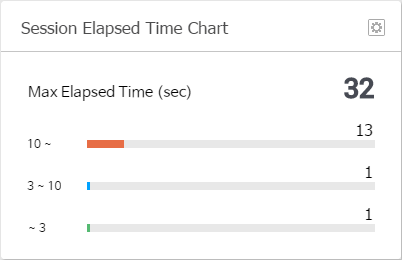
Image. Session Elapsed Time Chart
Back To Top
SUB) Alarm List
Displays the last alert generated. Click on the window button to see the full view.
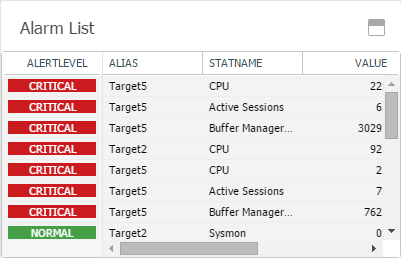
Image. Alarm List
Back To Top
SUB) Main Performance Indicator Graph
The Main Performance Indicator Graph displays 6 types of main performance indicator graphs. You can view the trends of the last 150 seconds. The time at which the indicator value was the highest is indicated with a box displaying the peak time and the peak value. You can change the indicator by clicking on the indicator name. You can adjust the graph maximum value through the settings button. When you put the mouse over the graph, the corresponding server name, time and its value will be displayed.
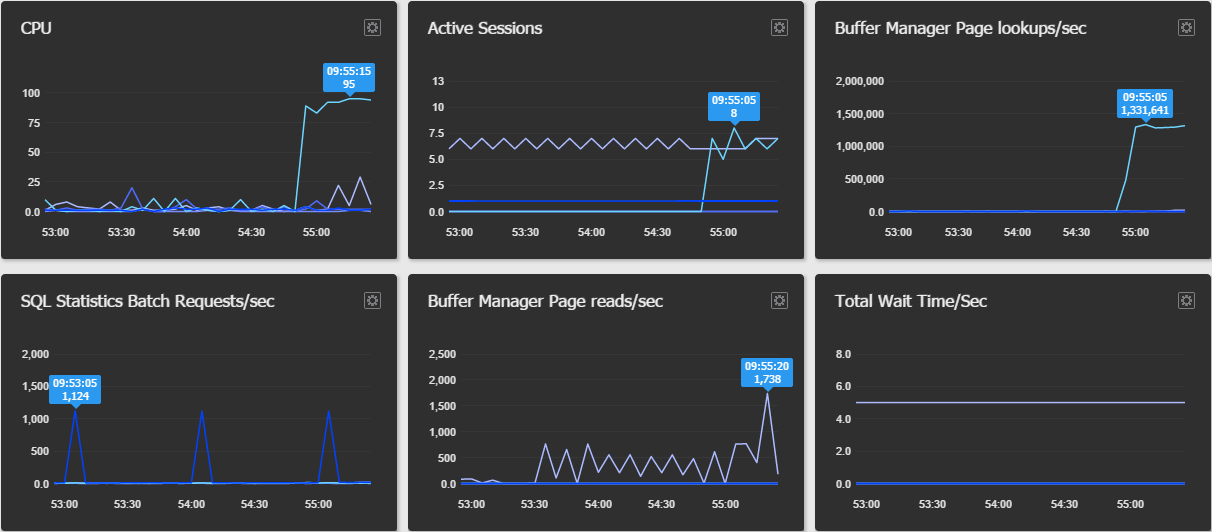
Image. Main Performance Indicator Graph
Back To Top
MAIN) 8. Performance Analyzer
Back To Top
Performance Analyzer Overview
The Performance Analyzer plays the role of analysis by replaying the instance’s performance indicator, active session, SQL statement and execution plan, and CPU indicator exactly the same as in real time by using the logged data.
The Performance Analyzer displays the instance execution status of one day. All indicators are displayed in 24 hour trends graph which helps to easily recognize the peak time, and you can analyze a specific time period by a mouse click. It allows you to organically connect to the performance indicator, session information, SQL Text and etc. to accurately analyze the peak time and the system failure time.
The Performance Analyzer is used most frequently in the following situations.
- Analyzing the cause of issues across the system overall.
- Analyzing the peak time of a specific date, Tracking down a session or a SQL
- Analyzing the system’s resource usage type and its trends
- Analyzing the cause of an instance’s hang
- Analyzing performance degradation of a specific time
- Mutual comparison of performance indicators by date
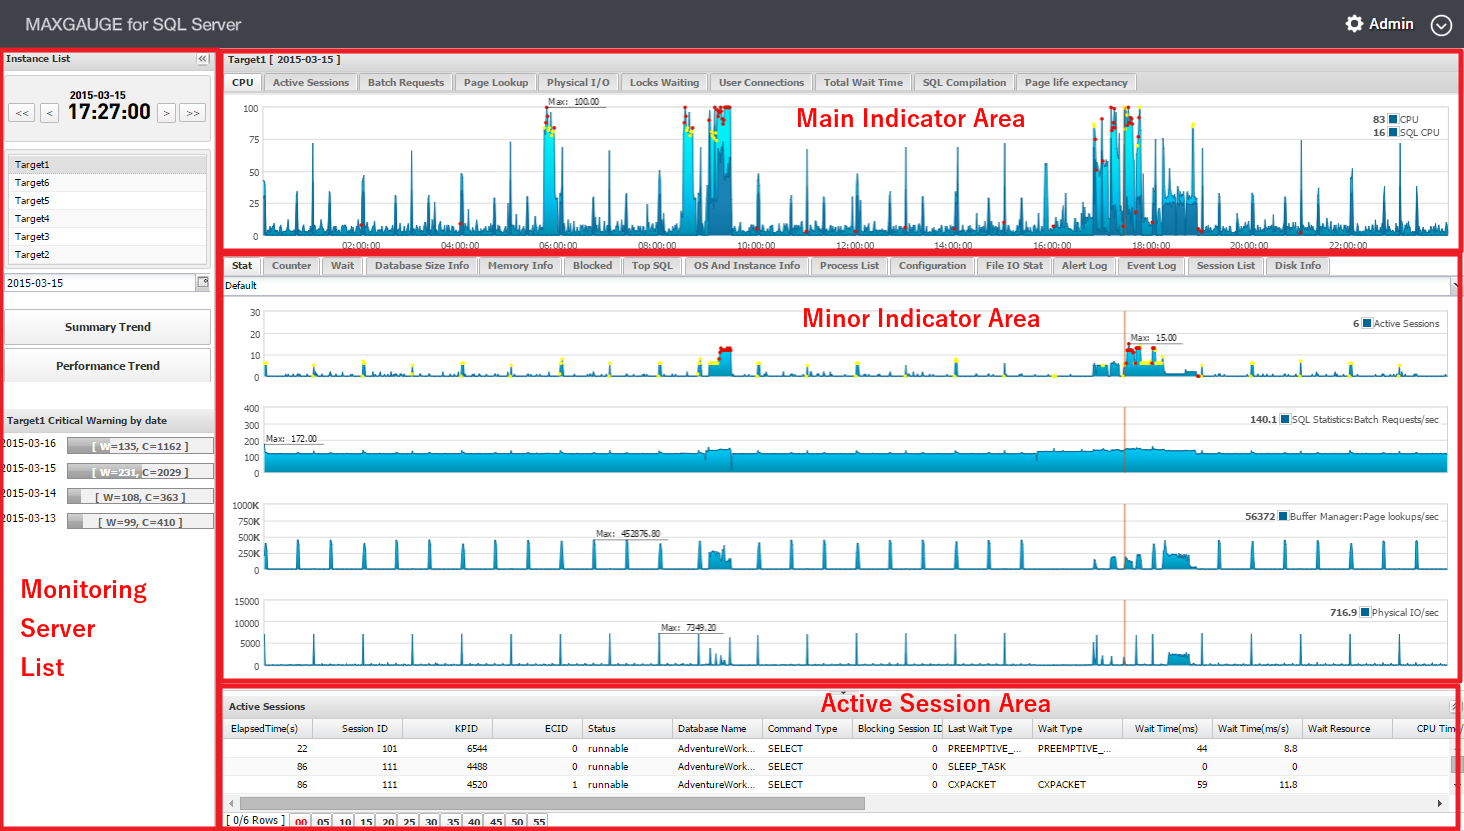
Image. PA Screen
In the top center, it displays the instance information currently being analyzed, and there is a button through which you can move to the SQLmini. When you click on the MaxGauge For SQL Server on the top left corner, you can move to the Dashboard screen.
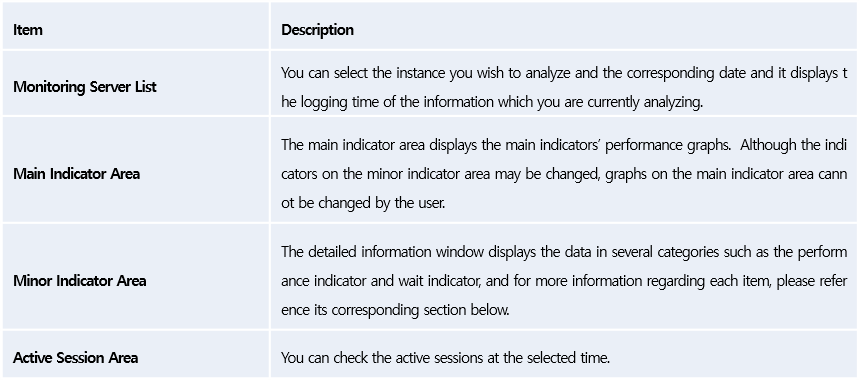
Excluding the top section, the screen can be divided into 4 areas – Monitoirng Server List, Main Indicator Area, Minor Indicator Area, and Active Session Area. Please see below for more information regarding each item.
The following table explains the 4 areas in the Performance Analyzer.
Back To Top
Monitoring Server List
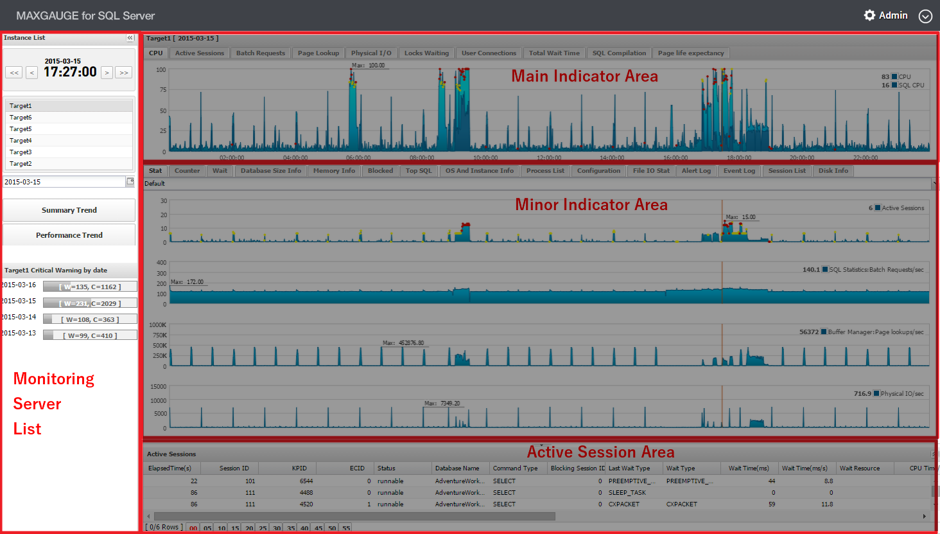
Image. Monitoring Server List
The Monitoring Server List is where you select the logging data of the date which you will analyze. There is a part where you choose the instance which you will analyze, the date, and the time on the date you selected. Once an instance is selected, you can check the ratio of Critical Alert generation of the selected instance by date. If you wish to check the trends of several dates, you can do so through the Summary Trends and the Performance Trends.
Monitoring Server List Formation
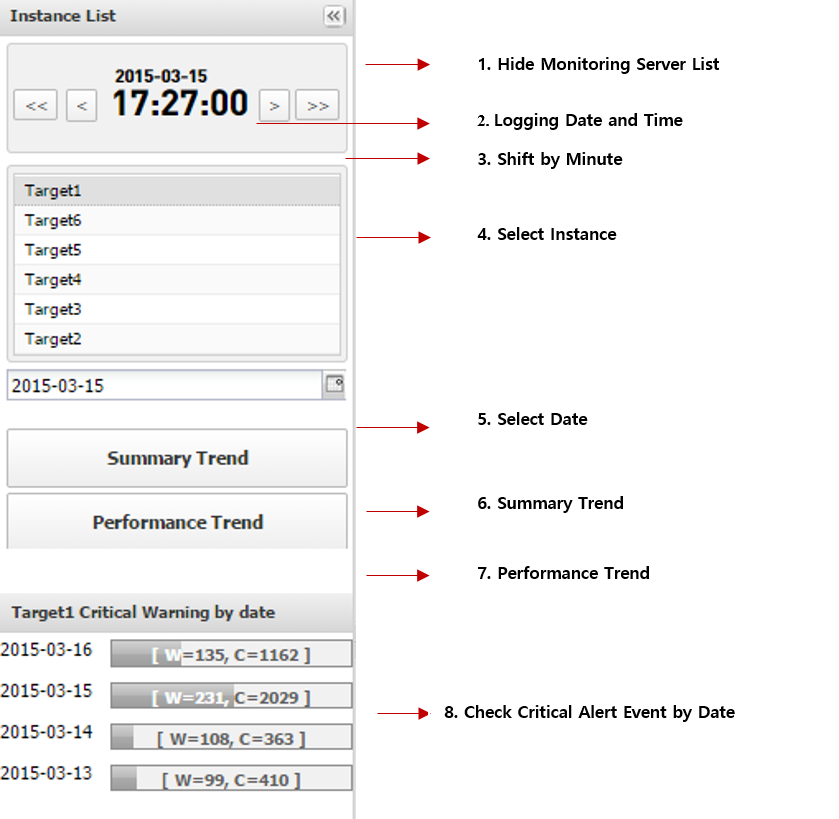
Hide Monitoring Server List:
You can hide the Monitoring Server List window to expand the view of the main indicator area, minor indicator area, and the active sessions area.
Logging Date and Time :
Displays the date you are currently analyzing and the time selected. You can move to the desired time by clicking on the time.
Shift by Minute :
You can change the time forward or backward in measure of minutes.
Select Instance :
This is the first selection you need to make in order to select the logging data for analysis. A list of instances is output for your selection.
Select Date :
After selecting the instance in number 4 above, you can choose the date you wish to analyze.
(After completing number 4 and 5, you can start analyzing the date of the instance which you have selected.)
Summary Trend :
Set the dates and the counter of whose trends you wish to know, and you can find out the average value and the maximum value for each 1 day period.
Performance Trend :
When you set the dates and select an indicator to see its 24 hour trends graph for the dates you selected.
Critical Alert Events by Date:
Displays the count of values that correspond to critical values according to the threshold values set for the counter, by date.
Summary Trend
The Summary Trend is a function through which you can check the trends of logs of several days by each indicator at once, instead of looking at each day’s log. You can see the server’s usage trends and performance trends over a period of one month or one week, on a single screen.
You can check the daily average and peak value by each stat in a graph, and even download the information into an excel file as well.
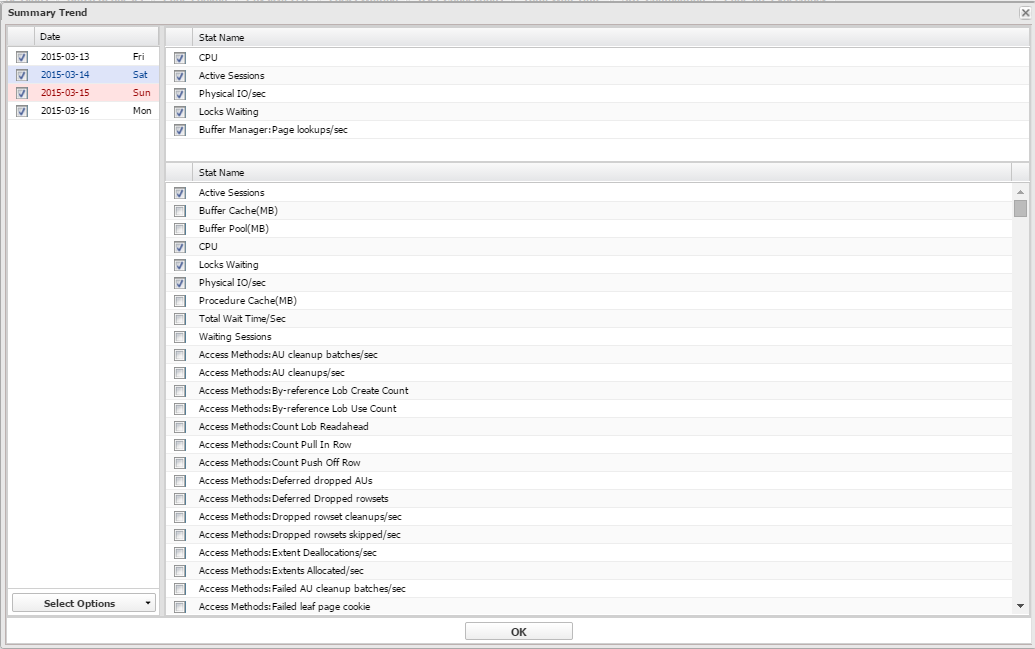
Image. Select Summary Trend Screen
You can check the trends by following these steps: Select Instance –> Trend Day Analysis –> Select Date for Trends –> Select Performance Counter.
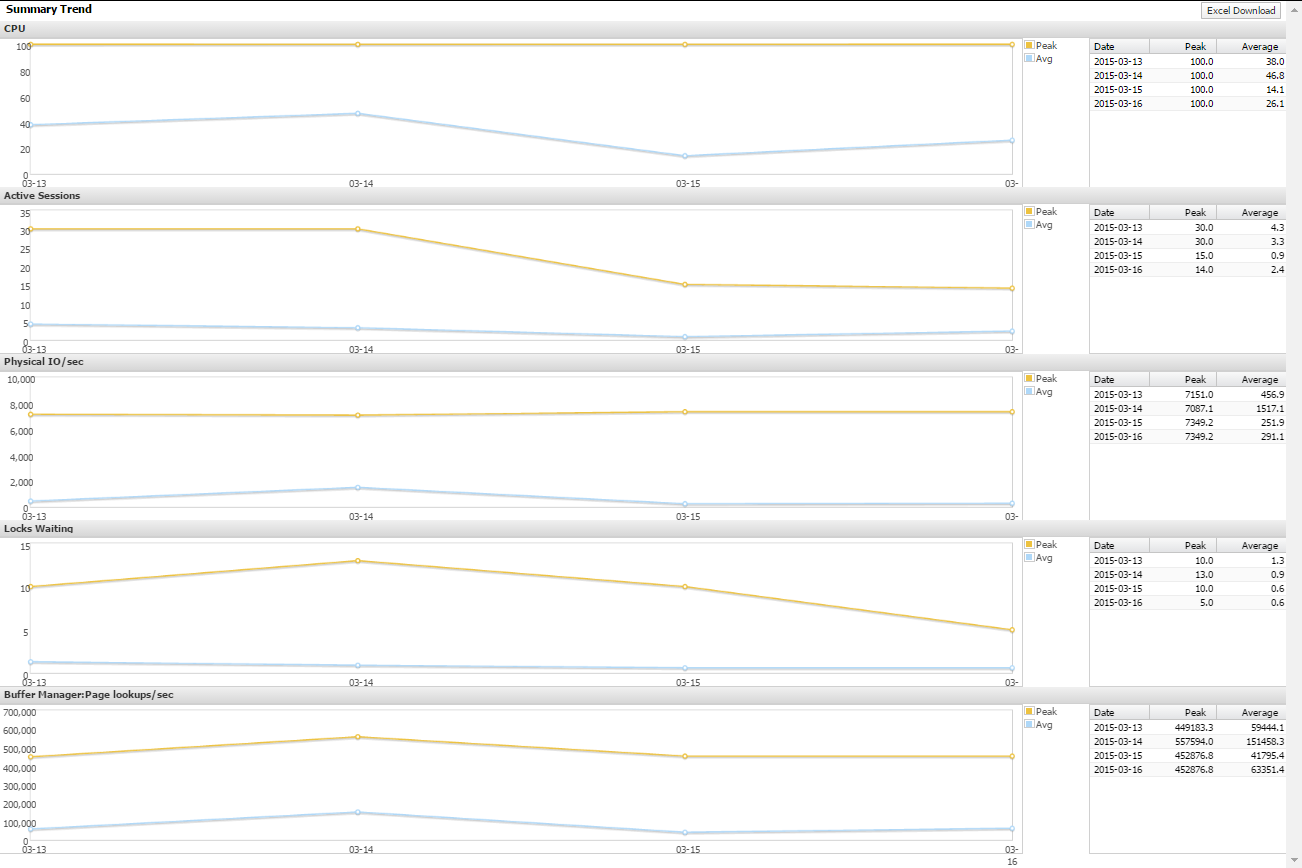
Image. Summary Trend Execution Screen
Performance Trend
The Performance Trend is a function through which you can check the trends of logs of several days instead of looking at a log taken for a day for a specific indicator. You can see the server’s usage trends and performance trends over a period of one month or one week, on a single screen. You can also see the graph showing for one day period, by date.
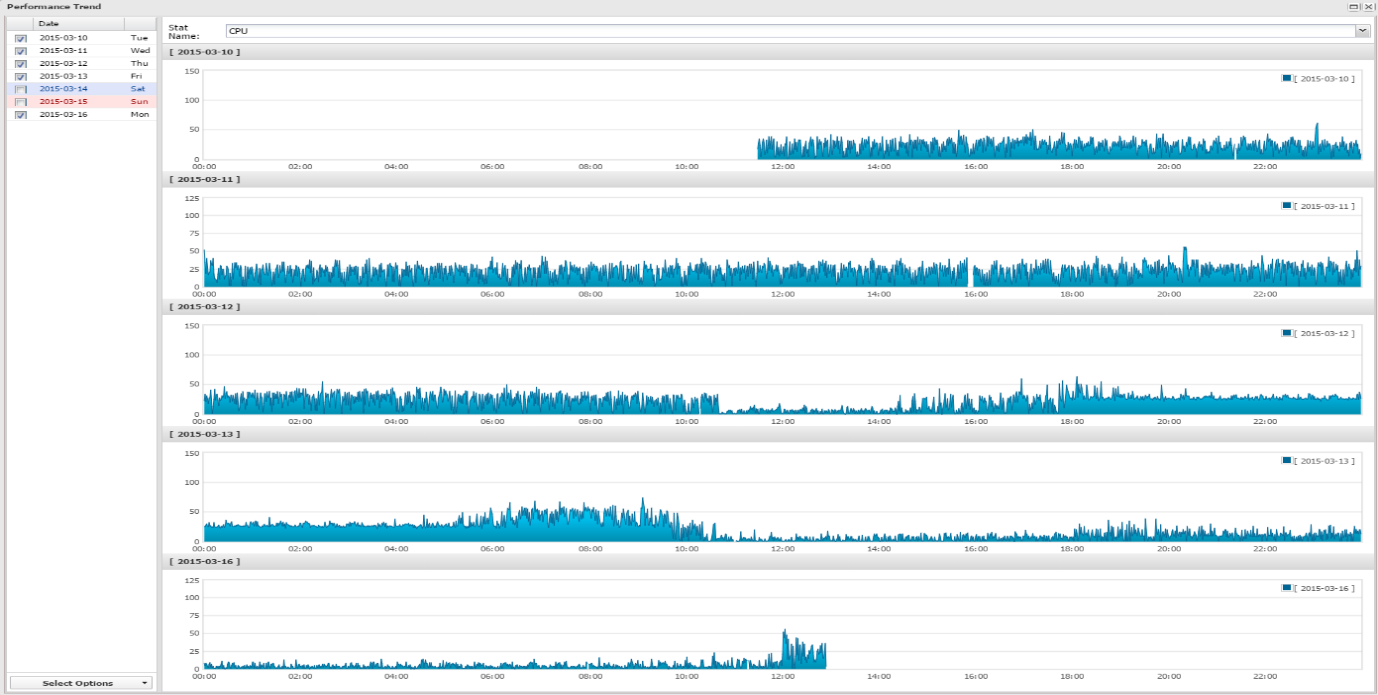
Image. Performance Trend Settings and Execution Screen
Back To Top
Main Indicator Area
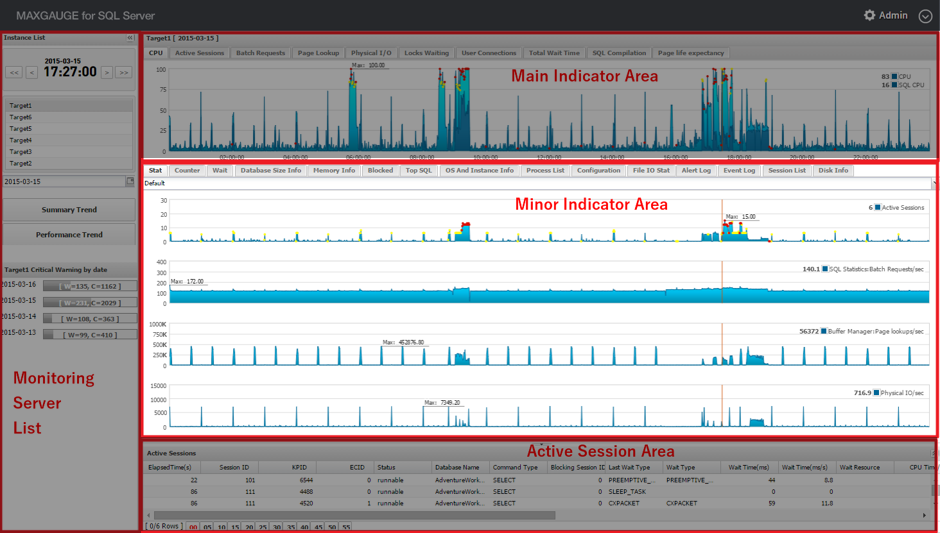
Image. Main Indicator Area
The Main Indicator Area displays the main performance indicators provided in the SQL Server including, CPU and Active Sessions.
The following explains the items displayed in the Main Indicator Area.
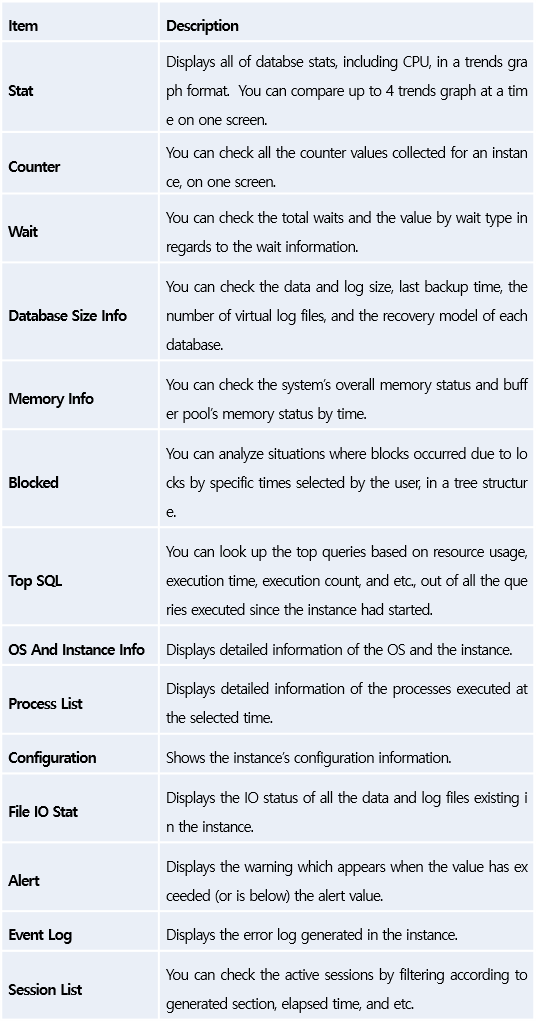
Stat Tab
The Stat Tab displays trends graph by using the performance indicator data generated in between sections.
Through the Stat graph, you can easily recognize the instance’s peak time, and you can go to specific time by clicking on the graph. You can easily identify the sessions which triggered the peak times by comparing with the active session area.
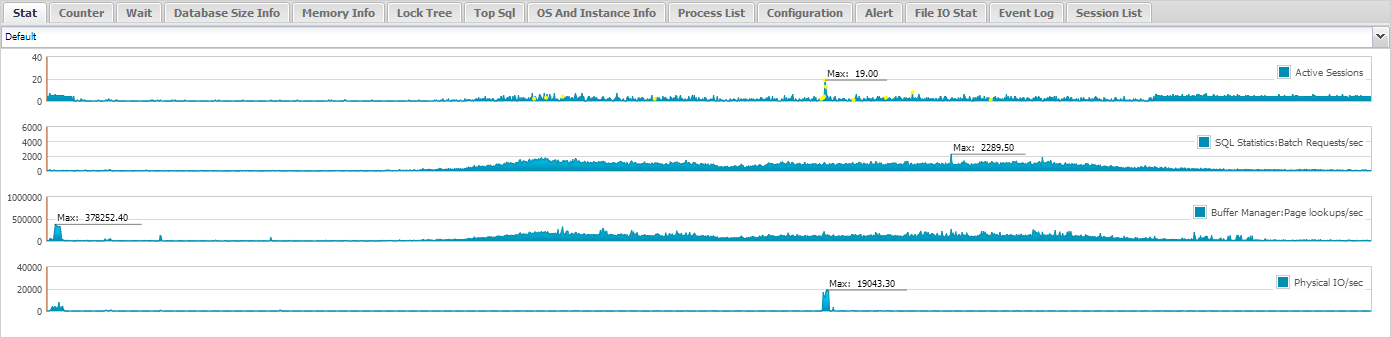
Image. Stat Tab
On the Stat Tab, you can check up to 4 indicators at once. The user can change which indicators to be displayed. To change to a different indicator, click on performance indicator name located on the right side of the indicator and then select the desired indicator name. If you click on Default, there are 5 items – Default, Memory, Disk, CPU, and Executions – and each item has its own preset main performance indicators.
Counter Tab
The Counter Tab displays the value and the name of the performance indicator generated in between the sections during the collection period. You can check all the performance indicators collected in MaxGauge For SQL Server.
The following explains the items in the Counter Tab.
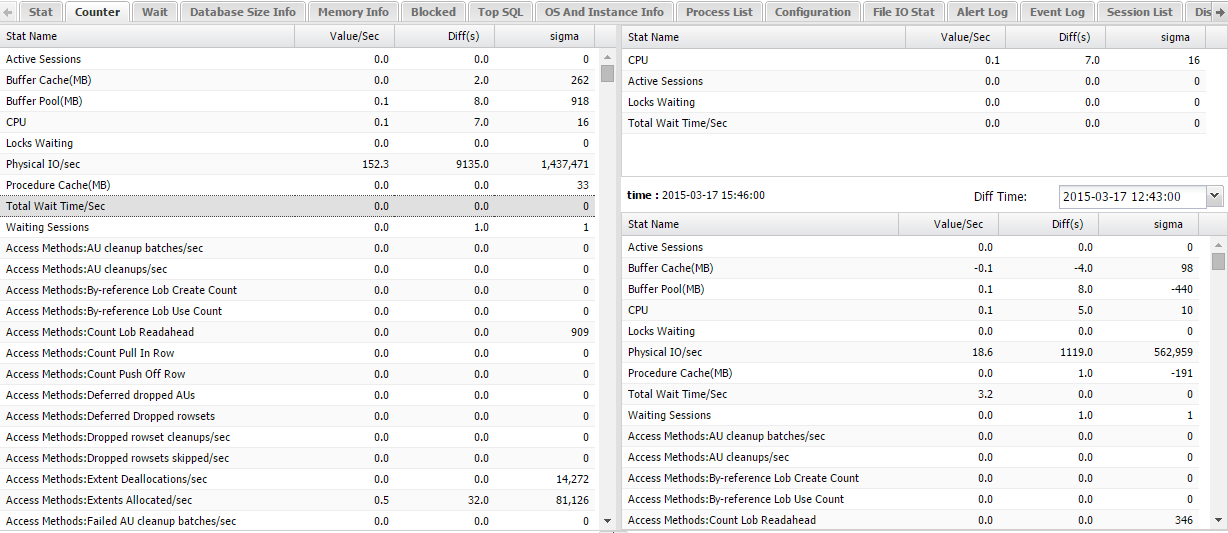
Image. Counter Tab
The counter of the currently selected time will be indicated. All the collected performance indicators will be displayed on the left side and when you select an indicator, the corresponding indicator will copied onto the right screen for your convenience. On the right bottom, you can select data to compare with the current values.
Wait Tab
The Wait Tab displays information of waits generated at the corresponding time.
The following explains items in the Wait Tab.
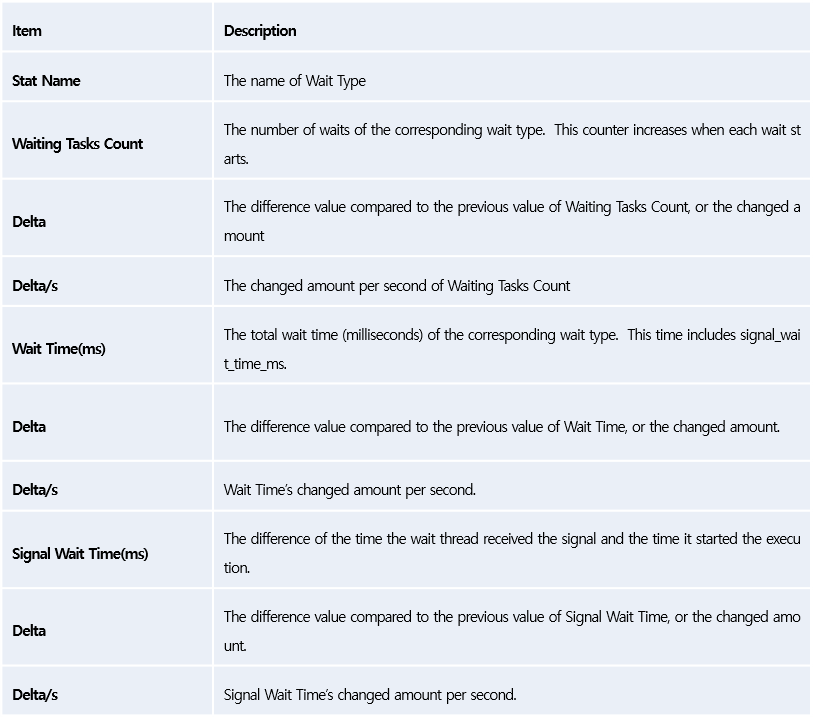
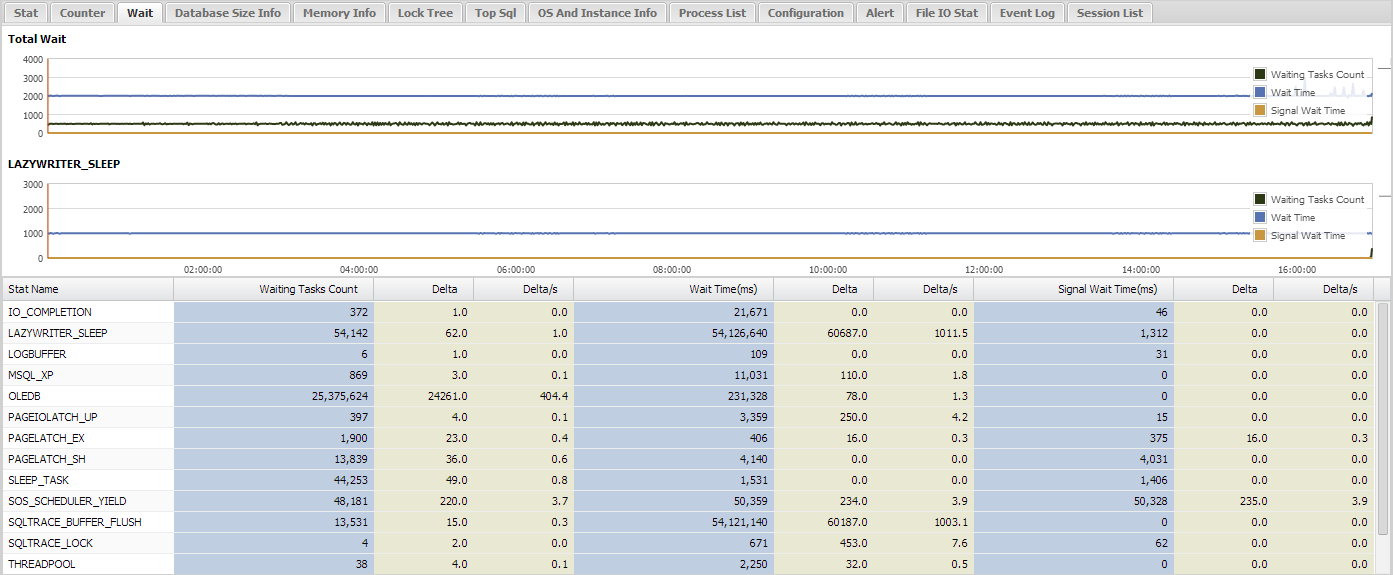
Image. Wait Tab
The very top graph is the Total Wait Graph which indicates the total waits at the corresponding time and it is fixed.
For the second graph, the user can choose the wait type to be displayed on the second graph.
The user can choose from the wait table in the third section. This wait table does not display all the waits but only the types of waits which show changes in the value and allows you to see the wait information at a glance.
Database Size Info Tab
The Database Size Info Tab displays the data and log size, the number of virtual log files, last backup time, and recovery model information by each database.
The following explains the items in the Database Size Info.

The following explains the items which appear when a specific database has been selected.
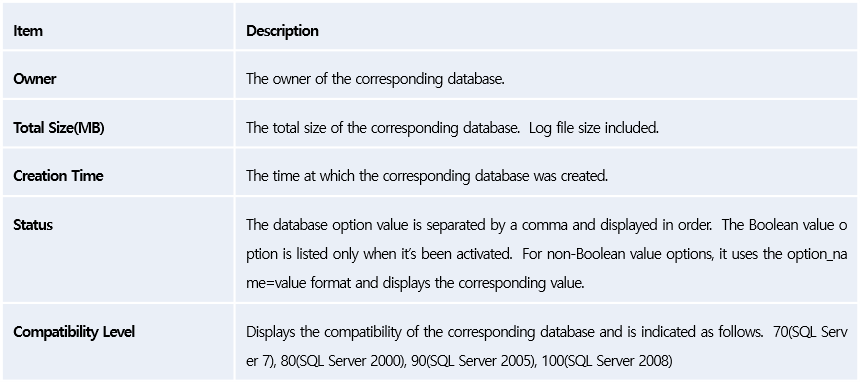
The following explains the items which appear when a specific database has been selected.
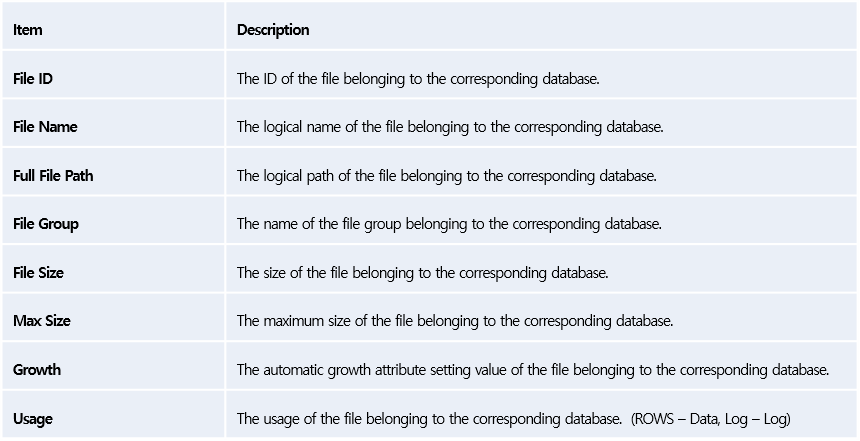
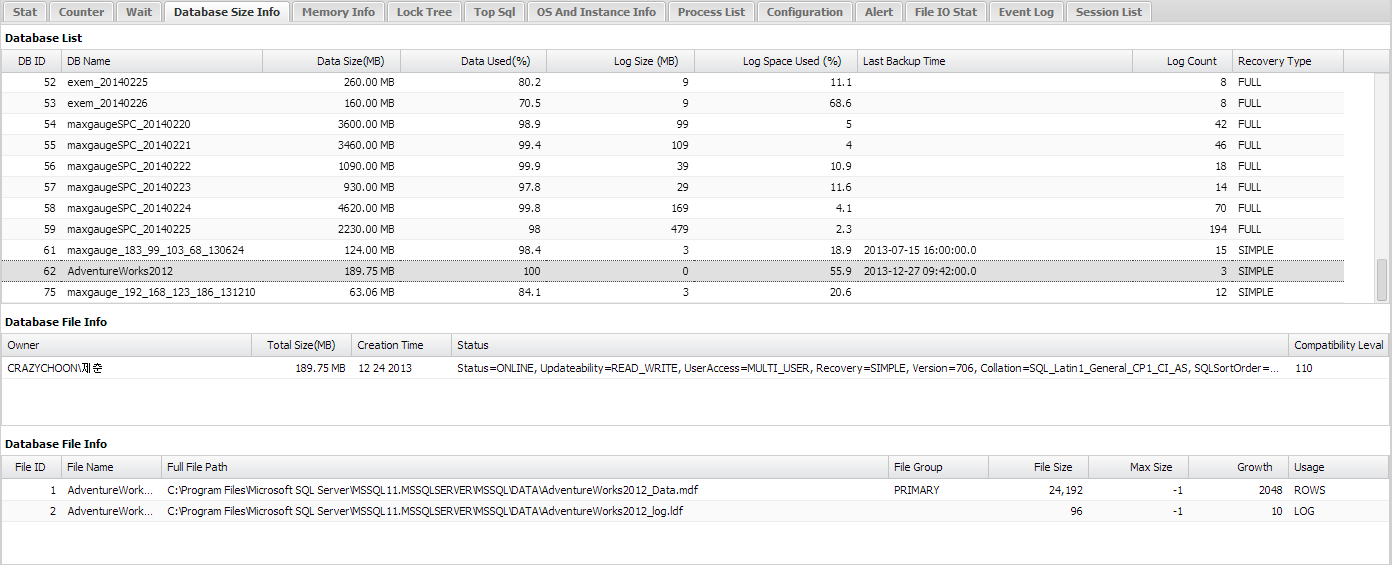
Image. Database Size Info Tab
Memory Info Tab
The Memory Info Tab allows you to instantly check the total memory usage status and the Buffer Pool usage status. You can also check the objects with the highest memory usage among all the objects in Buffer Cache, and the Procedure Cache usage status as well.
The left bottom table displays system’s total memory size, SQL Server Buffer Pool Size ,and Thread Stack Size, and the left graph displays detailed information of the Buffer Pool (Buffer Cache Size, Procedure Cache Size, Others, Free Space and Unallocated Size).
The right grid displays detailed information of the Procedure Cache and Buffer Cache.
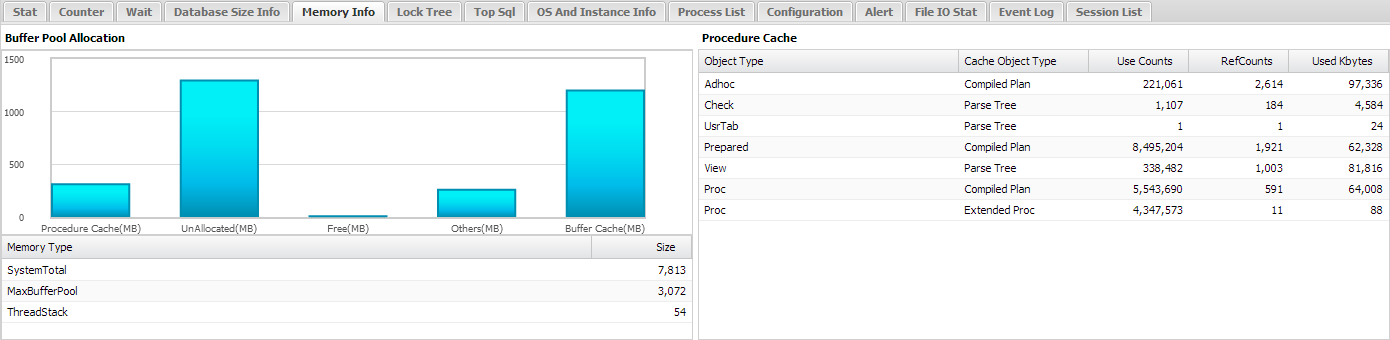
Image. Memory Info Tab
Blocked Tab
The Blocked Tab displays the relationship between the Lock Holder Session and the Wait Session with respect to the time at which the lock occurred, in a tree structure format. It displays not only the Lock Request Mode, Holder/Waiter SQL Text, and the Wait Time, but it also allows you to quickly evaluate the lock relationship among the sessions. This screen is configured to be the same in real time as the Lock Tree.
The following explains the items in Lock Tree screen.
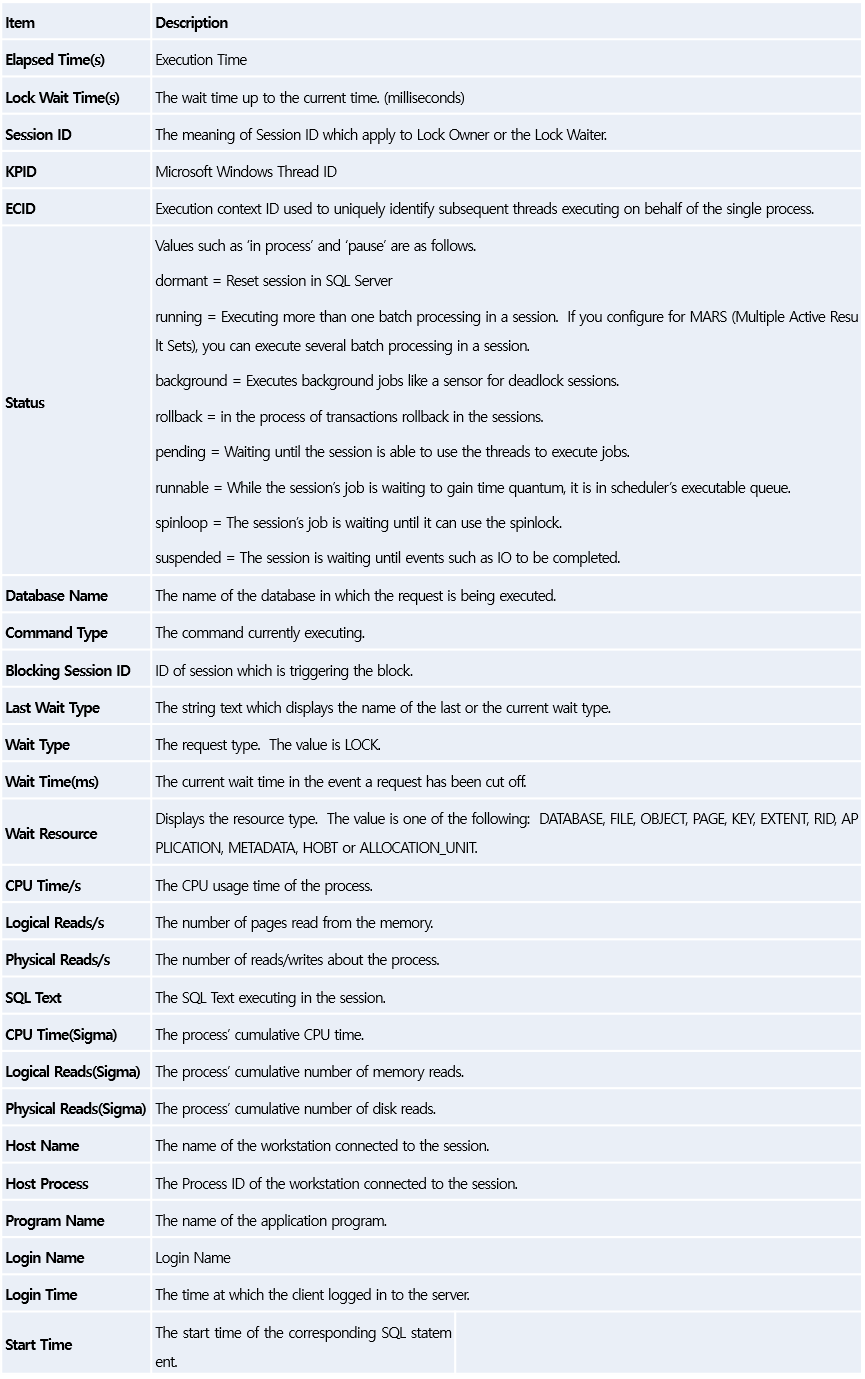
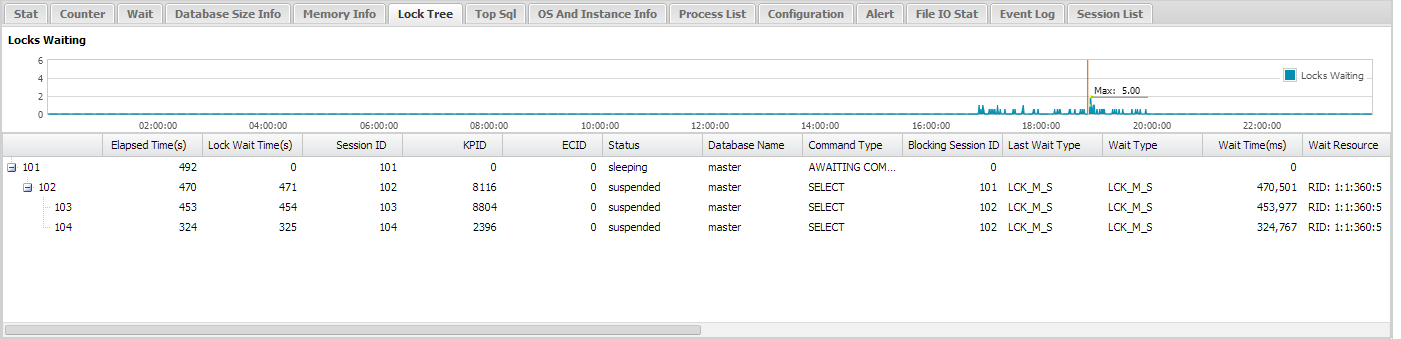
Image. Lock Tree Tab
Top SQL Tab
On this tab, you can check the most executed SQL statement. All SQL statements or per each performance counter, the SQL text can be saved as much as the setting amount. This can be set in the service manager. The SQLs are listed in the descending order of the execution count, and you can also sort by physical reads, logical reads, and execution time.
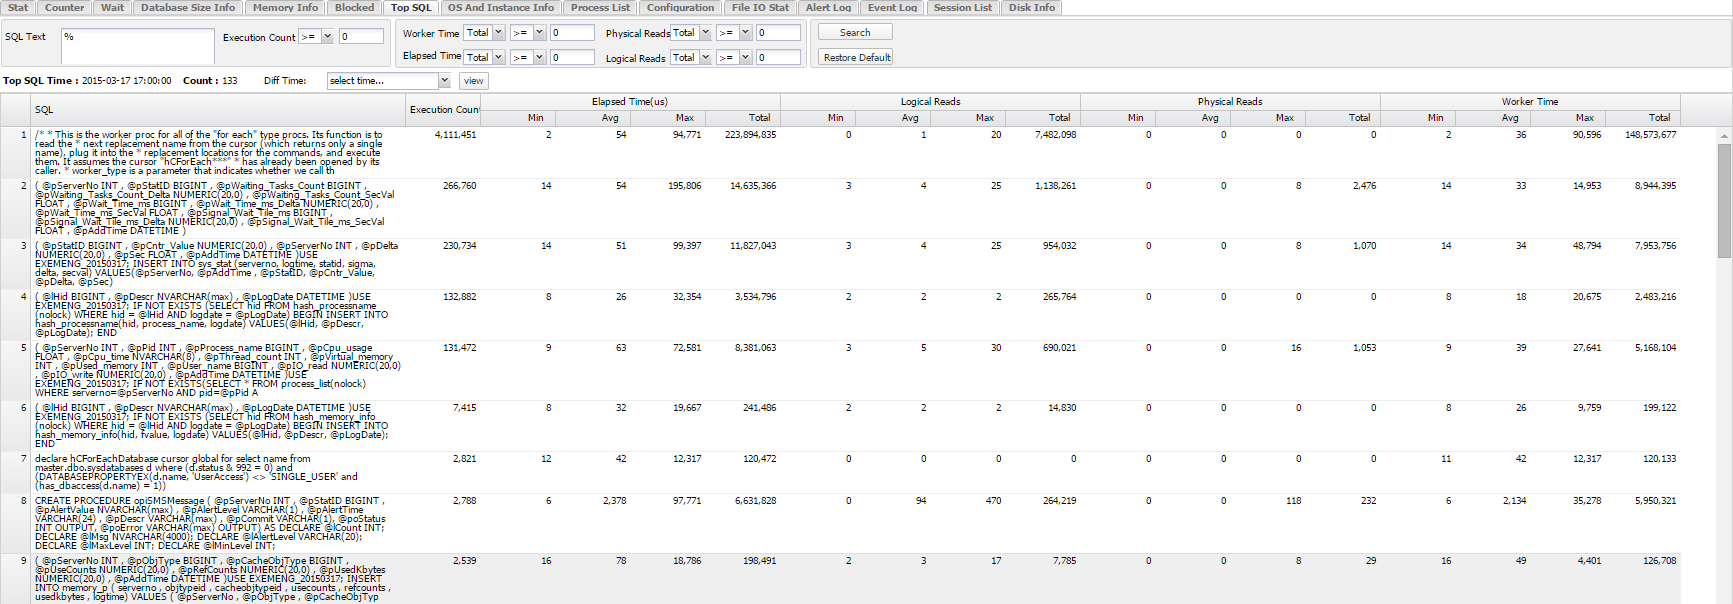
Image. Top SQL Tab
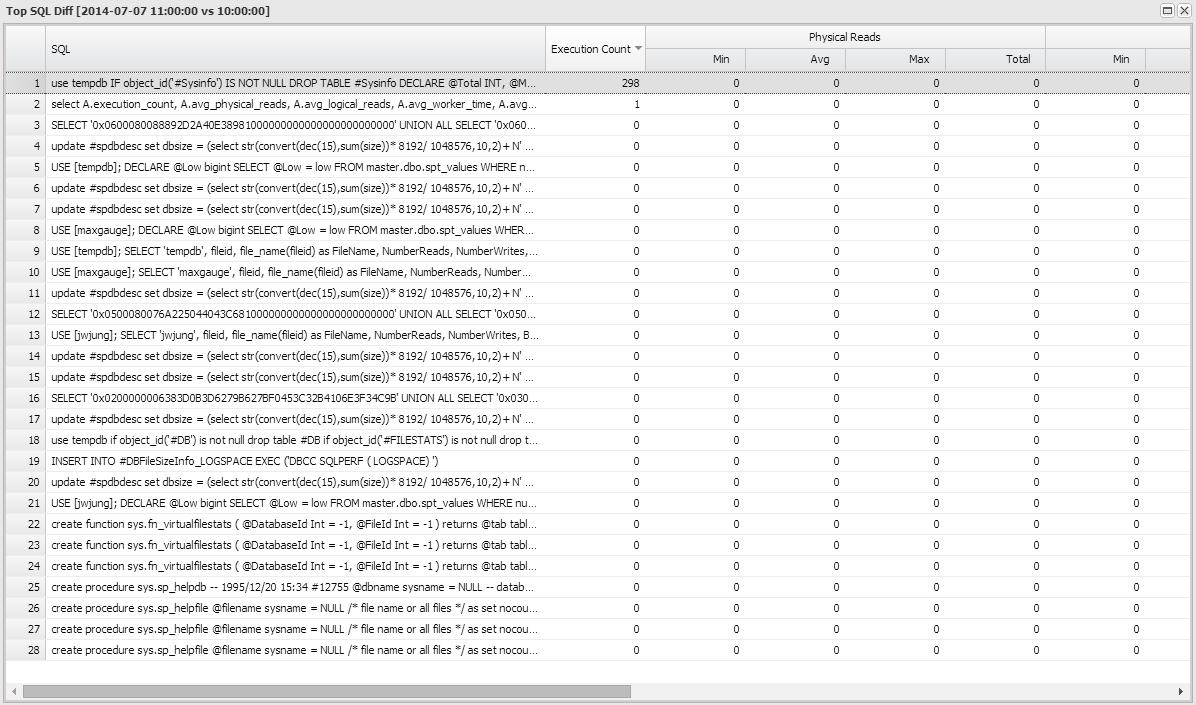
Image. Top SQL Comparison
In the bottom section of the SQL screen, you will find the Top SQL comparisons. You will be able to see the difference in the Top SQLs between the selected time and the current time.
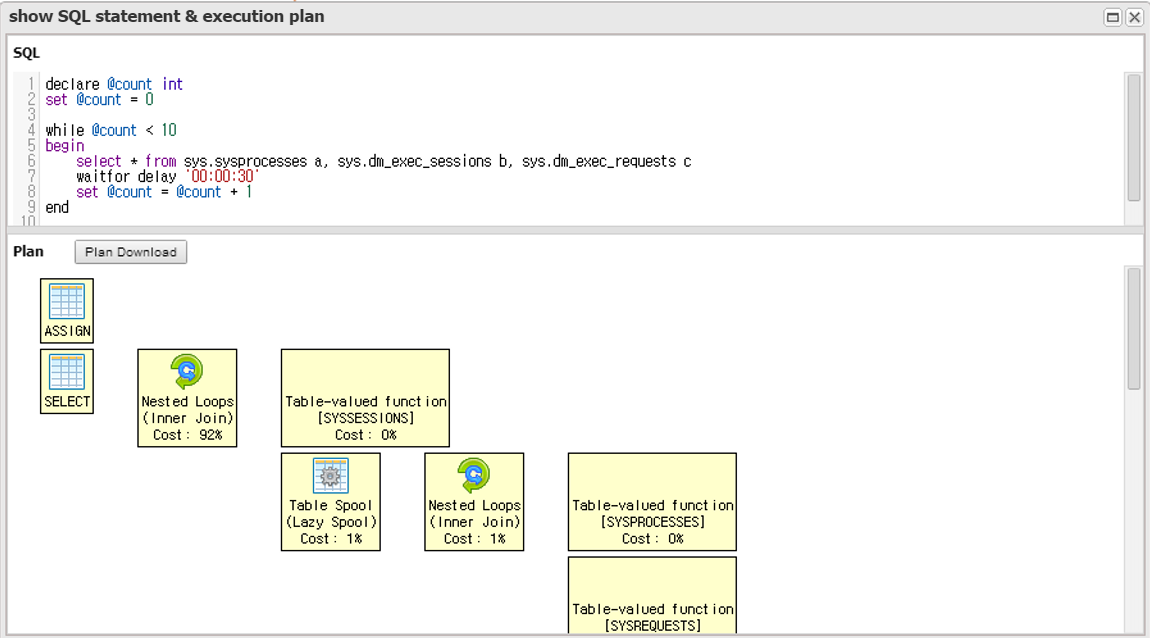
Image. SQL Command Text & Execution Plan
OS And Instance Info Tab
This tab provides detailed information of the OS and the instance. It not only provides the OS version and serivce pack information, but it also provides various information such as the total memory size, the number of processes, SQL Server version, Service Pack, and collation. The items may be different depending on the installed OS and SQL server version.
The following explains the items on the OS And Instance Info screen.
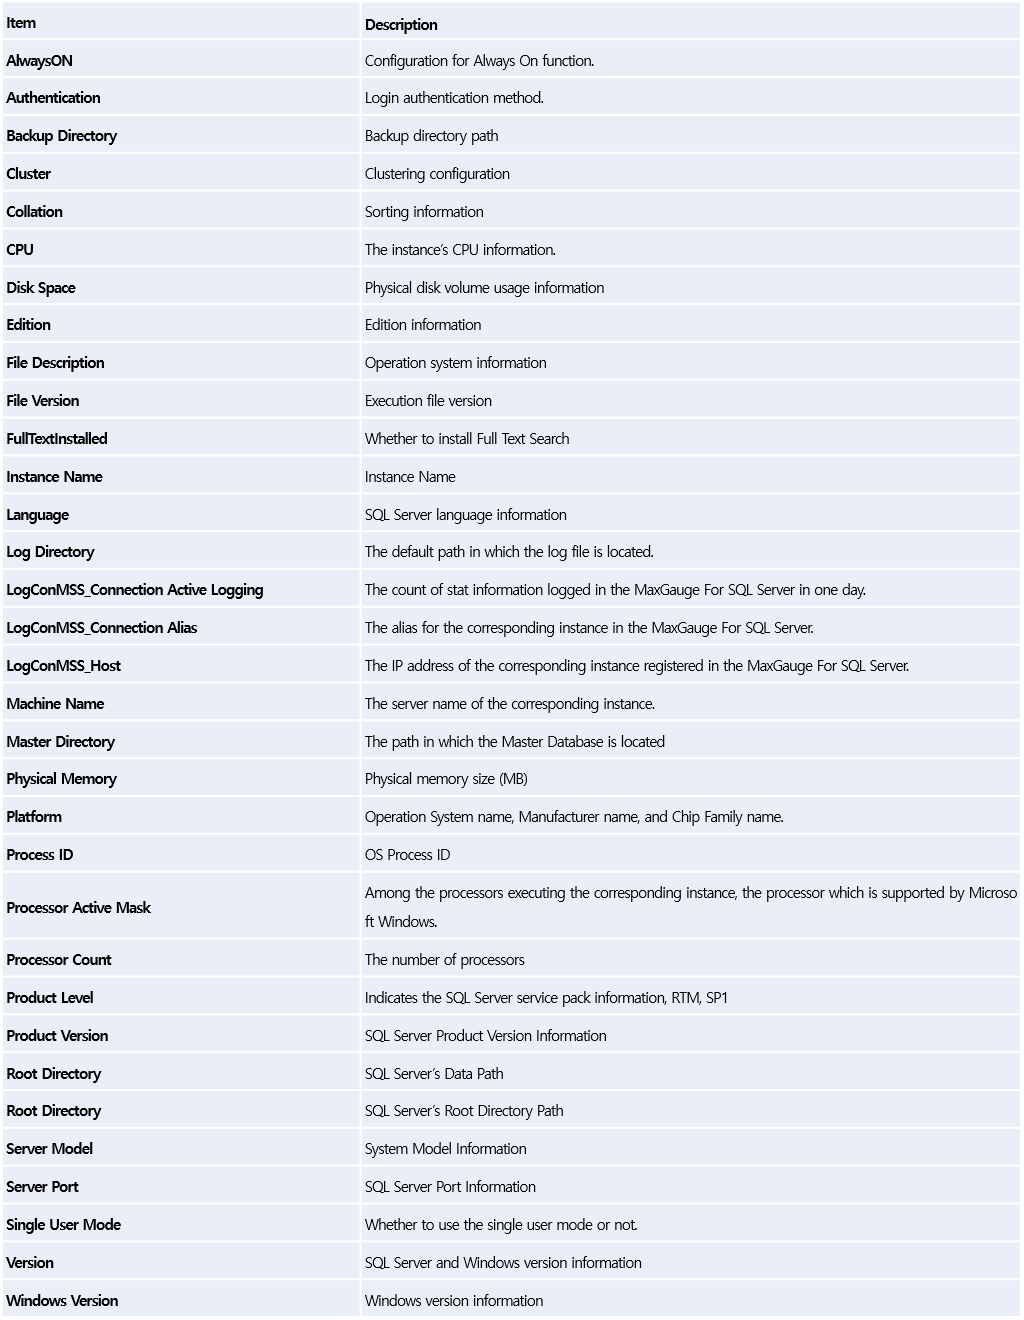
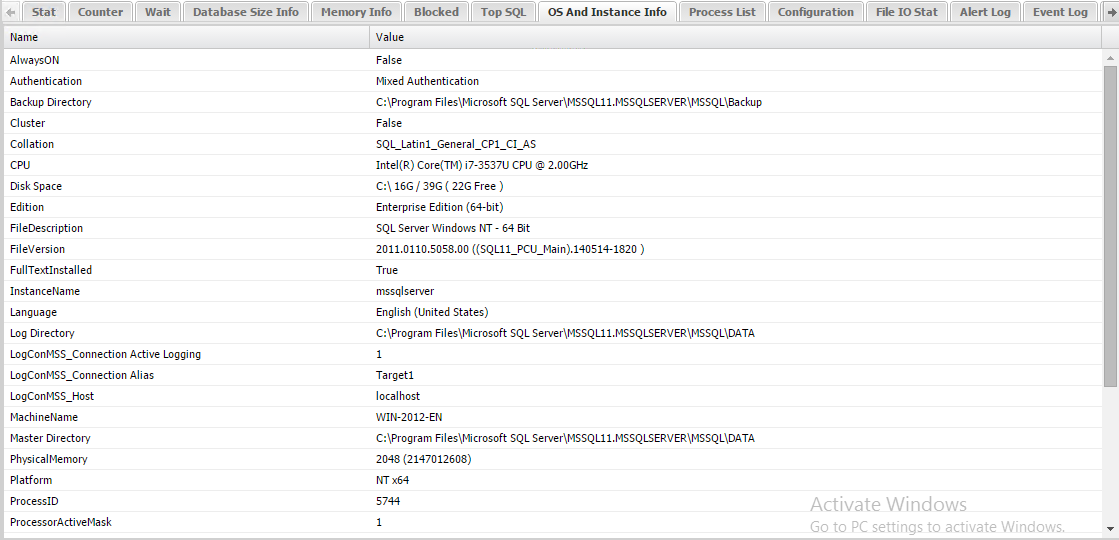
Image. OS And Instance Info Tab
Process List Tab
The Process List Tab provides information regarding the processes executed in the OS at the corresponding time. In the event the CPU usage is high, you can easily check which processes are using up the most CPU.
The following explalins the items in the Process List screen.
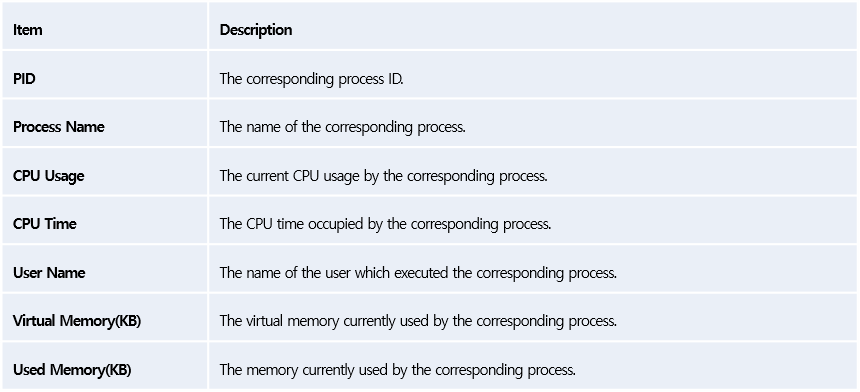
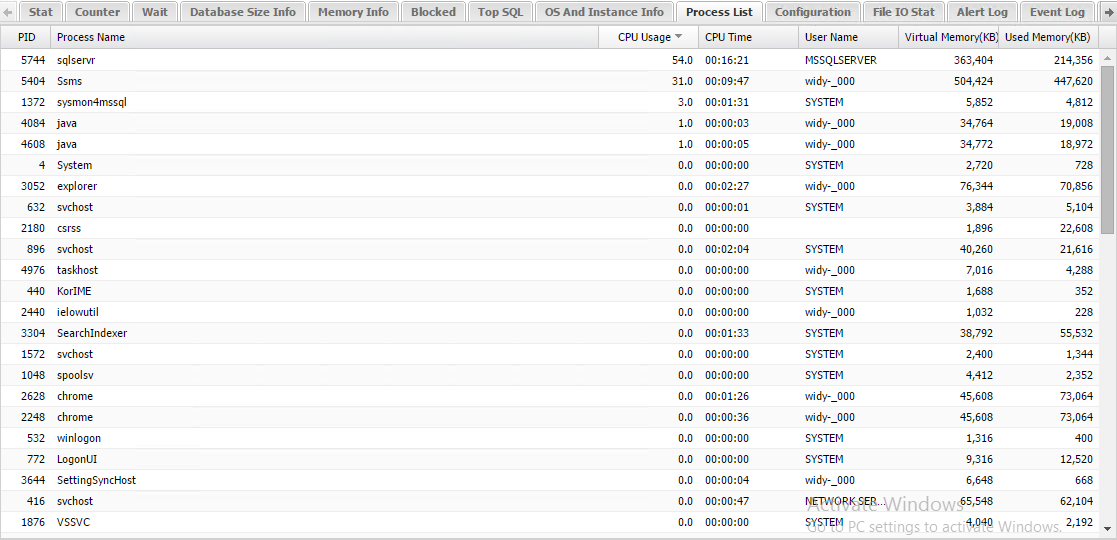
Image. Process List Tab
Configuration Tab
The Configuration information is logged according to the set logging cycle. Therefore, if the configuration has changed, then you can identify which details have been changed by comparing the before and after.
The following explains the items in the Configuration Tab screen.
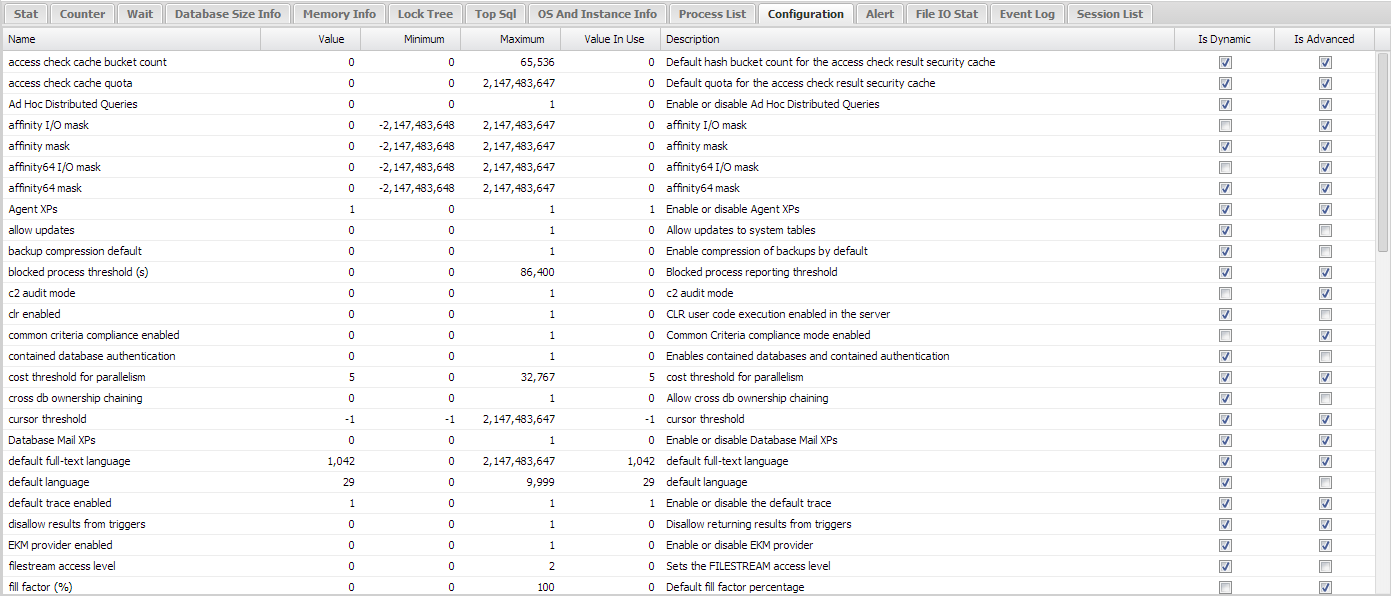
Image. Configuration Tab
File IO Stat Tab
On this tab, you can check the IO status of the data files and the log files used in the entire instance. You can check the current size of each file, the maximum file size, the automatic growth settings and even the the number of reads and writes generated in each file, the bytes used for reads and writes, and the wait information. Through such information, you may consider relocation of the data files and the log files.
The following explains the items in the File IO Stat screen.
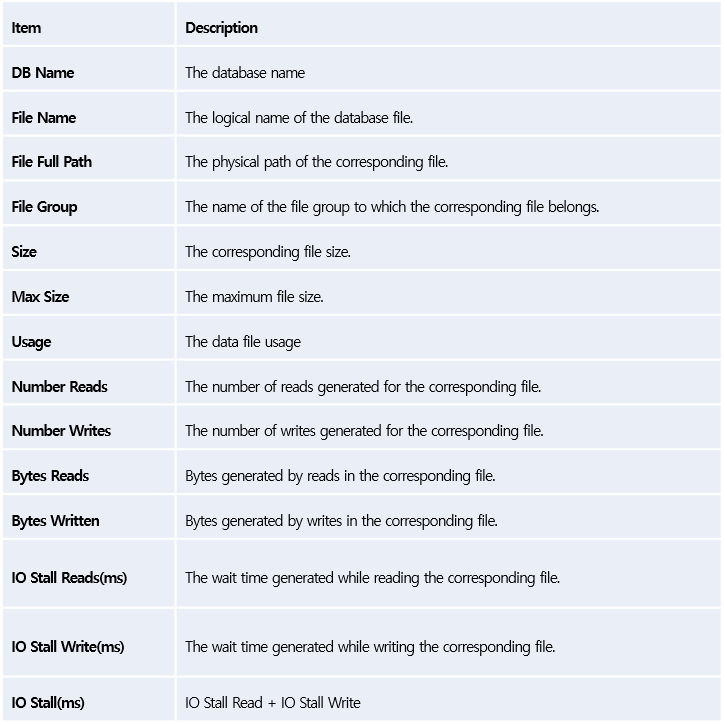
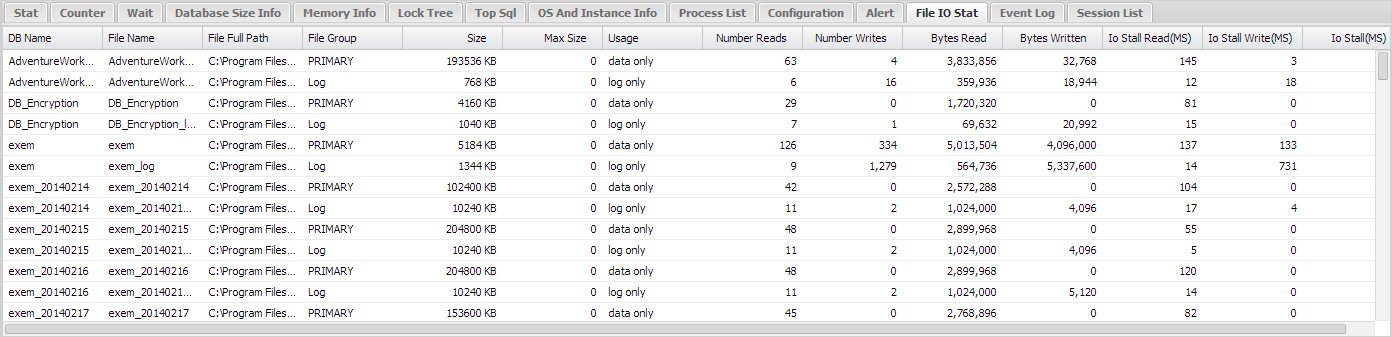
Image. File IO Stat Tab
Alarm Log Tab
On this tab, you can check the results of alarms set in the Admin’s Event Management. For each time at which the corresponding alarm was generated, you can check the stat name and alarm level and the generated value as well. With such information, you may be able to consider as to how to improve the stats in which the alarm events have been high.
The following explains the items in the Alarm Log Tab screen.
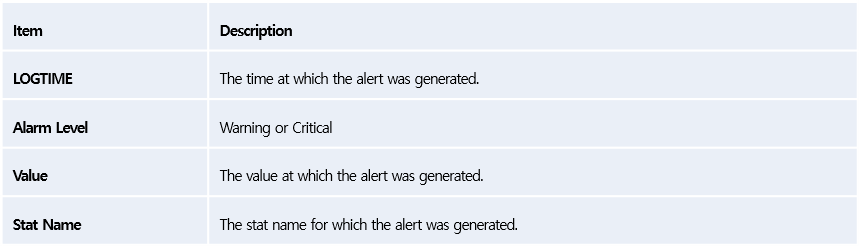
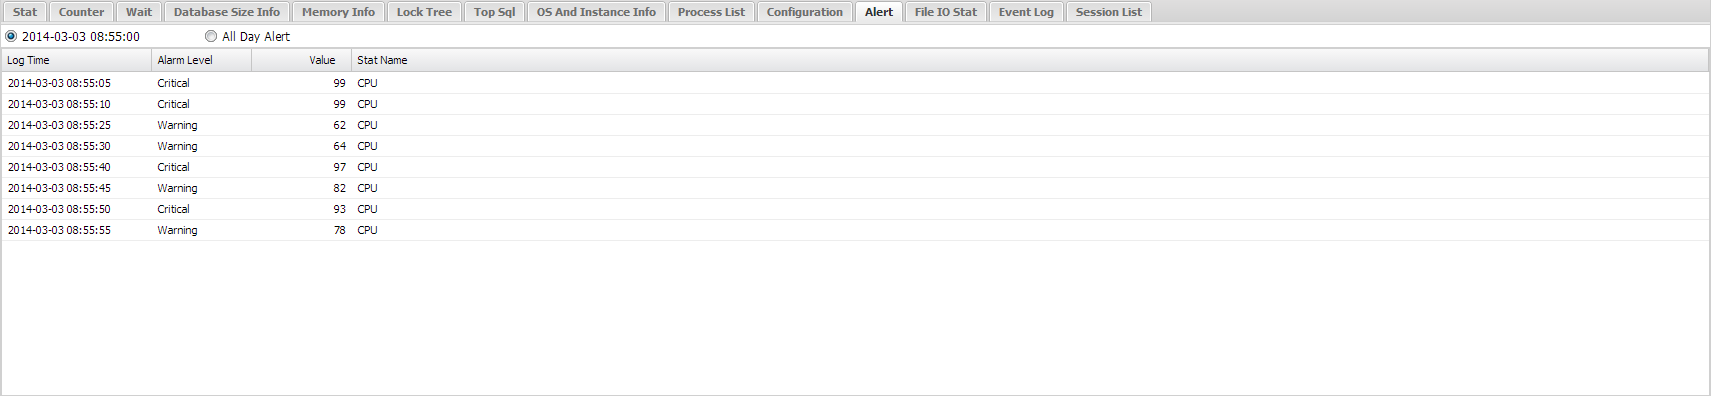
Image. Alarm Tab
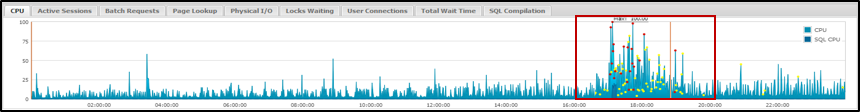
Image. Graph Screen in the Event of an Alarm
Event Log Tab
In the event an alert is generated among the logs generated in the Windows Event Log, the generated time and alert message is recorded for review. You can review all event logs generated during the day. Among the Windows Application logs, the alerts which are referred to as errors can be also reviewed as well.
The following explains the items in the Event Log screen.
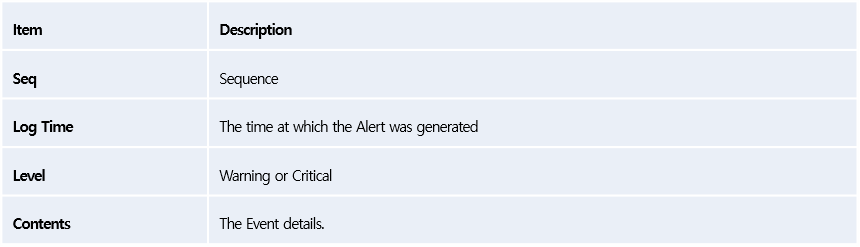
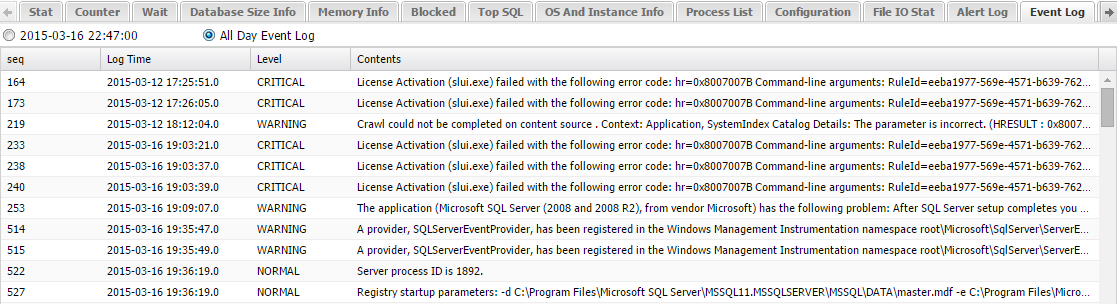
Image. Event Log Tab
Session List Tab
This is a function through which you can search and look up the session logs. You can search for the desired content by filtering out the sessions by logging time, elapsed time, host name, DB name, program name, and SQL text. This function becomes useful when you want to check which active session was running in a specific program at the target time, and which active sessions are exceeding how many seconds in elapsed time. You can do a search by using a wild card text ‘%’.
The following explains the search functions in the Session List.

Image. Session List Search Screen
The following explains the Session List search results.
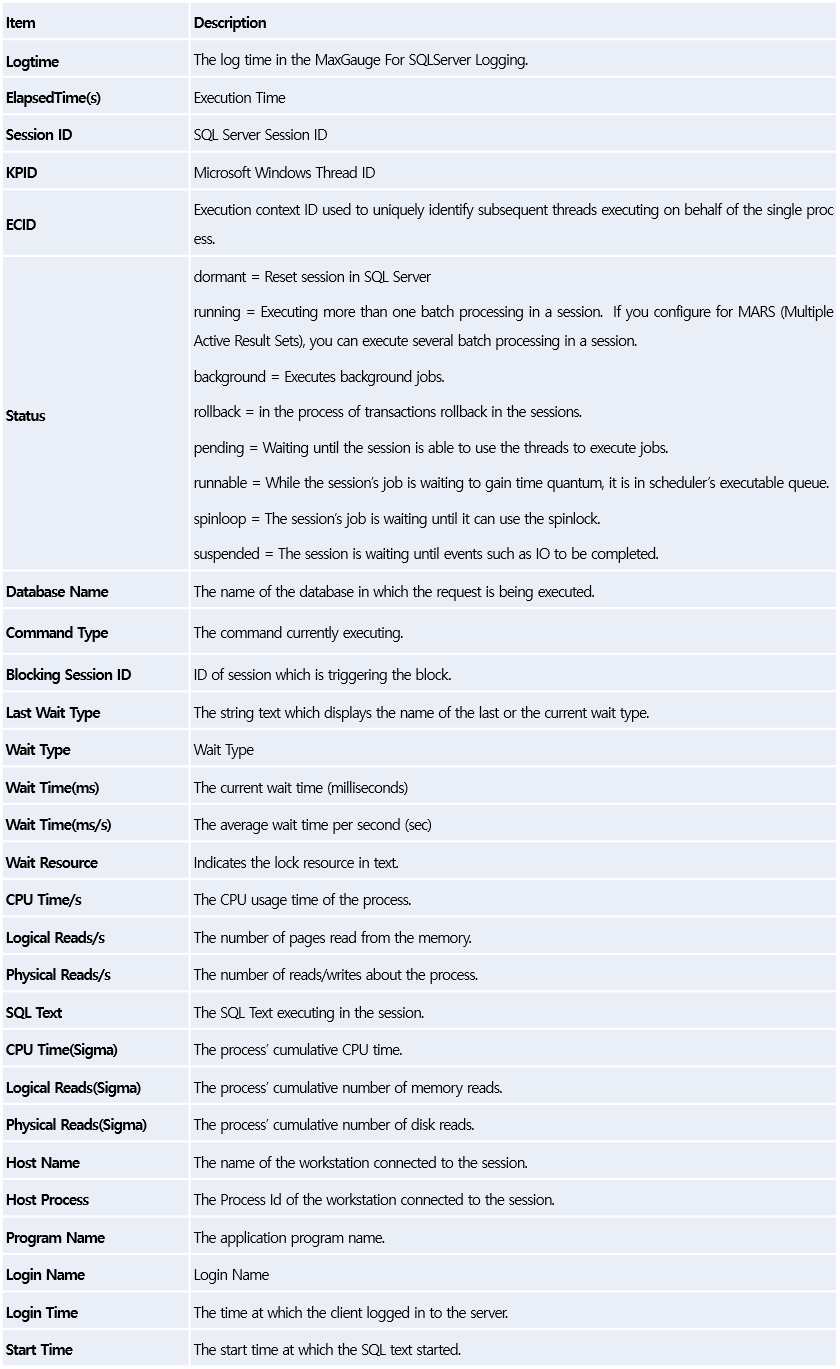
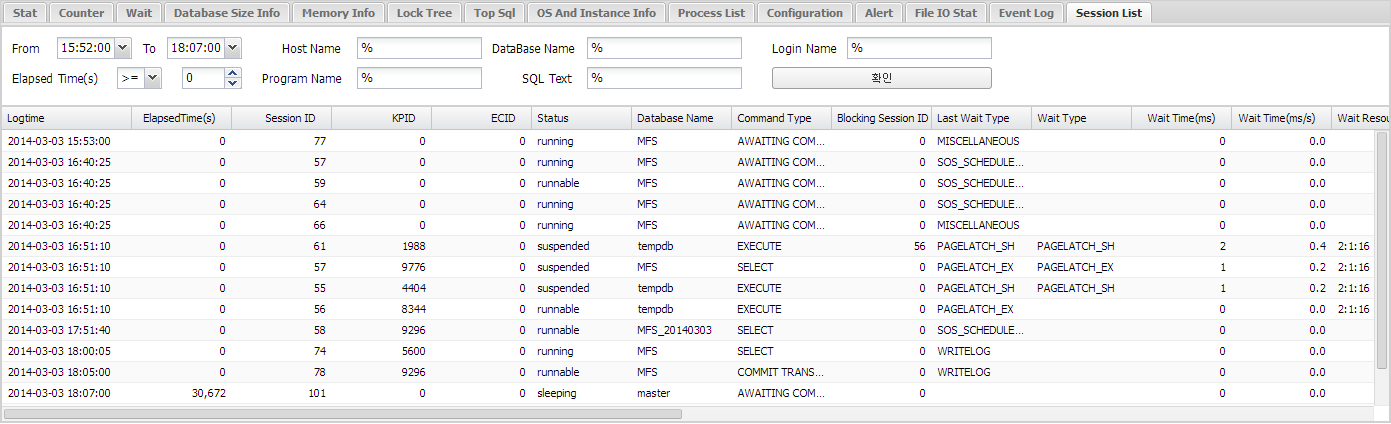
Image. Session List Results Screen
Back To Top
Active Session Area
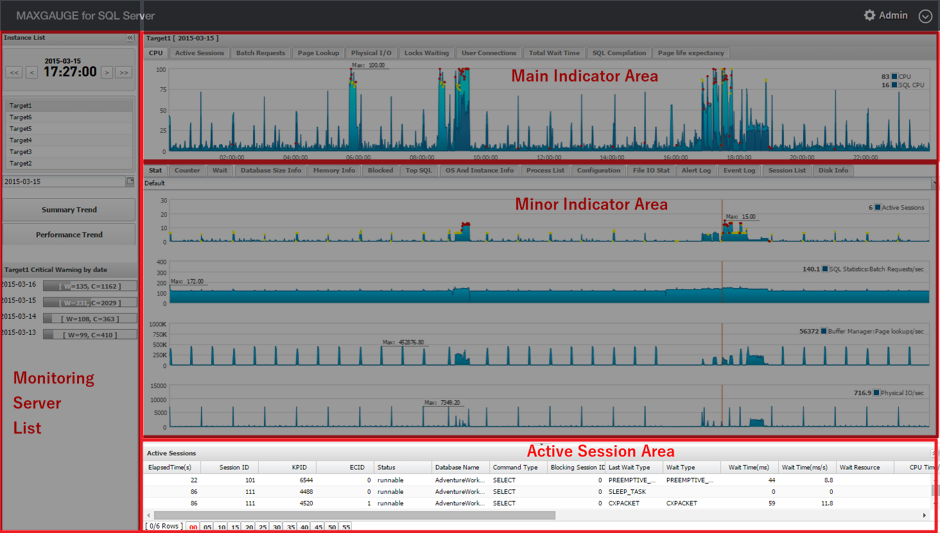
Image. Active Session Area
By looking at the performance trends on the screen, you can identify the type of resource usage in the collection periods and the peak time of instance usage. You can also sort the values by clicking on the column header of each indicator in the session and process window, which helps to easily identify which session has used up the most resource. In general, high resource usage is associated with potential problems, therefore, you can further investigate the execution plan of the SQL statement to take necessary actions. In the event of a lock waiting event, the lock’s holder session will appear in the session list even if it’s in inactive status.
When you double-click on a session in the Session List, you can check the SQL text and the execution plan.
The following explains the Active Sessions.
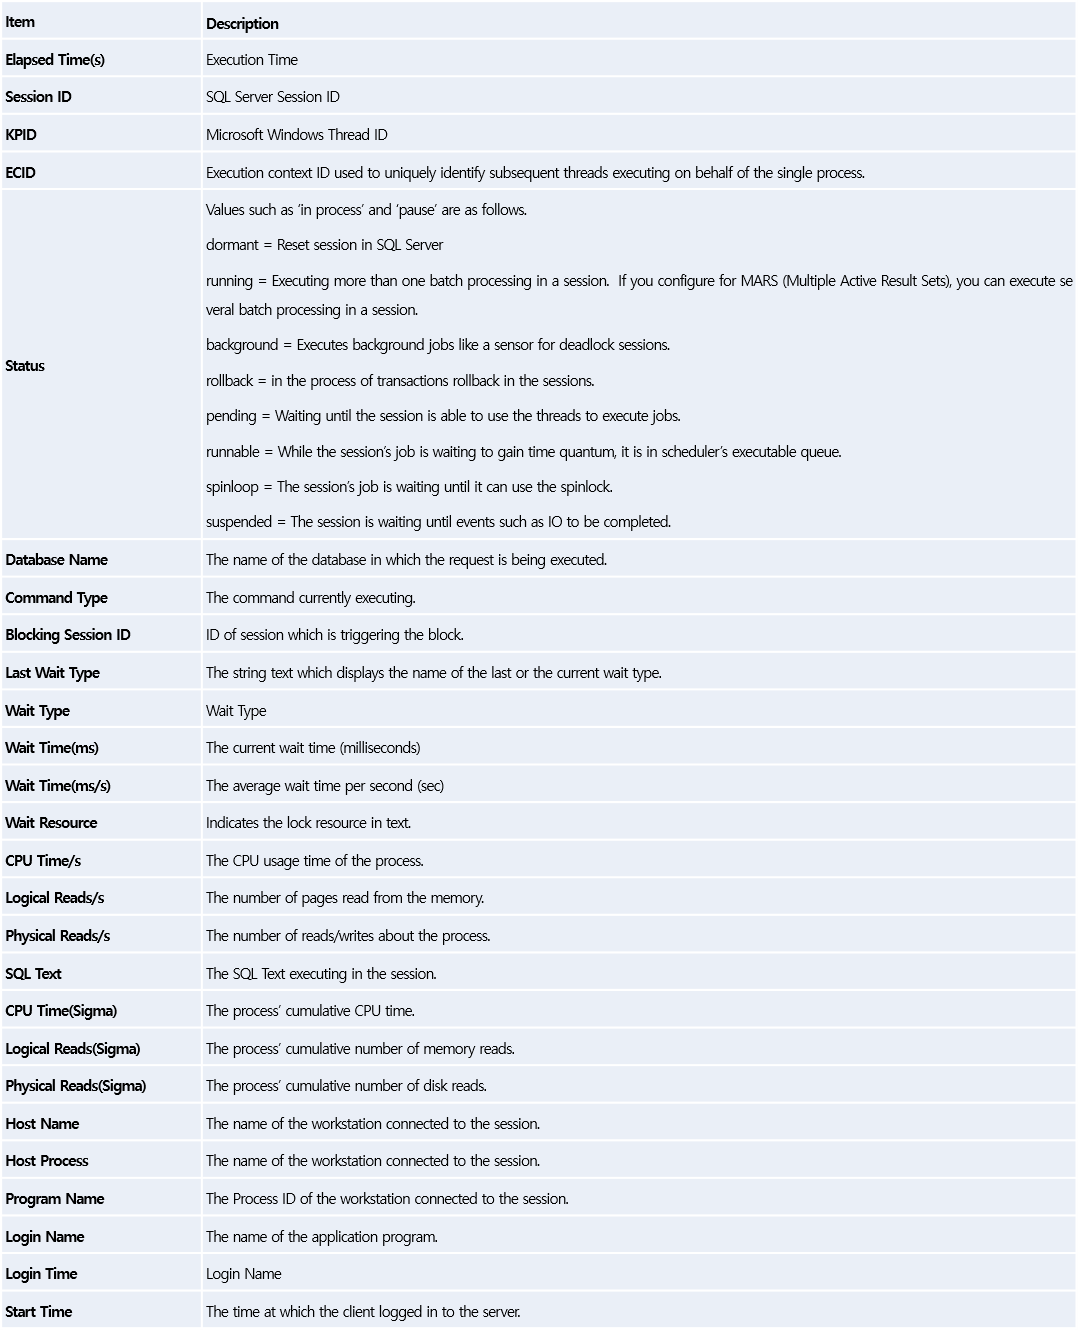
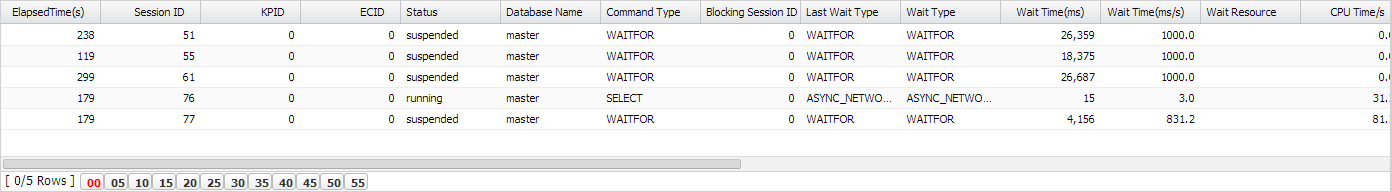
Image. Active Session Area
Back To Top
MAIN) APPENDIX
Back To Top
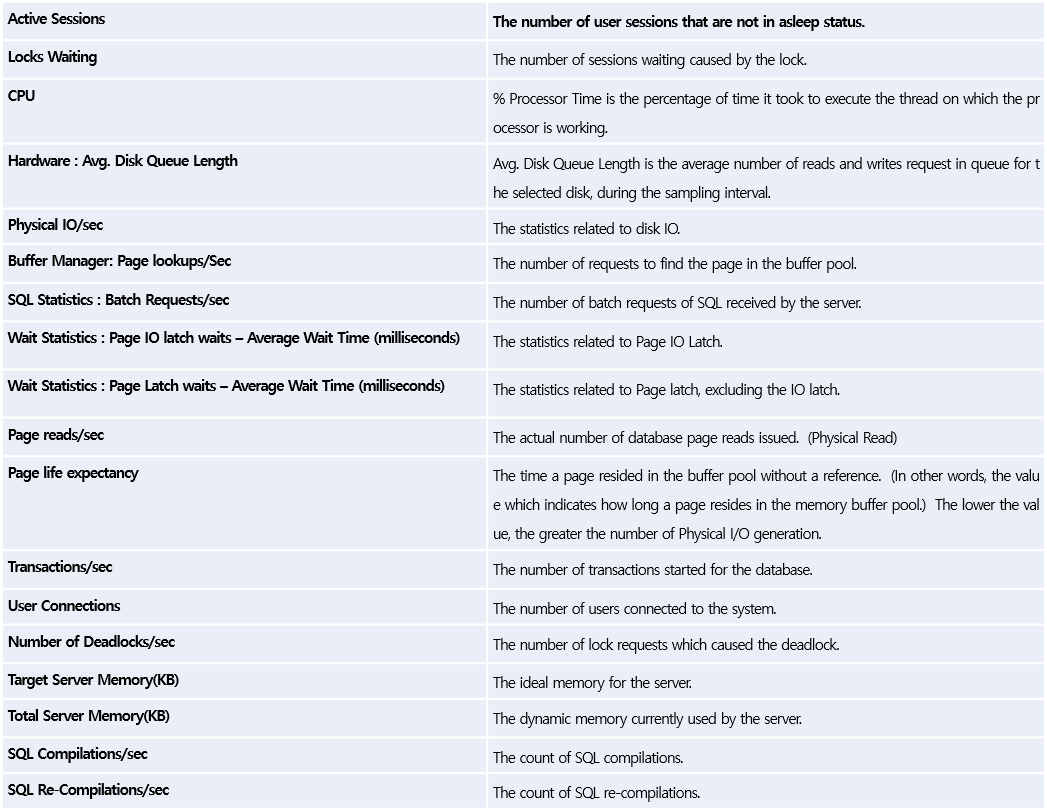
Definition of MaxGauge For SQL Server Main Indicators
Back To Top
|