Group OS Frame
The Group OS Frame provides the function for simultaneous monitoring the main OS resource usage rate of multiple database equipments. As explained earlier in “Frame Toggle Button” section, the Group OS provides the Group OS and Multi Monitor screens by using the Frame Toggle Button. From the Group OS screen, OS CPU and memory usage rate per database is provided.

(Sys, User, IO Wait, Idle) & Memory usage rate is provided.

Total Wait Frame
Total Wait Frame provides the wait time trends of multiple databases simultaneously, and moreover, it also provides the wait events list and the wait time for each database as well.

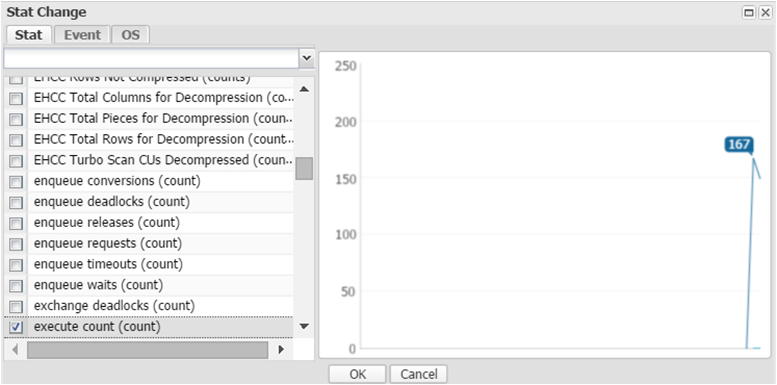
Trend Chart Frame
Trend Chart Frame provides the screen in which you can simultaneously monitor the activities of multiple databases. With the Trend Chart Frame, you can monitor 6 main performance indicators, and you can even change to other performance indicators as desired according to system and task characteristics for monitoring.

To change the performance indicator from the Trend Chart Frame, click on the performance indicator and then use the Stat Change screen which appears next.
Alert Log History Frame
The Alert Log History Frame provides the status of alarm generation during the last ten minutes for multiple databases simultaneously. It also provides the UI in graph or grid format by using the Toggle Button.

On the Graph screen, the size of the circle gradually increases with the number of alarm generation, and hence, you can intuitively monitor the alarm generation count per each minute during the last 10 minutes. When you put your mouse over the circle, you can review the details of alarms that were generated by the particular database at a particular time (minute).

The GRID screen provides information such as the database name, occurrence time, performance indicator, value, alarm level and etc. in a grid format.

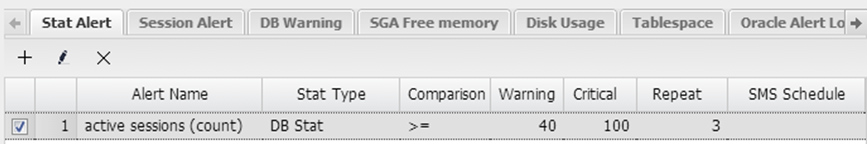
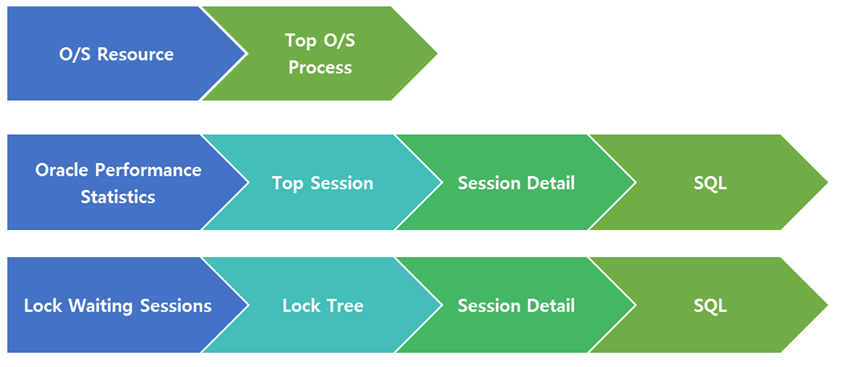
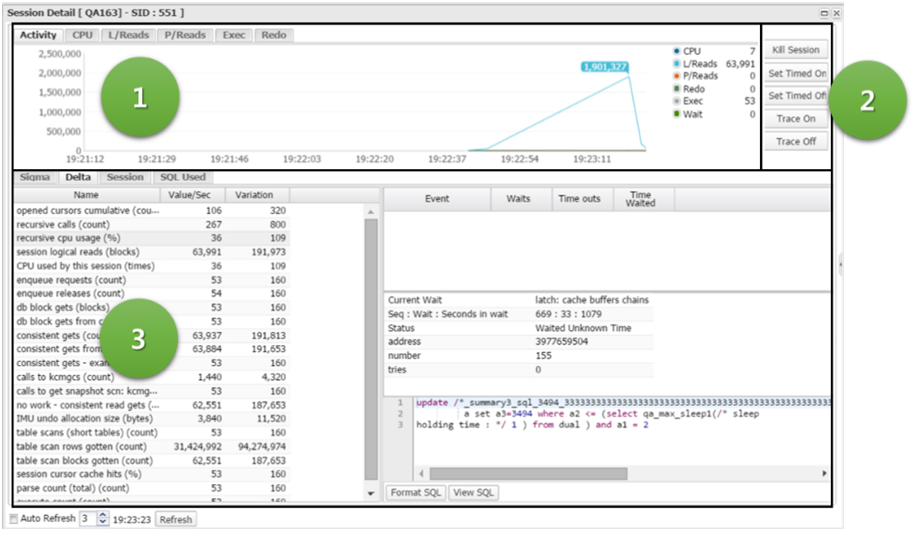
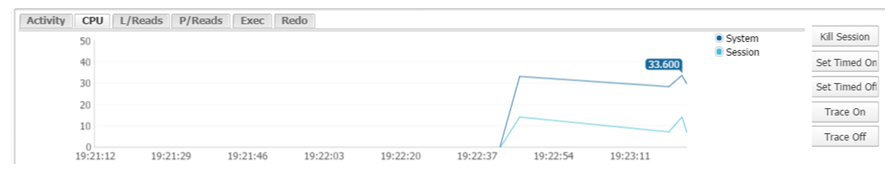
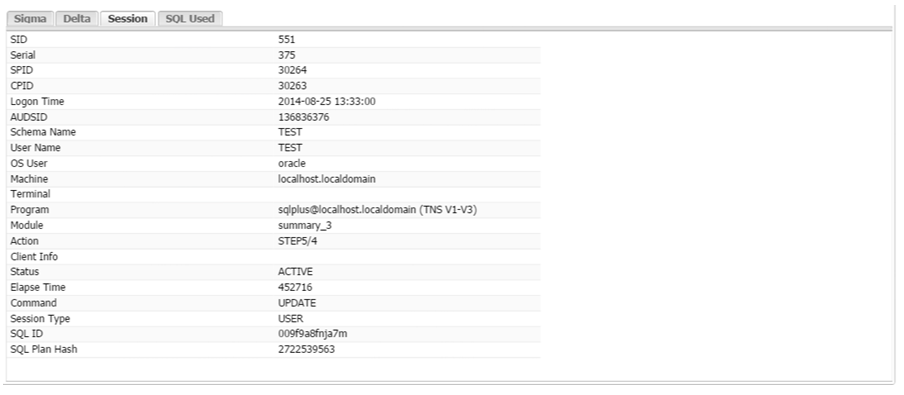
Active Session Frame
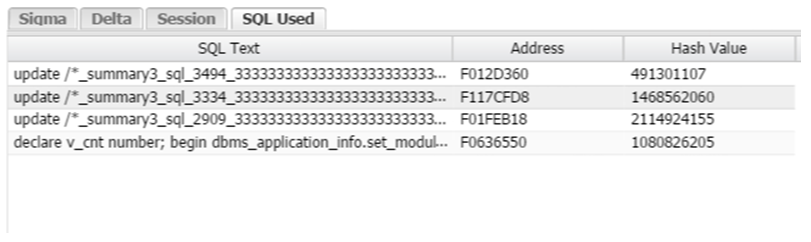
The Active Session Frame provides a list of sessions that are currently active in the database. The Active Session Frame provides the basic session information for each session, main performance indicator workload, wait events, OS CPU usage rate, SQL information and etc.
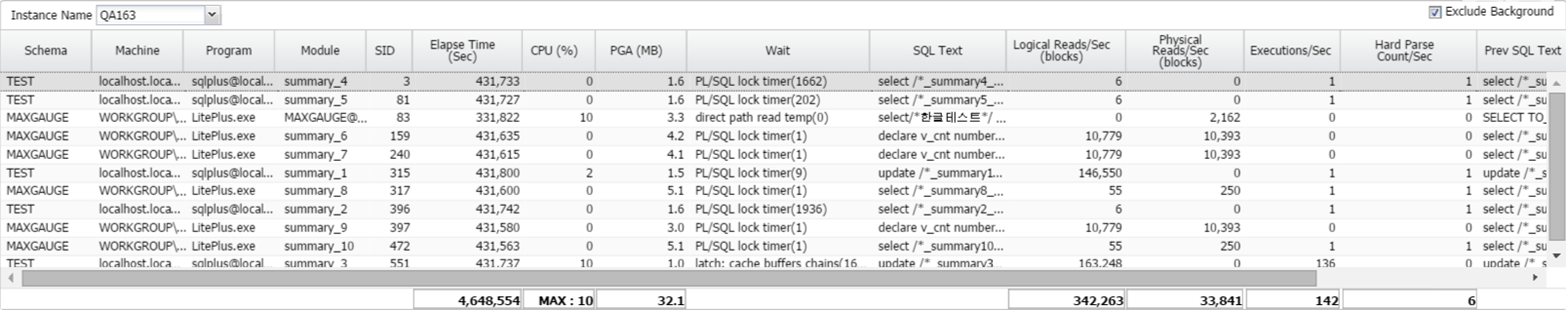
If you wish to change the target monitoring database, then you need to use the Instance Name combo box located at the top. And basically, the background process is not provided in the Active session list. In order to monitor the background processes, you must remove the check mark on “Exclude Background”.
The items basically provided in the Active Session Frame are as follows.
Table 1-7. Items basically presented in the Active Session Frame
| Items |
Explanation |
| Schema |
Schema Name |
| Machine |
Machine Name |
| Program |
Program Name |
| Module |
Module Name |
| SID |
Session ID |
| Elapsed Time (Sec) |
SQL Execution Time |
| CPU (%) |
Session’s OS CPU Usage Rate (%) |
| PGA (MB) |
PGA Usage Size |
| Wait |
Wait Event Name |
| SQL Text |
SQL Statement |
| Logical Reads/Sec (blocks) |
Session logical reads performance indicator generation rate per second |
| Physical Reads/Sec (blocks) |
Physical reads performance indicator generation rate per second |
| Executions / Sec |
Executions performance indicator generation rate per second |
| Hard Parsing Count / Sec |
Parse count (hard) performance indicator generation rate per second |
| Prev SQL Text |
Previously executed SQL statement |
| SQL ID |
Oracle SQL ID |
| SQL Plan Hash |
SQL Plan Hash Value |
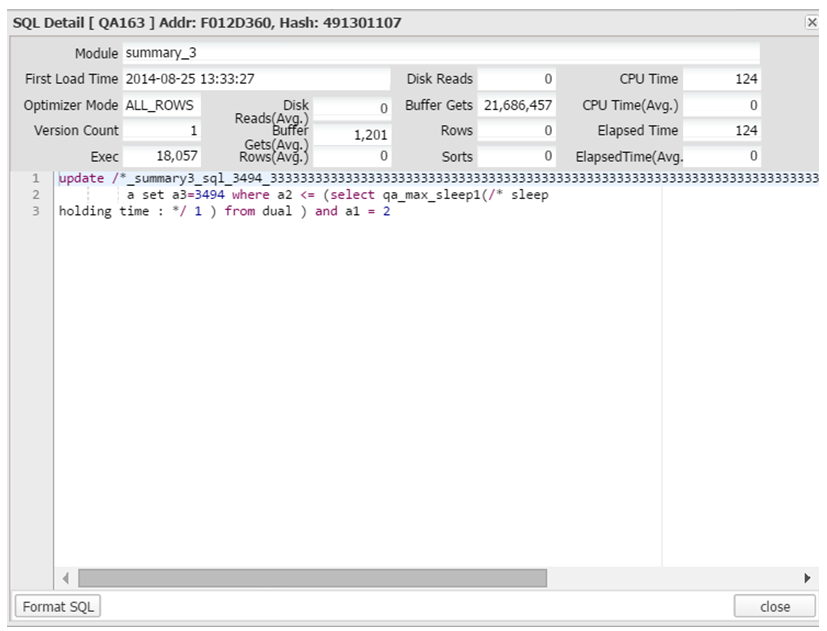
SQL Elapsed Time Frame
SQL Elapsed Time Frame provides the UI through which you can check the execution time for all SQLs. Each SQL represented by a dot, the distribution of all completed SQLs from all the databases currently being monitored can be easily confirmed. And by dragging the target area for analysis, you can review the full execution details.


The full details of SQL history can be seen as follows.