4. Resource Monitoring
Note. The difference between Frame and Tool is in whether or not it can be docked or not. Only Frame items can be docked.

Note. The difference between Frame and Tool is in whether or not it can be docked or not. Only Frame items can be docked.
The Common UI’s provided in Tool or Frame are as follows.
| Item | Description |
| |
Maximizes the Frame or Tool |
| |
Closes the Frame or Tool |
| Instance List | This area displays a list of all the instances currently being monitored. When you click on the instance name, it provides information regarding the corresponding instance. |
| |
Creates an identical window. |
| |
Provides the Auto refresh enable/disable function.
|
| |
In Auto Refresh Enable state, you need to set the Refresh cycle. |
| |
Displays the Last Refresh time. |
| |
Provides the Manual Refresh function. Only operates in Auto Refresh Disable state. |
| |
Instance List navigation arrows |
| Item | Description |
| |
Maximizes the Frame or Tool |
| |
Closes the Frame or Tool |
The All Statistics Tool provides the average value (per second) of all the performance indicators and wait events’ workload.
The window configuration is as follows.
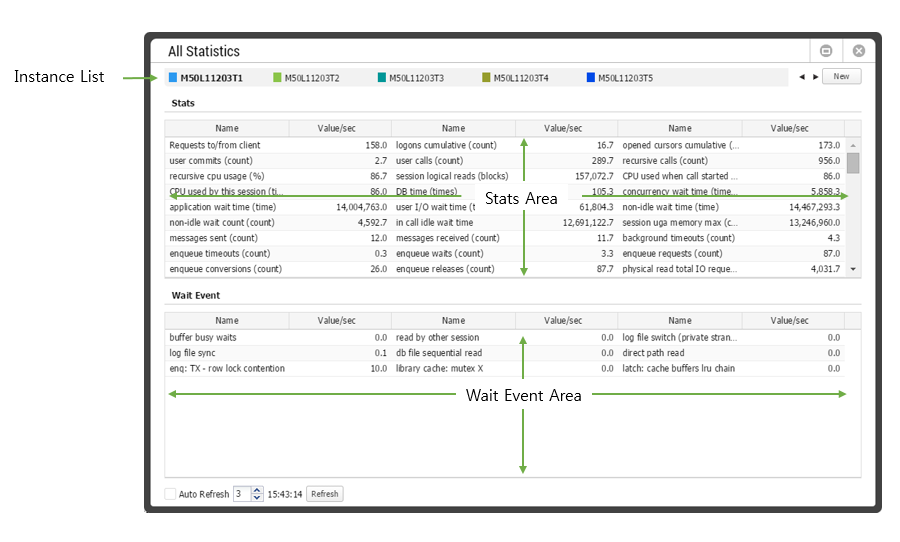
The Instance List provides a list of all the instances currently being monitored.
The Stats Area provides the current value or the generated value per second of all the performance indicators.
Note. In general, for performance indicators whose names contain the word “current” such as logons current and opened cursors current, and others such as pga memory and pga memory max, the current value is given.
The Wait Event Area provides the wait time per second of all the wait events currently being generated.
| Column Name | Description |
| Name |
|
| Value/sec |
|
When you double click the individual Name within the Stats Area, you will be connected to another window according to the performance indicator as shown below.
| Performance Indicator | Connection Window | Content Provided |
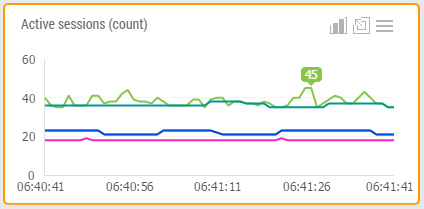
| Active sessions | Session Manager Tool | A list of Active sessions (background session included) |
| Active user session | Session Manager Tool | A list of Active sessions
(background not included) |
| Total sessions | Session Manager Tool | A list of all the sessions currently connected to |
| Long idle sessions | Session Manager Tool | A list of sessions whose inactive state has exceeded 3,600 seconds |
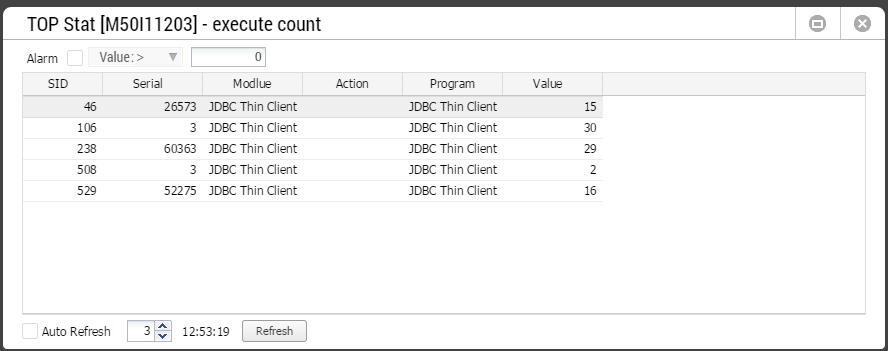
| Oracle Statistics | Top Session (Stat) Window | Top 20 sessions of the corresponding performance indicator |
Note. The Oracle Statistics refers to the performance indicators that relate to V$STATNAME. For more information regarding the Session Manager Tool, please reference the “Chapter 5 Session Manager Tool” section. For more information regarding Top Session (Stat) Window, please reference the “Chapter 5 Top Session (Stat) Window” section.
When you double click the individual Name within the Wait Event Area, you will be connected to another window according to the wait events as shown below.
| Wait Event | Description | Connection Window |
| Lock waiting sessions & Enqueue related Wait Events | Provides the relationship between Holder and Waiter in a lock tree. | Lock Tree Frame |
| All Wait Events excluding Enqueue | Provides the top 20 sessions of the corresponding wait event. | Top Session (Event) Window |
Note. For more information regarding the Lock Tree Frame, please reference “Chapter 5 Lock Tree Frame” section. For more information regarding the Top Session (Event) Window, please reference “Chapter 5 Top Session (Event) Window” section.
The mouse right-click menu is as follows. For more information, please reference “Appendix. Grid Mouse Right-Click Menu UI”.
| Item | Description |
| Export Excel | Downloads the grid content on an excel file. |
| Copy(To Clipboard) | Makes a copy of the grid content. |
| Show/ Hide Columns | Selects the columns to be displayed on the grid. |
| Filter On | Enables the Filtering function. |
| Multiple Sort On | Sorts based on 2 or more column values. |
| Save Image | Saves the grid content as an image. |
The CPU, Memory (Multi) Frame provides the CPU and memory related information of all the database servers currently being monitored.
The window configuration is as follows.
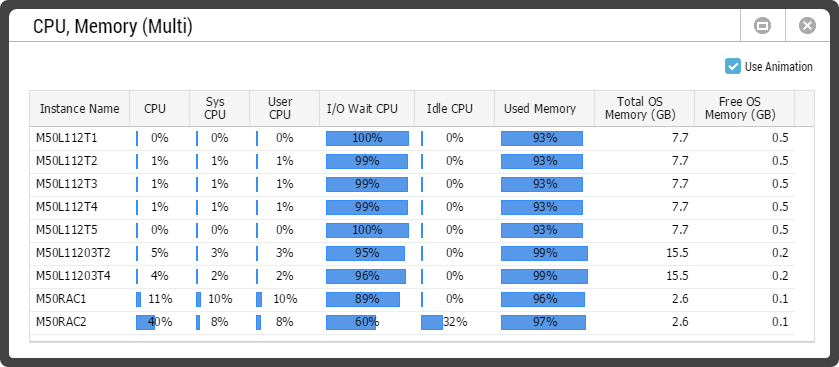
The Use Animation selects the bar chart expression method.
| Item | Description |
| |
Draws again from 0 |
| |
Draws only the changes |
| Column Name | Description |
| Instance Name | Instance name |
| CPU | CPU usage (%) |
| Sys CPU | Kernel mode CPU usage (%) |
| User CPU | User mode CPU usage (%) |
| I/O Wait CPU | I/O wait CPU usage(%) |
| Idle CPU | Idle CPU (%) |
| Used Memory | Memory usage(%) |
| Total OS Memory (GB) | Total memory Size |
| Free OS Memory (GB) | Free memory Size |
When you click the instance name or the CPU related values, you will be connected to the corresponding instance’s Top Process (CPU) Window; and when you click the memory related values, you will be connected to the Top-Process (Memory) Window. For more information, please reference “Chapter 5 Top-Process Window” section.
The mouse right-click menu is as follows. For more information, please reference “Appendix. Grid Mouse Right-Click Menu UI”.
| Item | Description |
| Export Excel | Downloads the grid content on an excel file. |
| Copy(To Clipboard) | Makes a copy of the grid content. |
| Show/ Hide Columns | Selects the columns to be displayed on the grid. |
| Filter On | Enables the Filtering function. |
| Multiple Sort On | Sorts based on 2 or more column values. |
| Save Image | Saves the grid content as an image. |
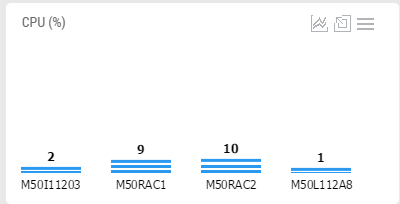
The CPU, Memory (Group) Frame provides the CPU and memory usage of all the database servers currently being monitored.
The window configuration is as follows.
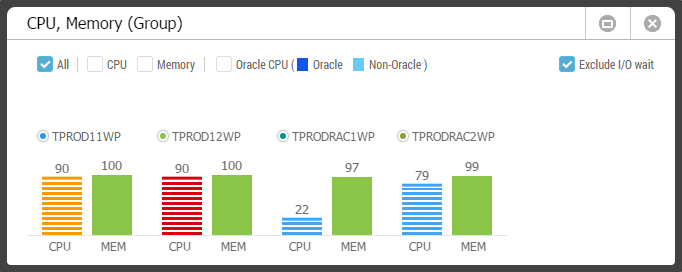
There are 3 types of display methods.
| Item | Description |
| |
Displays the CPU and memory usage sequentially by each database server. (Default Setting Value) |
| |
Displays only the CPU usage of the database servers. |
| |
Displays only the memory usage of the database servers. |
| |
Displays a separate CPU usage rate of the Oracle Sessions and the Non-Oracle sessions.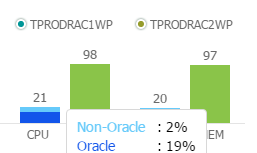
|
The Exclude I/O wait determines whether I/O wait usage should be included in the CPU usage or not.
| Item | Description |
| |
I/O wait usage is not included in the CPU usage. |
| |
I/O wait usage is included in the CPU usage. |
When you click on the CPU usage bar chart, you will be connected to the corresponding instance’s Top Process (CPU) Window, and when you click the memory related values, you will be connected to the Top-Process (Memory) Window. For more information, please reference “Chapter 5 Top-Process Window” section.
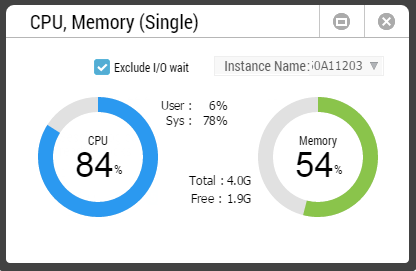
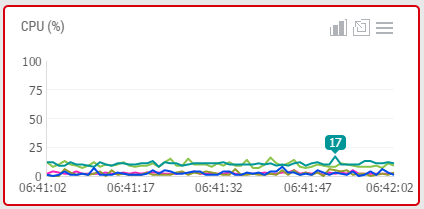
The CPU, Memory (Single) Frame provides the CPU and memory information regarding a single database server.
The window configuration is as follows.
| Item | Description |
 |
Displays the CPU usage. Click, and you will be connected to Top Process(CPU) Window. For more information, please reference “Chapter 5 Top-Process Window” section. |
 |
Displays the memory usage. Click, and you will be connected to Top Process(Memory) Window. For more information, please reference “Chapter 5 Top-Process Window” section. |
| |
I/O wait usage is not included in the CPU usage. |
| |
I/O wait usage is included in the CPU usage. |
 |
Displays the User, Sys and I/O wait CPU usage. The I/O wait usage will be displayed only when the Exclude I/O wait is unchecked. |
| |
Provides the Total memory size and the free memory size. |
| |
Provides a list of instances.
|
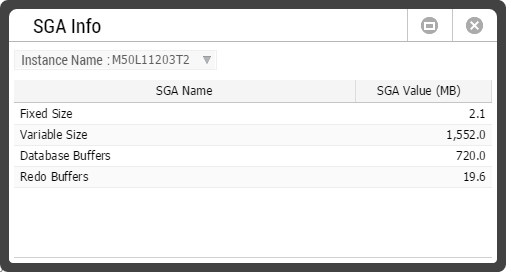
The SGA Info Frame provides the size of the main components within the SGA.
Note. Provides the same content as the SQL> show sga execution result.
The window configuration is as follows.
| Item | Description |
| Instance Name | Provides a list of instances.
|
| Column Name | Description |
| SGA Name | SGA component name |
| Value (MB) | SGA component size |
The mouse right-click menu is as follows. For more information, please reference “Appendix. Grid Mouse Right-Click Menu UI” section.
| Item | Name |
| Export Excel | Downloads the grid content on an excel file. |
| Copy(To Clipboard) | Makes a copy of the grid content. |
| Show/ Hide Columns | Selects the columns to be displayed on the grid. |
| Filter On | Enables the Filtering function. |
| Multiple Sort On | Sorts based on 2 or more column values. |
| Save Image | Saves the grid content as an image. |
The Trend Chart Frame provides the trends on the workload and wait time of performance indicators.
The window configuration is as follows.
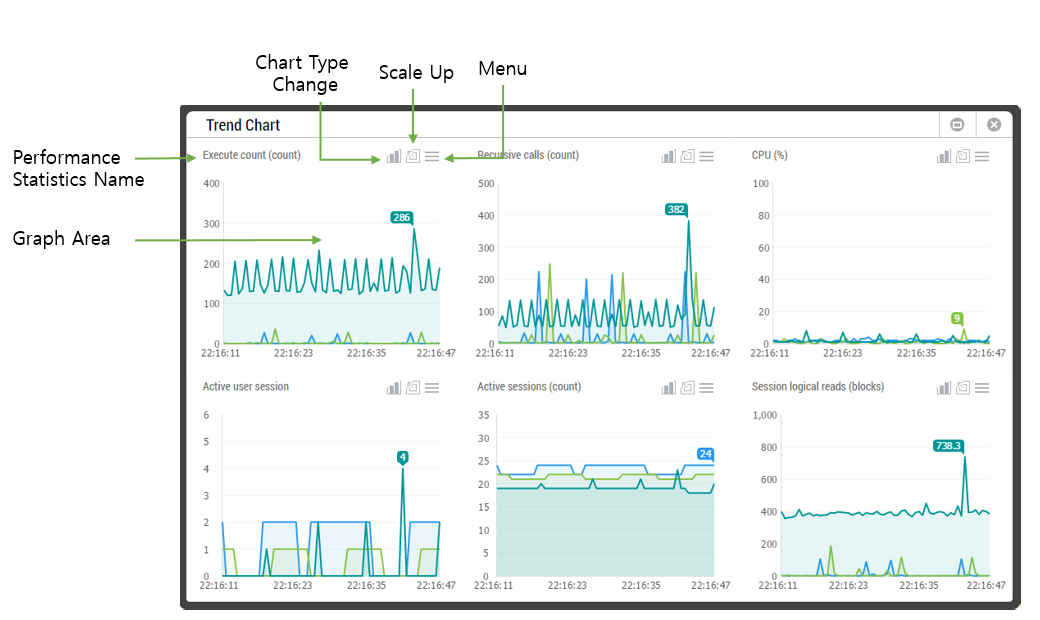
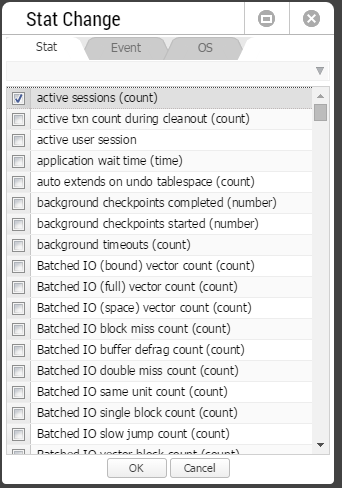
The Performance Statistics Name displays the names of all the performance indicators currently being monitored. When you click the corresponding area, the Stat Change Window will pop up. The Stat Change Window is used to change the performance indicator and the window configuration is as follows.
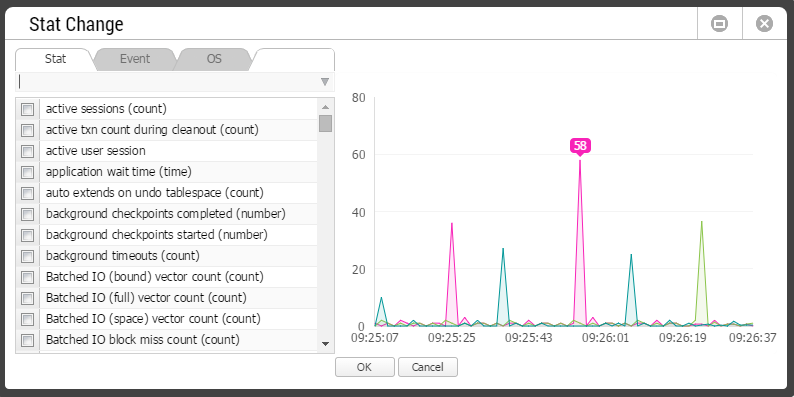
Stat Change Window Tab Configuration
| Item | Description |
| Stat | Provides a list of performance indicators.
|
| Event | Provides a list of wait events.
|
| OS | Provides a list of OS main performance indicators. |
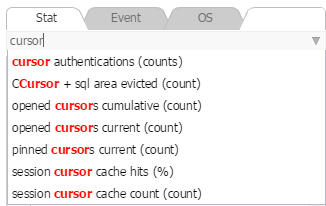
Auto-complete Function
The Auto-complete function is available for your convenience in the indicator name search. When you start typing into the Stat Change Window’s input box, a list of indicators containing the word you typed in will appear. The following is an example of a “cursor” related performance indicator name search.
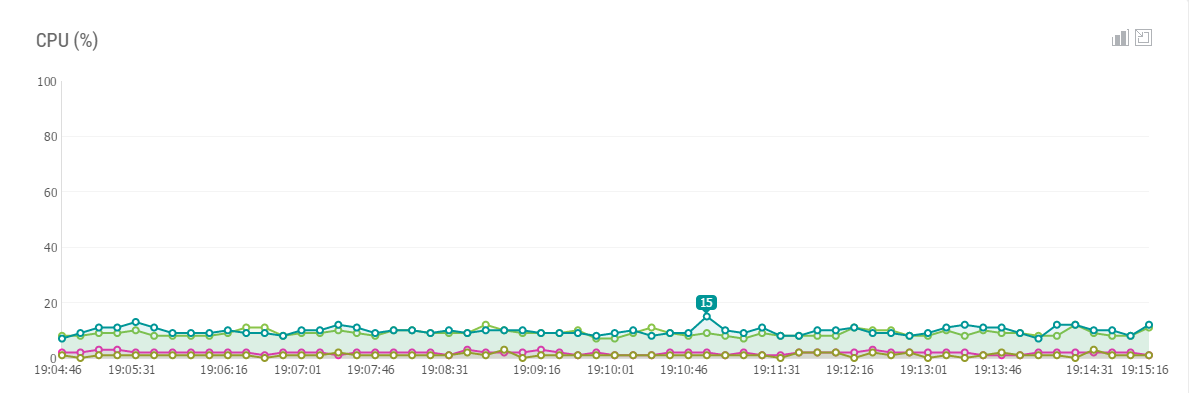
The Graph Area provides the trends on workload and wait time of performance indicators. You can simultaneously monitor multiple instances.
Display Method
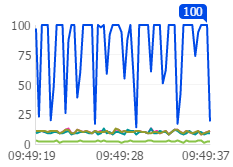
(Stacked) Line Chart UI
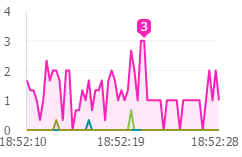
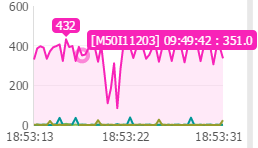
When you put the mouse over the graph line, the value of the corresponding point will be displayed.
Alarm Generation
When it meets the alarm conditions set for the performance indicator, the window color will change. If it meets the warning condition, it becomes yellow, and if it meets the Critical condition, it becomes red.
Note. For more information regarding performance indicators and various types of alarm settings, please reference “MaxGauge Configuration Manual”.
The Chart Type Change allows you to change the chart type of the corresponding chart. The default value is the line chart. When you click ![]() icon, it changes into a bar chart, and when you click
icon, it changes into a bar chart, and when you click ![]() icon, it changes back to a line chart.
icon, it changes back to a line chart.
The next icon is used when you want to expand the view of a particular indicator for a close-up monitoring. When you click ![]() icon, it will only display an expanded view of the corresponding indicator on the Trend Chart.
icon, it will only display an expanded view of the corresponding indicator on the Trend Chart.
When you click the ![]() icon, it returns to its previous state.
icon, it returns to its previous state.
The following menu options are provided.
Change Visible Instance List
Select a list of instances to be displayed on the Graph Area.
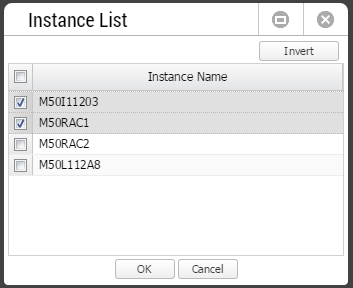
Note. If there are more items to uncheck, then use the Invert button. When you click the Invert button, it will uncheck the items that were checked, and check the unchecked items.
To use the option function, first put your mouse over the Trend Chart Frame and click the option button ![]() on the top right corner. The Trend Chart Frame provides the following options.
on the top right corner. The Trend Chart Frame provides the following options.
Change Visible Instance List
This function is similar to the Menu->Change Visible Instance List in the Graph Area except that this targets all the indicators on the Trend Chart.
Change Chart(Bar <-> Line)
This function is similar to the bar chart icon and the line chart icon in the Graph Area except that this targets all the indicators on the Trend Chart.
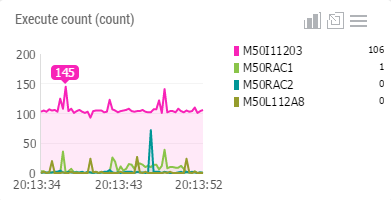
Legend On
The Legend On will display the instance names and values within the Graph Area , even on a line chart format.
Legend Potison
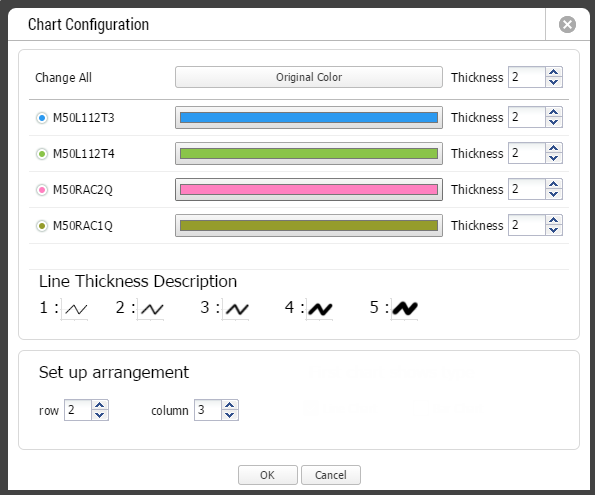
If the Legend is turned on, then designate a place in which the legend is to be displayed. There are 3 positions to choose from – Top, Right, or Bottom – and the default value is the right position. Display Option
The Display Option window configuration is as follows.
The Top-Down Real Time Diagnostics provides the function of tracing the top sessions or processes.
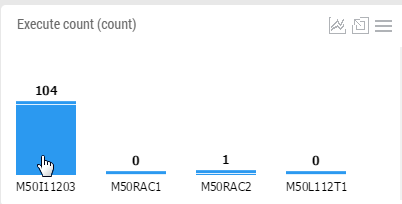
Line Chart & Legend Off
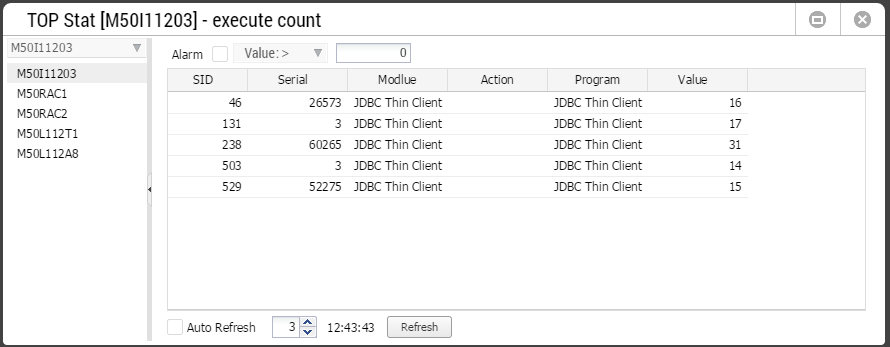
Note. The content presented on the window is information on the first instance’s top sessions or processes.
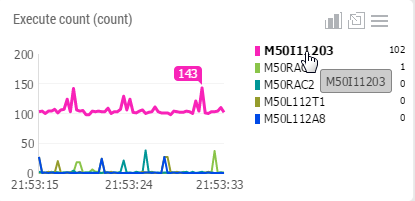
Bar Chart & Legend On (Line Chart)
Statistics
The connection window by performance indicator are as follows.
| Performance Indicator | Connection Window | Content Provided |
| Active sessions | Session Manager Tool | A list of Active sessions (background session included) |
| Active user session | Session Manager Tool | A list of Active sessions
(background not included) |
| Total sessions | Session Manager Tool | A list of all the sessions currently connected to |
| Long idle sessions | Session Manager Tool | A list of sessions whose inactive state has exceeded 3,600 seconds |
| Oracle Statistics | Top Sessoin (Stat) Window | Top 20 sessions of the corresponding performance indicator |
Note. The Oracle Statistics refers to the performance indicators that relate to V$STATNAME. For more information regarding the Session Manager Tool, please reference the “Chapter 5 Session Manager Tool” section. For more information regarding Top Session (Stat) Window, please reference “Chapter 5 Top Session (Stat) Window” section.
Wait Event
The connection windows by Wait events are as follows.
| Wait Event | Description | Connection Window |
| Lock waiting sessions & Enqueue related Wait Events | Provides the relationship between Holder and Waiter in a lock tree. | Lock Tree Frame |
| All Wait Events excluding Enqueue | Provides the top 20 sessions of the corresponding wait event. | Top Session (Event) Window |
| Fixed-up type of wait events among the gc related wait events | Provides sessions which are waiting on the placeholder wait events of the fixed-up wait events. For example, if you select the ”gc cr grant 2-way” fixed-up wait event, it provides a list of all the sessions waiting on the ”gc cr request” and ”gc cr multi block request”. |
Top Session (Event) Window |
Note. For more information regarding the Lock Tree Frame, please reference “Chapter 5 Lock Tree Frame” section. For more information regarding the Top Session (Event) Window, please reference “Chapter 5 Top Session (Event) Window” section.
The Total Wait Frame provides the trends on the total wait time by instance and the wait time by wait event.
The window configuration is as follows.
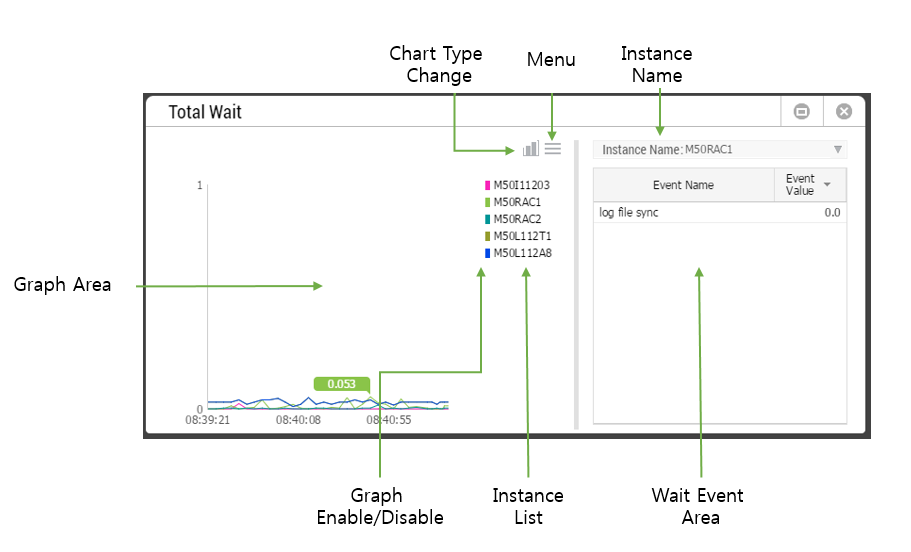
The Graph Area provides the wait time information by instance in two types of charts.
Note. The default value is the line chart.
This provides the graph display On/Off function by the use of a check box located in front of the Instance List.
Note. The default value is On mode. If you click again, it becomes Off mode.
The Instance List provides a list of all the instances currently being monitored. When you click on an instance, it displays the wait events information of the corresponding instance in the Wait Event Area.
This function allows you to change the graph display method. When you click the ![]() icon, it will change to a stacked bar chart format.
icon, it will change to a stacked bar chart format.
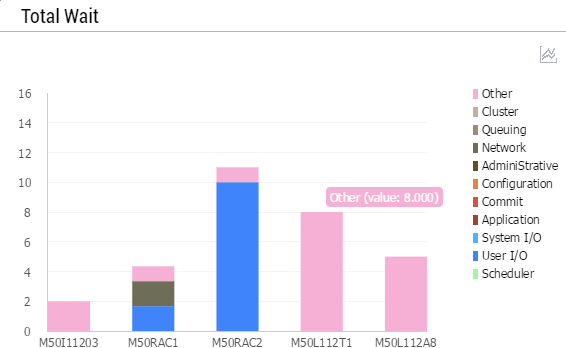
The individual series on the stacked bar chart refers to the wait class, by using the check box in front of each wait class name, it provides the On/Off function in regards to the corresponding series. When you click the ![]() icon, it will change to line chart format.
icon, it will change to line chart format.
The following function is provided in the Menu.
Legend Off
For a line chart, it hides the legend. This function is only available only when it is in a line chart format.
The Instance Name provides a list of instances currently being monitored.
| Column Name | Description |
| Trend View | Provides a list of all the instances currently being monitored |
| RAC View | Provides a list of instances within the corresponding RAC Group. |
| Single View | Does not provide the Instance Name combo box. |
| Column Name | Description |
| Event Name | Wait Event name |
| Wait Time/Sec | Wait time per second (value/sec) |
The connection window will be determined according to the types of wait events.
| Wait Event | Connection Window |
| Enqueue related Wait Events | Lock Tree Frame
|
| Wait Time/Sec | Top Event Window
|
The mouse right-click menu is as follows. For more information, please reference “Appendix. Grid Mouse Right-Click Menu UI”.
| Item | Description |
| Export Excel | Downloads the grid content on an excel file. |
| Copy(To Clipboard) | Makes a copy of the grid content. |
| Show/ Hide Columns | Selects the columns to be displayed on the grid. |
| Filter On | Enables the Filtering function. |
| Multiple Sort On | Sorts based on 2 or more column values. |
| Save Image | Saves the grid content as an image. |
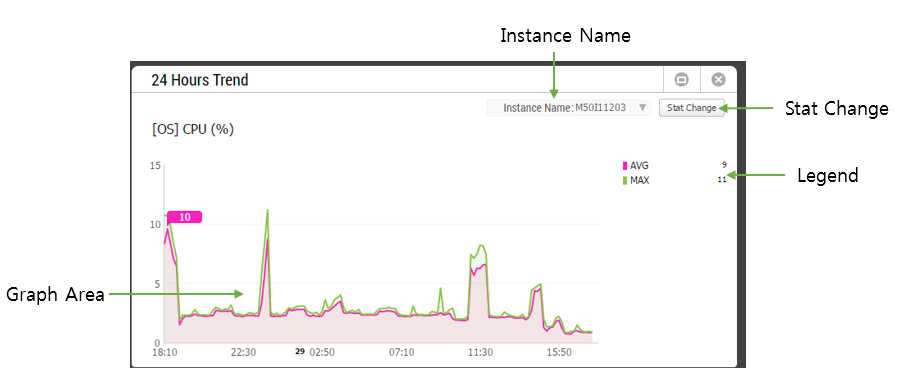
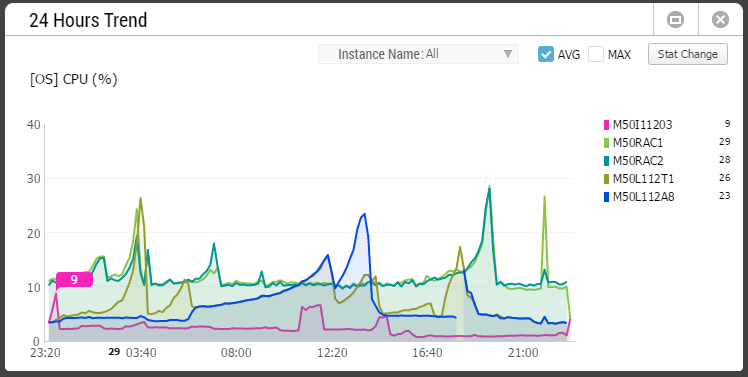
The 24 Hour Trend Frame provides the last 24 hour performance trends.
The window configuration is as follows.
Note. The performance trends data utilizes the 10 minute summary table. Therefore, you cannot set the refresh cycle and instead, it automatically refreshes every 10 minutes.
The Graph Area provides the performance trends graph of the instance(s).
Note. When only 1 instance is selected, then the AVG/MAX trend of that one instance is provided. When “All” is selected, the AVG (or MAX) trends of all instances are provided.
The Instance Name provides a list of instances currently being monitored and the “All” items as well.
| Column Name | Description |
| Trend View | Provides a list of all the instances currently being monitored and the “All” items. |
| RAC View | Provides a list of instances within the corresponding RAC Group and the “All” items. |
| Single View | Does not provide the Instance Name combo box. |
When you select “All”, the last 24 hour trends of all the instances registered in the Instance Name combo box is provided and the window will change as shown below.
The difference between selecting an individual instance name or “All” in the Instance Name combo box is as follows.
| Category | When Individual Instance Name is Selected | When All is Selected |
| Graph Area | Provides AVG and MAX values in a stacked line chart format. | Provides AVG (or MAX) values of instances in a stacked line chart format. |
| Legend Area | Provides AVG and MAX values. | Provides AVG (or MAX) values of instances. |
| None | Provides:
|
You can change the performance indicator either by clicking the performance indicator name or the ![]() button. The changeable performance indicators are as follows.
button. The changeable performance indicators are as follows.
| Item | Description |
| Stat
|
Provides a list of performance indicators.
|
| Event | Provides a list of wait events.
|
| OS | Provides a list of OS main performance indicators. |
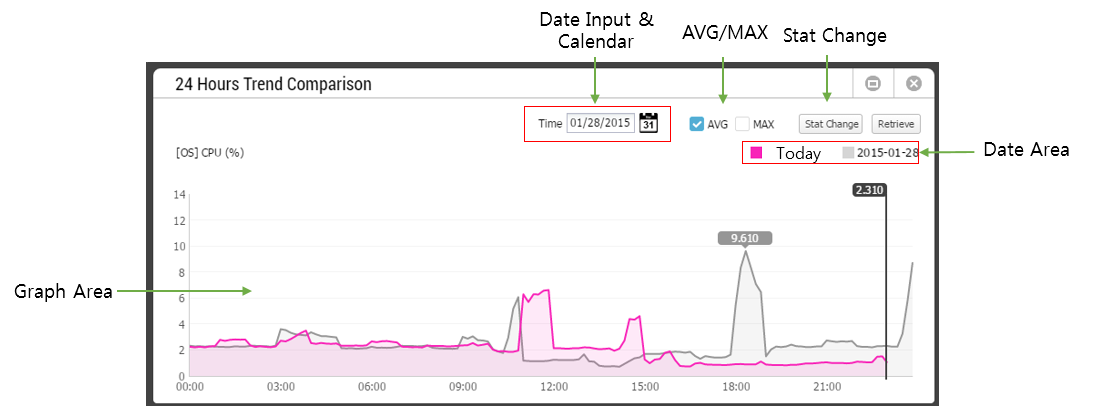
The 24 Hour Trend Comparison Frame allows you to compare today’s performance trends against another date.
The window configuration is as follows.
Note. The performance trends data utilizes the 10 minute summary table. Therefore, you cannot set the refresh cycle and instead, it automatically refreshes every 10 minutes.
The Graph Area provides the performance trends graphs of today and of the comparison date.
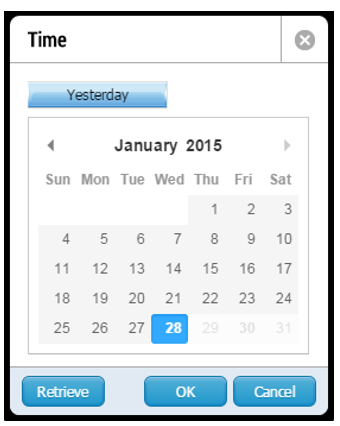
You can select the comparison date by either entering the date or using the calendar.
| Item | Description |
| |
Sets the comparison date as “Yesterday”. |
| |
After selecting the comparison date, it begins the search process. |
| |
Confirms the selected comparison date. |
| |
Cancels the selected comparison date. |
AVG/MAX
| Item | Description |
| |
Provides 10 minute AVG Value. |
| |
Provides MAX value during the last 10 minutes. |
This function is the same as the Stat Change button on the 24 Hours Trend Frame.
Once you have entered the comparison date or selected it on the Calendar UI and clicked the “OK” button, you can begin the search process by clicking the “Retrieve” button. If you have already clicked the “Retrieve” button from the Calendar UI, you do not need to click this button again.
The Date Area displays the comparison date.