
SQL Elapsed Time Frame
SUB) Overview
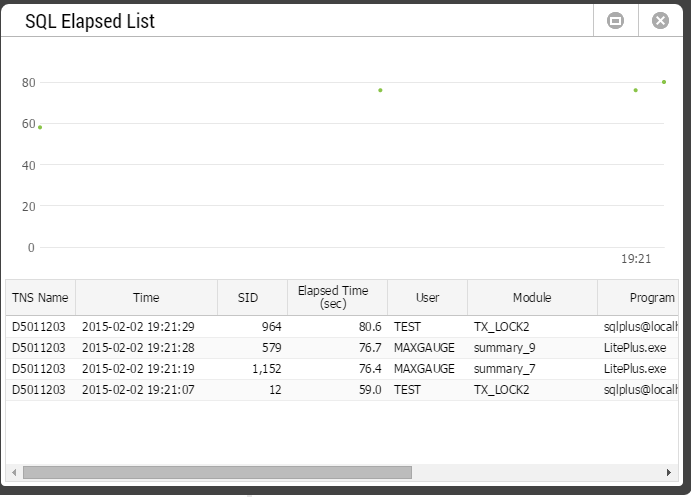
The SQL Elapsed Time Frame provides a scattered chart of Elapsed Time by SQL.
- Work Path: Select Menu -> Docking Frame -> SQL Elapsed Time
The window configuration is as follows.
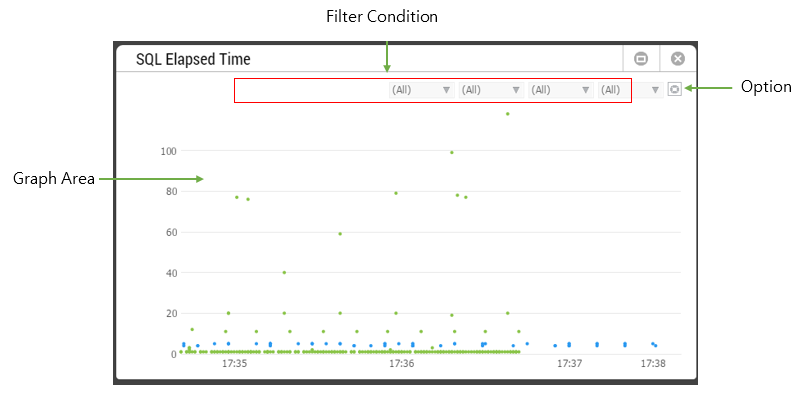
SUB) Graph Area
The elapsed time of each individual SQL whose process is complete will be displayed as a “dot” on the graph.
Note1. Each instance is differentiated by different “dot” color.
Note2. It Provides an animation effect for the new SQL in Graph Area.
SUB) Filter Condition
There are 4 filter conditions.
| Column Name | Description |
| Instance Name | Select the target instance name for monitoring. |
| Schema | Select Schema as the monitoring target. |
| Program | Select Program as the monitoring target. |
| Module | Select Module as the monitoring target. |
SUB) Option
The Option settings window is as follows.
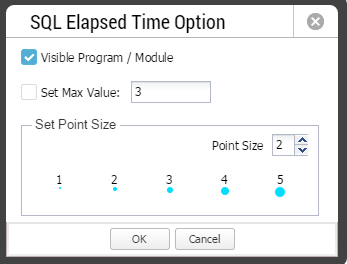
| Item | Description |
| Visible Program / Module | Determine whether to provide program and module in the Filter Condition or not.
By default, it will be “checked”. |
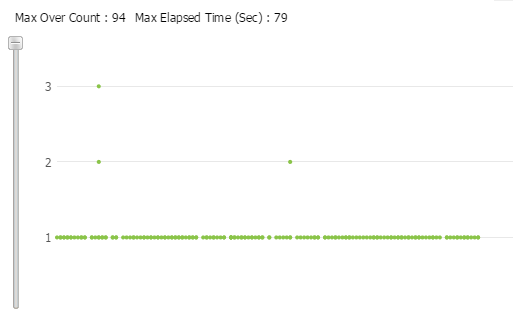
| Set Max Value | Set the maximum value for Y axis. By default, it is “disabled”.
When you enable this option, the screen will be changed as follows.
|
| Set Dot Size | Sets the “dot” size to be displayed on the Graph Area |
SUB) Top-Down Real Time Diagnostics
1. Use your mouse to click and drag over the desired area in the Graph Area for which you wish to check detailed information.
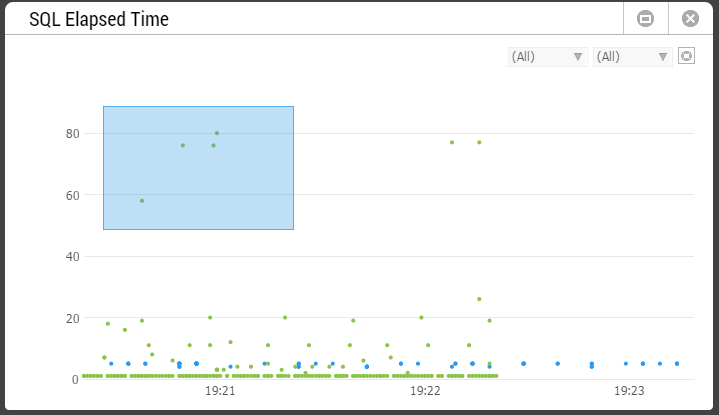
2. Once you have selected an area, the SQL Elapsed List Window will pop up. The SQL Elapsed List Window provides the work details of the selected “dots”.
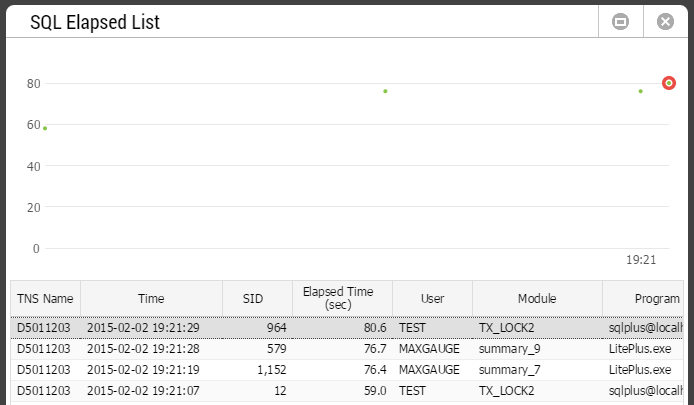
3. When you click on a grid item, the corresponding “dot” will become highlighted with a red circle.
4. When you double-click the grid item or select View SQL on the mouse right-click menu, then it connects to the SQL Detail Window. For more informaton regarding the SQL Details, please reference “Chapter 6 SQL Detail Window”
SUB) SQL Elapsed List Window Grid Column
| Column Name | Description |
| Instance Name | Instance Name |
| Time | SQL Execution Completed Time |
| SID | Session identifier |
| Elapsed Time (Sec) | SQL Response Time |
| User | Oracle User Name |
| Module | Module Name |
| Program | Program Name |
| SQL ID | Oracle SQLID |
| Address | SQL Text Address Value |
| Hash Value | SQL Text Hash Value |
| SQL Plan Hash | Plan hash Value |
SUB) SQL Elapsed List Window Grid Mouse Right-Click Menu
The mouse right-click menu is as follows. For all other items except the View SQL, please reference “Appendix. Grid Mouse Right-Click Menu UI”.
| Item | Description |
| View SQL | Connects to SQL Detail Window.
|
| Export Excel | Downloads the grid content on an excel file. |
| Copy(To Clipboard) | Makes a copy of the grid content. |
| Show/ Hide Columns | Selects the columns to be displayed on the grid. |
| Filer On | Enables the Filtering function. |
| Multi Sort On | Sorts based on 2 or more column values. |
| Save Image | Saves the grid content as an image. |
SQL Used Tool
SUB) Overview
The SQL Used Tool provides the search resul of V$SQLAREA under various search conditions.
- Work Path: Select Menu -> Tools -> SQL Used
The window configuration is as follows.
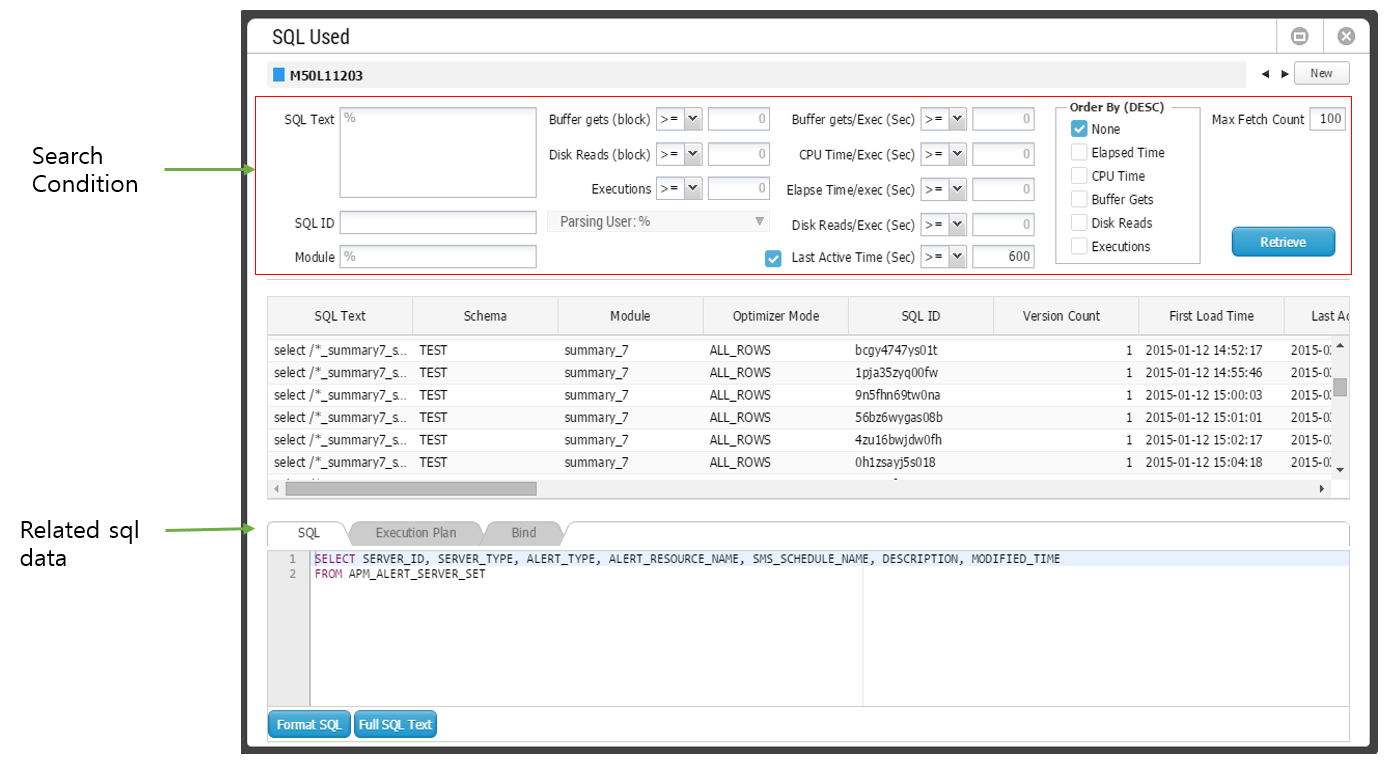
SUB) Search Condition
Various search conditions are available. The String Column is not case-sensitive and “%” is placed in front and at the end of the search condition and performs the Like search.
| Item | Description |
| SQL Text | Enter the search object SQL statement. |
| SQL ID | Enter the search object Oracle SQLID. |
| Module | Enter the search object Module Name. |
| Parsing User | Enter the search object Schema Name. |
| Buffer Gets (block) | Enter the search object Buffer Get number (Cumulative Value). |
| Disk Reads (block) | Enter the search object Disk Reads (Cumulative Value). |
| Executions | Enter the search object Executions number (Cumulative Value). |
| Buffer Gets/exec (block) | Enter the search object Buffer Get number (Average value per 1 execution). |
| CPU Time/exec (Sec) | Enter the search object CPU Time (Average value per 1 execution). |
| Elapsed Time/exec (Sec) | Enter the search object Elapsed Time (Average value per 1 execution). |
| Disk Reads/exec (block) | Enter the search object Disk Reads (Average value per 1 execution). |
| Last Active Time | Set the last most recently executed SQL as the search object.
|
| Order By (DESC) | Choose the sorting standard. |
| Max Fetch Count | Set the maximum number of items for fetching.
|
SUB) SQL Related Information
The SQL Related Information provides the SQL statement, execution plan, BIND information and etc.
| Item | Description |
| SQL Tab | Provides the SQL statement. |
| Execution Plan Tab | Provides the execution plan. |
| Bind Tab |
|
| Format Button | Formats the SQL statement. |
| Full SQL Text Button | A separate window will pop up and provide the SQL statement. |
SUB) Grid Column
For more information about the columns, please reference the Oracle document in the URL below.
Note. https://docs.oracle.com/cd/B28359_01/server.111/b28320/dynviews_3060.htm#REFRN30259
SUB) Grid Mouse Right Click Menu
The mouse right-click menu is as follows. For more information, please reference “Appendix. Grid Mouse Right-Click Menu UI”.
| Item | Description |
| Export Excel | Downloads the grid content on an excel file. |
| Copy(To Clipboard) | Makes a copy of the grid content. |
| Show/ Hide Columns | Selects the columns to be displayed on the grid. |
| Filter On | Enables the Filtering function. |
| Multiple Sort On | Sorts based on 2 or more column values. |
| Save Image | Saves the grid content as an image. |
SQL Detail Window
SUB) Overview
The SQL Detail Window provides the SQL statistics, execution plan, and BIND information. The initial screen will appear as follows.
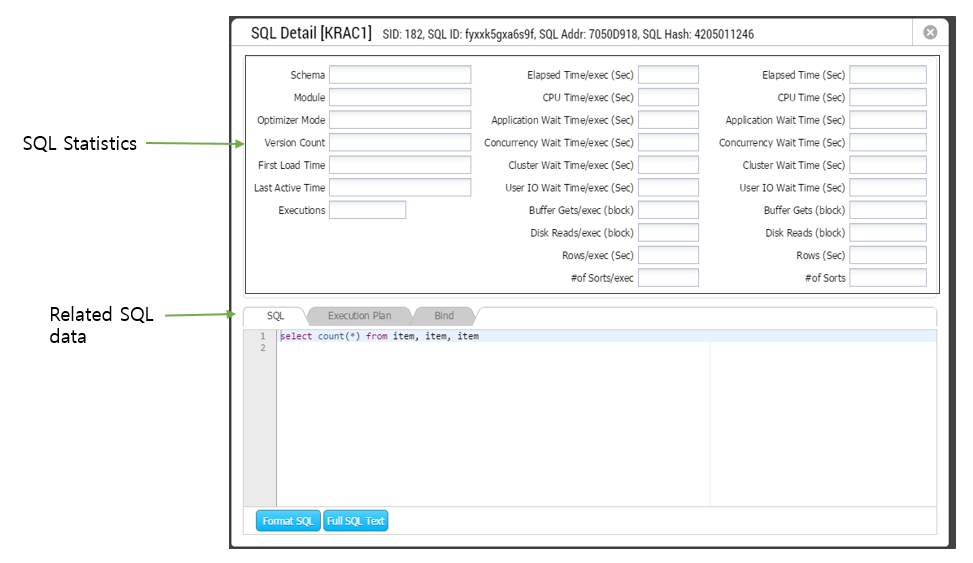
SUB) SQL Statistics
The SQL Statistics Area provides the corresponding SQL’s statistics retrieved from V$SQLAREA. For more information about the columns, please reference the Oracle document in the URL below.
Note. https://docs.oracle.com/cd/B28359_01/server.111/b28320/dynviews_3060.htm#REFRN30259
SUB) SQL Related Information
Please reference “Chapter 6 SQL Related Information” section.