2.Maxgauge Daemon & Client
MaxGauge Startup and Shutdown
MaxGauge For MySQL is by default driven by the Real-time Client.
MaxGauge Real-time Client Startup
SHELL> ./bin/all.start.sh
MaxGauge Real-time Client Shutdown
SHELL> ./bin/all.start.sh
Login
Open the Chrome browser and enter the IP’s WAS Port (ex.127.0.0.1:8170) which is currently in service.
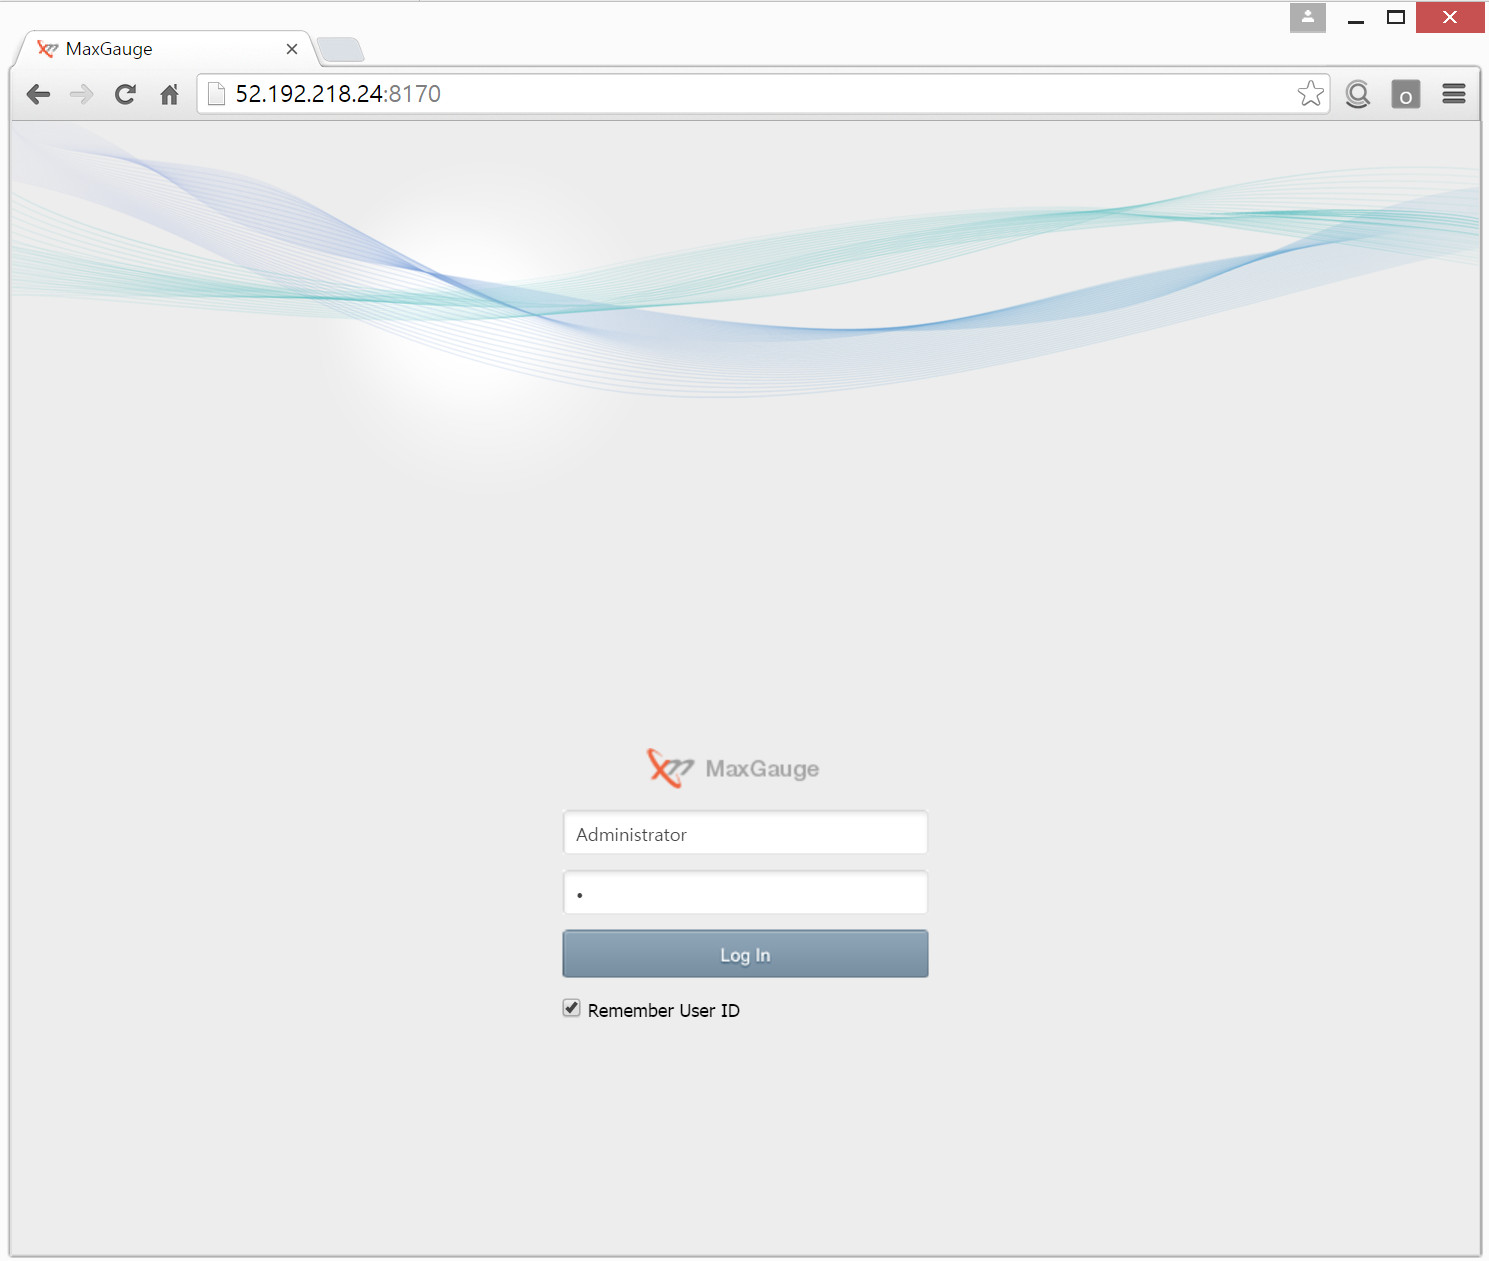
( Default Account : Administrator / Password : 1 )
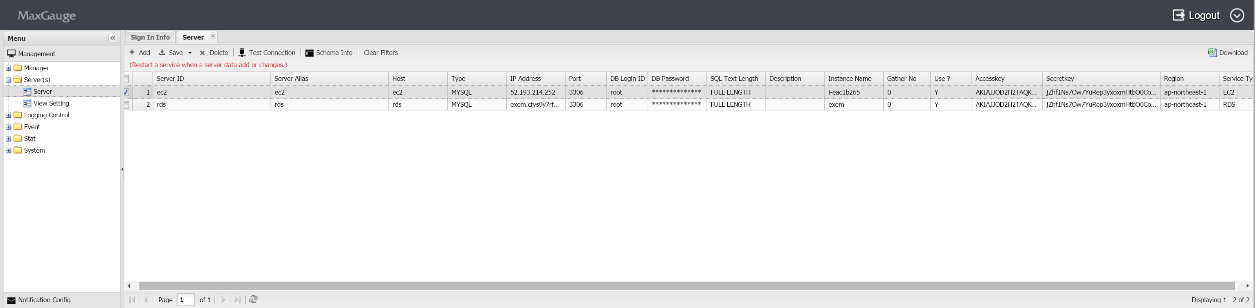
Monitoring Server Registration ( Admin > Server(s) > Server )
‘Server’ is a screen for registering and managing the connection information of the monitoring target database.
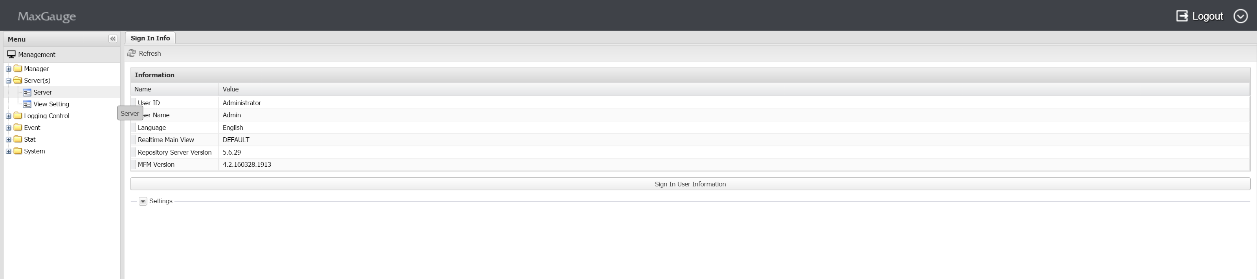
Administrator Menu Location
After login, reference the image below to go to the administrator screen.
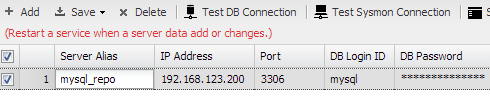
Connection Information Registration
To register the connection information, click the ‘Add’ button on the ‘server’ screen.
- Click
 button on the server window.
 - Input Connection information.
- After checking the items entered, click the Save button to save information.
| Item | Item | Description |
| MySQL Connection | Server Alias | Connection Name |
| IP Address | IP address of the server in which MySQL is operating. | |
| Port | Port used by MySQL. | |
| DB Login ID | User name used to connect to MySQL. | |
| DB Password | Database user’s password to connect to MySQL. | |
| CloudWatch
|
Accesskey | Key Accesskey to access the CloudWatch |
| Secretkey | Secretkey to access the CloudWatch | |
| Region | Location of server | |
| Service Type | Type of server | |
| Instance Name | Name of instance | |
| Gather No | In case of high volume logging, the process numbering for division, Default Value ‘0’. | |
| Description | Memo Input Window | |
| Use ? | Whether to use or not the log collection and real-time. |

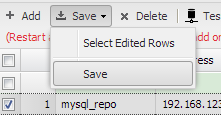
Edit Connection Information
To edit the connection information, click on the server you wish to edit on the ‘Server’ screen.
- Select the connection information you wish to edit and edit the information.
- When finished, click Save.
Delete Connection Information
To delete connection information, click the ‘Delete’ button on the ‘Server’ screen.
- After checking the connection information you wish to delete, click the
 button on the Instance Manager screen.
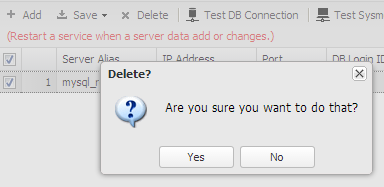
- Click ‘Yes’ button on the confirmation window.
Start Log Collection and Monitoring
Only ‘Y’ from the following items  will become active for log collection and monitoring.
From the EXEM Maxgauge for Mysql screen, when you click Process > All STOP , START to reflect the changed server information, you can check the collected data in Real-time and Performance Analyzer.
SHELL> ./bin/all.start.sh
Open Chrome browser and enter “52.192.218.24 “.
( Default Account : Administrator / Password : 1 )
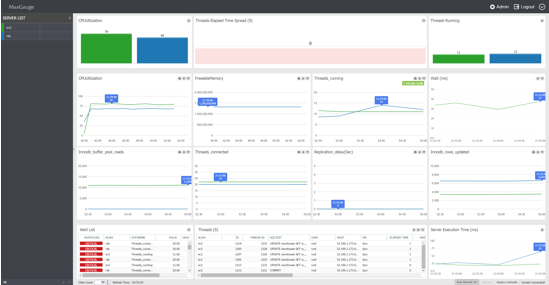
( Integrated Real-time )