8.MaxGauge Performance Analyzer
Performance Analyzer Overview
The Performance Analyzer replays the performance indicators, Active Sessions, SQL Text and CPU indicator, and Top Processes saved to the repository by gather exactly the same as in real-time to analyze the performance and to identify the root cause of the problem in MySQL database.
Performance Analyzer is generally used most frequently for the following situations.
- To analyze performance issues throughout the overall system
- To analyze Peak Times of specific dates, problem sessions, and to trace SQLs.
- To analyze system resource usage type and trends analysis
Performance Analyzer Home Screen
Select Log
Repository is used as the supporting logging type for Maxgauge For MySQL. For the corresponding log, innodb engine and partitions are used and it is a database creating structure.
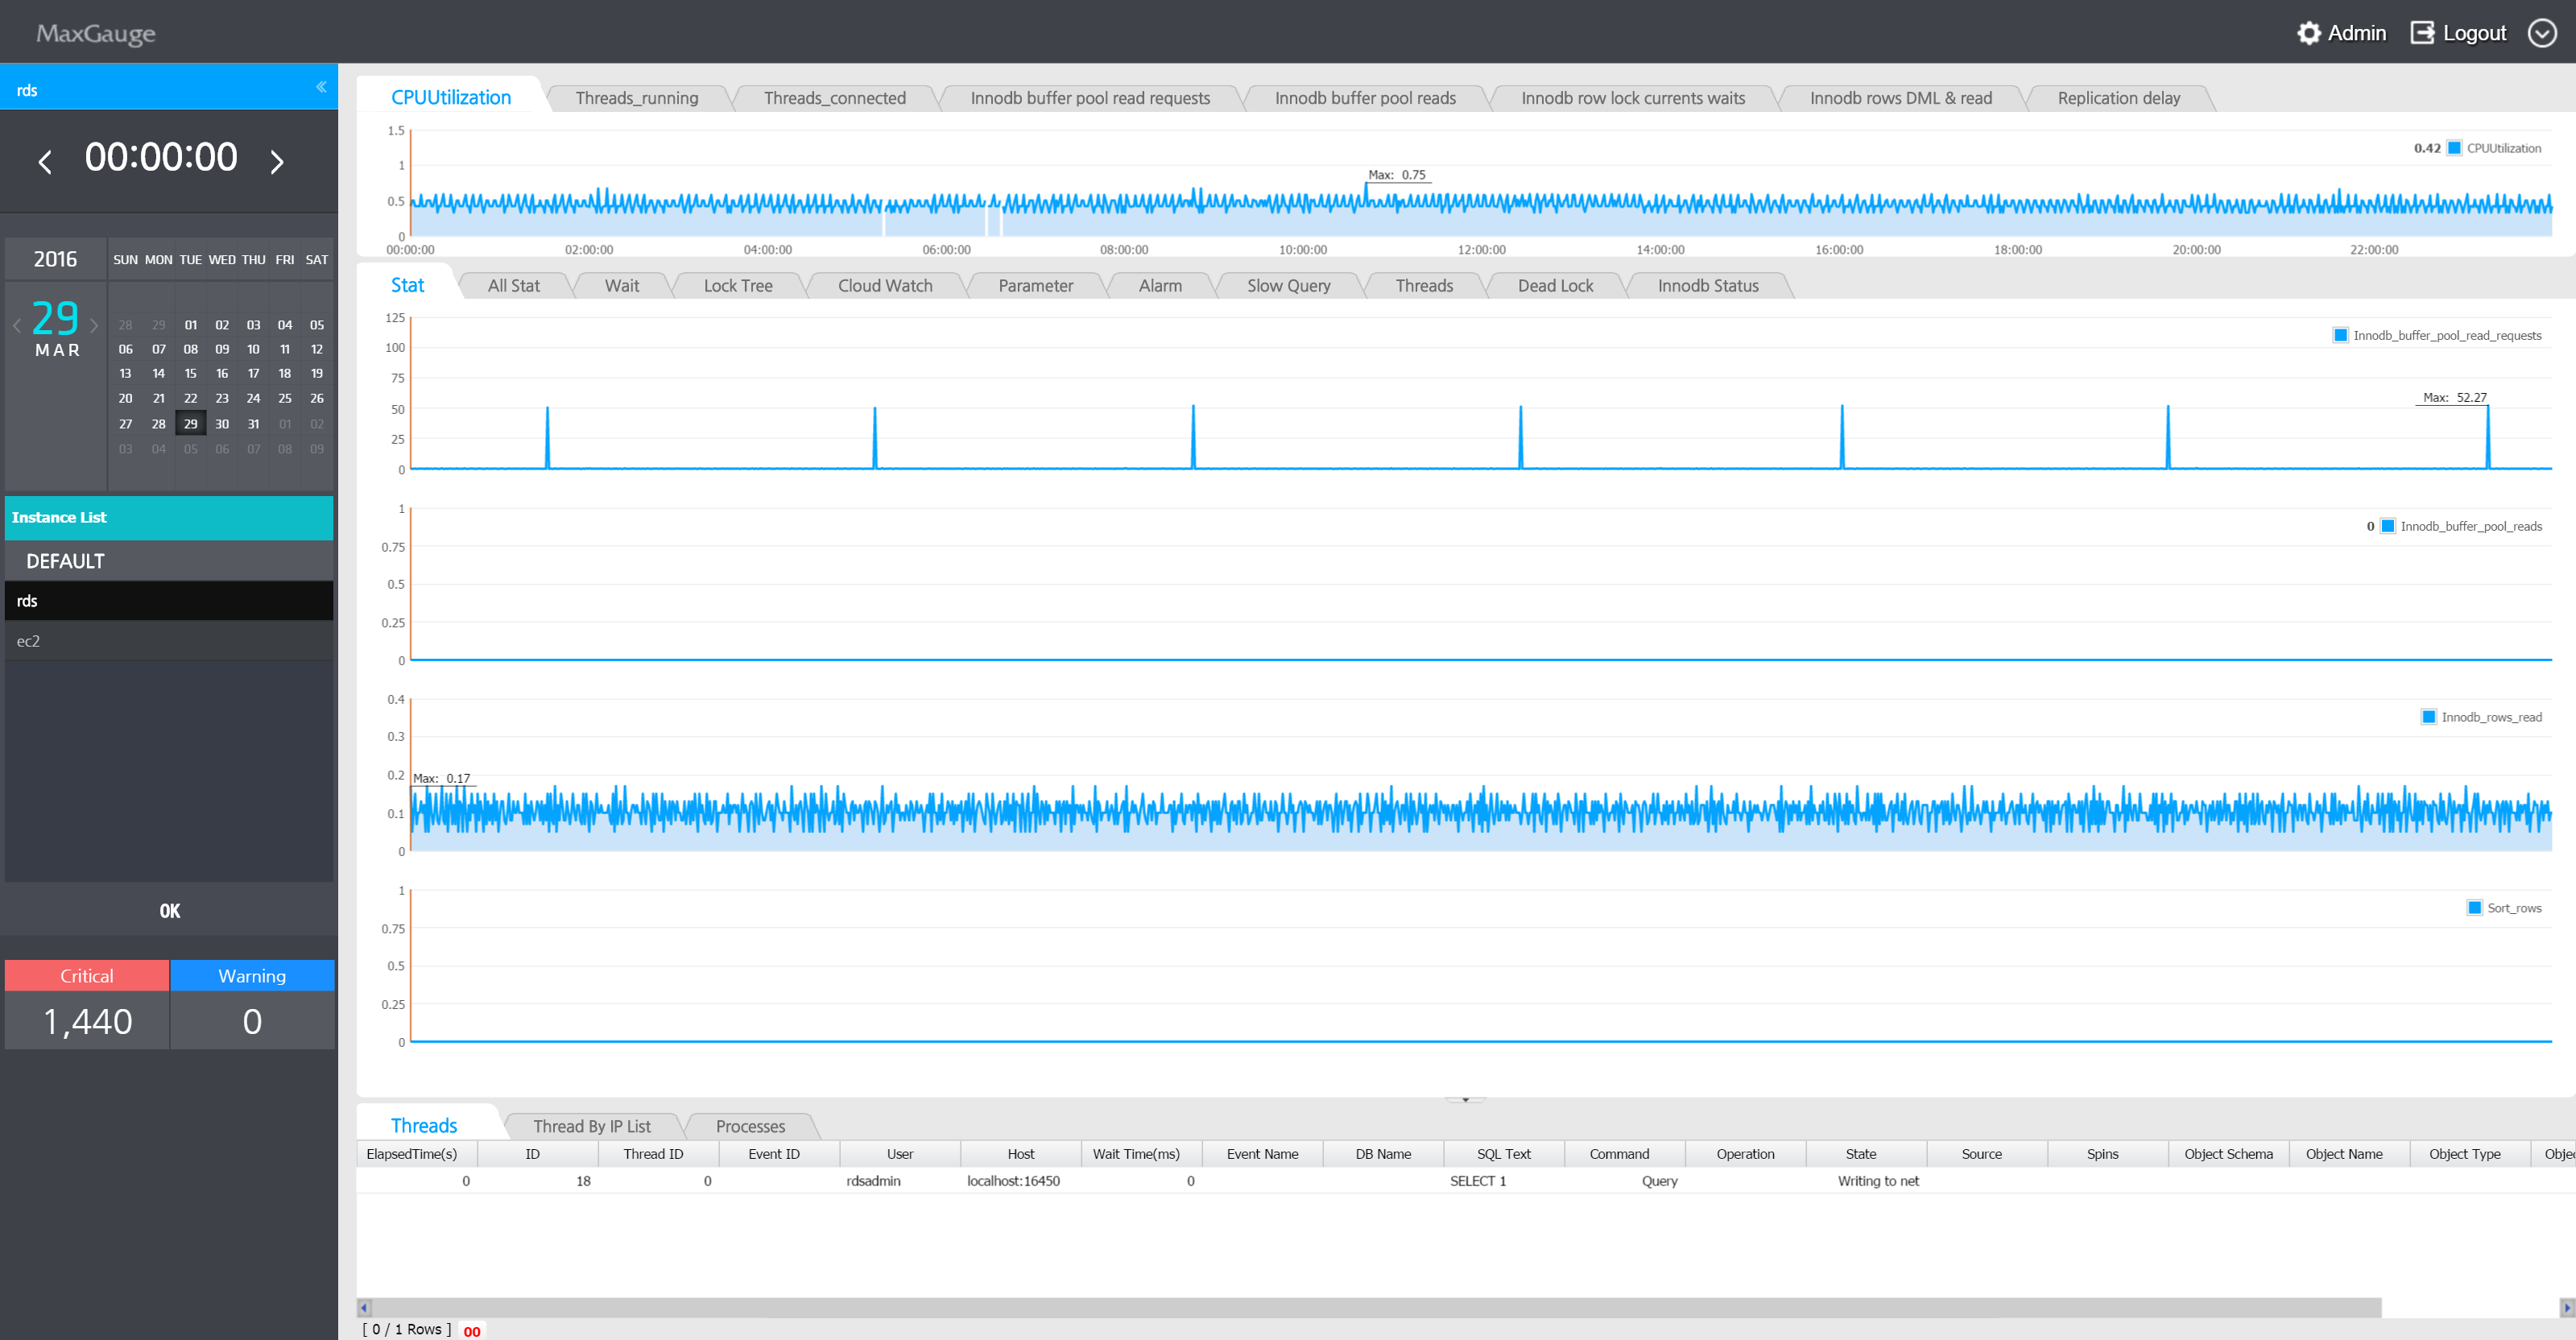
Performance Analyzer Screen Overview
The Performance Analyzer displays MySQL database’ daily execution status. All indicators are displayed in a 24 hour trends graph, and you can easily identify the Peak Time and navigate to the time you wish to analyze with just a mouse click. MySQL performance indicator, Session information, SQL Text and O/S process information are organically connected which allows you to accurately analyze the Peak Times and the times at which errors occurred.
| Location | Item | Description |
| |
Searching Time | Provides current time and the target time |
 |
Thread Information | Check Active Sessions and O/S Process of the selected time |
 |
Main Indicators Area | Displays the main performance indicators graph. The user can change the indicator for the graph in indicator details area, however, the user cannot change the indicators for the graph in the main indicators area. |
 |
Indicator Details Area | The details window consists of several tabs for each item such as performance indicators, wait indicators and others. For the description of each item, reference the corresponding section below. |
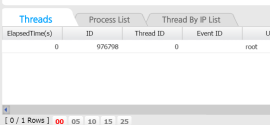
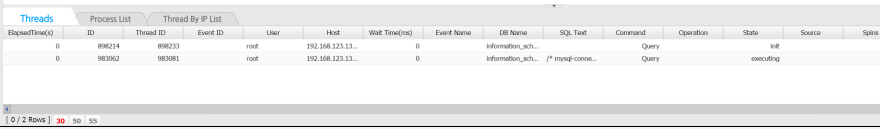
Thread and Process List Window
By looking at the trends of performance indicators displayed on the screen, you can know the type of resource usage during the collection period and the peak time of database system usage, and from the Session & Process window, since you can sort the values by clicking on the column header of each indicator, you can easily identify which sessions have used up the most resources. In general, excessive usage of resource calls for special attention and you can check the SQL text of such sessions to take appropriate actions to resolve the problem.
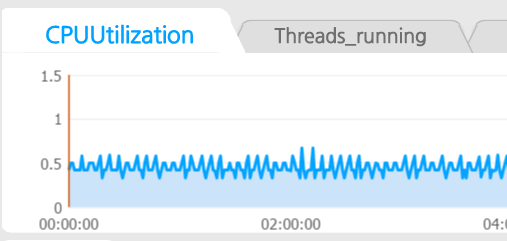
Main Indicators Area
The Main Indicators Area displays O/S CPU , Active Sessions and other important performance indicators provided by MySQL.

| Item | Description |
| CPUUtilization | OS CPU Usage Rate(%) |
| Threads Running | Active Sessions |
| Threads Connected | Total Sessions |
| Inndb buffer pool read requests | Number of blocks read from the Buffer Pool (memory I/O) |
| Innodb buffer pool reads | Number of blocks read from the Disk (Disk I/O) |
| Innodb row lock currents waits | Number of sessions waiting on the Lock |
| Innodb rows DML & Read | Innodb rows deleted: Number of records deleted.
Innodb rows updated: Number of records updated. Innodb rows inserted: Number of records inserted. Innodb rows read: Number of records read. |
| Replication delay | Replication Environment Master – Replication delays between Slaves (Unit: sec) |