Case1. Analyzing Performance Degradation Caused by Changes in Execution Plan
Like the recent, it is a clear fact that the CBO (Cost Based Optimizer) is a more suitable optimizer in an environment where a large amount of data is accessed under various conditions by many users. However, one of the problems of CBO is that the execution plan could change unexpectedly. Of course, there are times where you can benefit from the execution plan changes, however, the opposite always exists as well. For problems such as these, the SPM (SQL Plan Management) is available starting from the Oracle 11g, which provides a method for actively managing the execution plan. However, performance degradation caused by execution plan changes still remain as one of the problems the DBAs have to deal with frequently. Therefore, in this case study, we would like to introduce a method through which you can diagnose and analyze performance issues caused by execution plan changes.
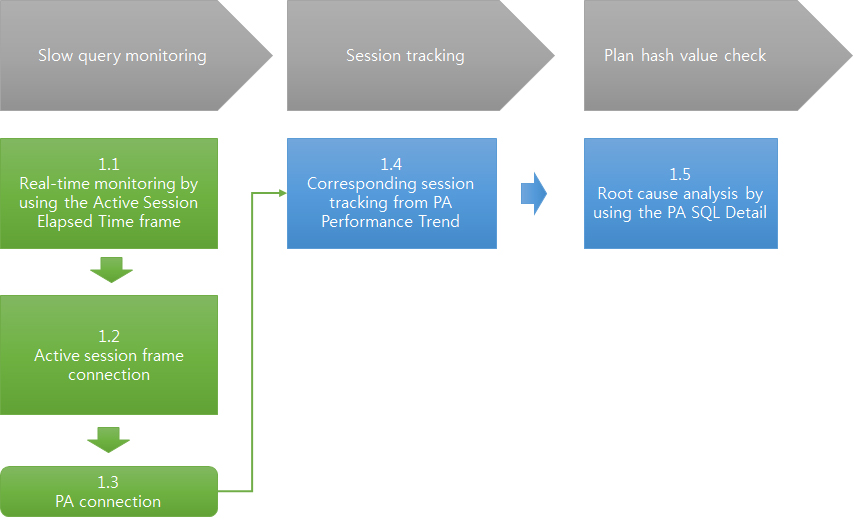
The order of investigating the performance degradation due to execution plan changes by using MaxGauge is as follows. After monitoring the realtime SQL response time according to each session, analyze the problem session’s activity details using the Performance Analyzer.
Image1. The Investigation Flow of Performance Degradation Caused by Execution Plan Changes
Step 1.1 Real-time Monitoring by using the Active Session Elapsed Time Frame
Check the SQL elapsed time of the active session currently in progress by using the Active Sessions Elapsed Time Frame, which is one of MaxGauge’s real-time monitoring functions.
Image2. Active Sessions Elapsed Time Frame
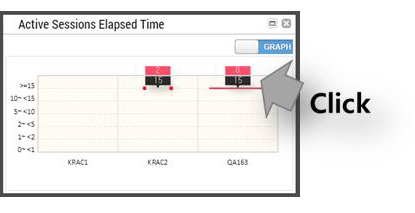
(!) Check Results: You can know the SQL elapsed time is [149] seconds.
Step 1.2 Active Sessions Frame Connection
Check the corresponding session’s detailed information (Program name, SID, SQLID, SQL, etc.) through the Active Session Frame.
Image3. Active Sessions Frame
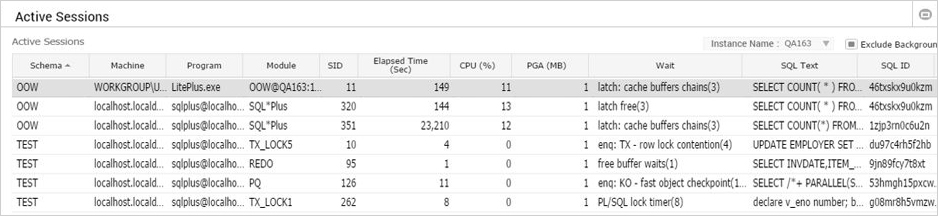
(!) Check Results: The program name which currently executed the slow SQL is [LitePlus.exe], SID is [11], and SQLID is [46txskx9u0kzm]. Because the program had no performance issues due to a slow query until recently, you need to connect with the Performance Analyzer to compare and analyze the recent execution history and the current execution status.
Step 1.3 PA Connection
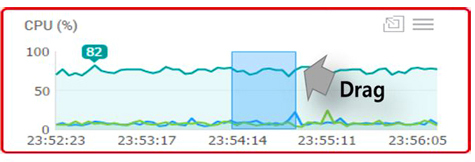
For one-stop performance analysis, MaxGauge connects with the Performance Analyzer screen through the method of dragging the Trend Chart Frame area.
Image4. PA connection through Trend Chart Frame Drag
Step 1.4 Session Tracking from PA Performance Trend
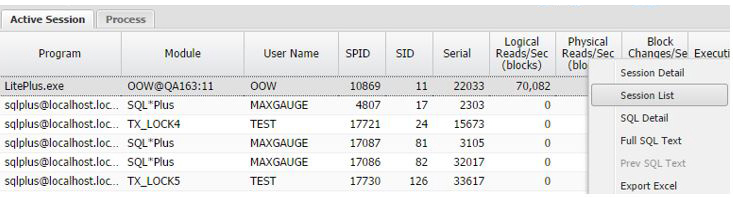
Investigate the problem session by using the “Session List” function from the Active Sessions Tab located at the bottom of the Performance Trend.
Image 5. Session List Connection
MaxGauge’s “Session List” provides a function through which you can investigate a session’s activities by each second.
Image 6. Session List
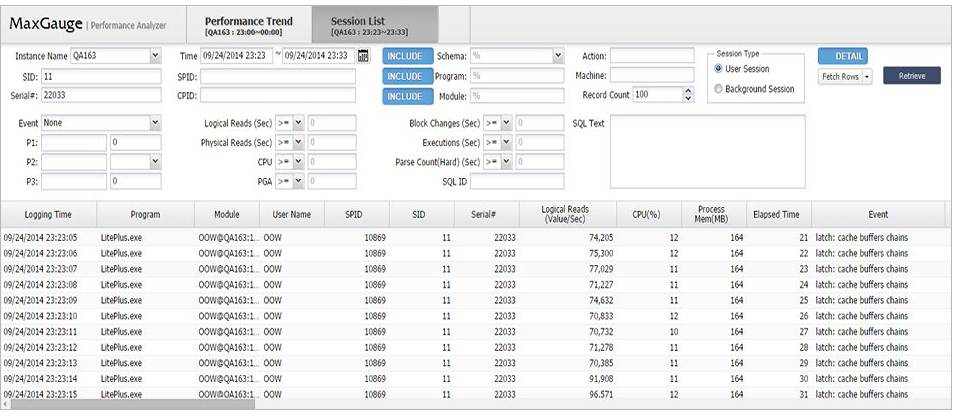
(!) Check Results: The corresponding session has been executing the problem SQL since [ 23 hour 18 minute 26 seconds ], and the SQL elapsed time until now is [165] seconds.
Step 1.5 Problem Analysis by using the PA SQL Details
The problem SQL has been executed within a normal range until recently. Therefore, you need to analyze the performance degradation by comparing the recent activity details with the current activity status. In order to do this, connect from “Session Detail” to the “SQL Detail” screen.
Image 7. SQL Detail Connection

Image 8. SQL Detail

(!)Check Results: The corresponding Query’s SQL elapsed time and IO amount has increased since[23 hour 20 minute], and you can know that the execution plan has changed since the corresponding time (SQL Plan Hash hage).
The cause of performance degradation due to execution plan changes is generated mostly because of insppropriate statistics information. This case study is not an exception. It is because the statistics information creation location within the batch job has been moved to an inappropriate location by the developer’s error.
● AS WAS: Truncate -> Data Loading -> Statistics Information Creation
● AS IS: Truncate -> Statistics Information Creation -> Data Loading
As a result, the corresponding table is recognized as ‘0’ result and has changed to an ineffective execution plan. After the 1st treatment through SQL Tuning, the corresponding problem has been resolved with recovering the batch job’s process. In this way, MaxGauge provides a function which closely analyzes the issues detected by real-time monitoring, through the process called performance analysis. Furthermore, by providing another special tool called the Lite Plus, desined exclusively for SQL Tuning, it has increased the efficiency in the task of SQL Tuning.