Case3. How to Eliminate Potential Risk Factors through the Analysis of Pro-active Lock Issues
The Oracle ensures data consistency through the lock mechanism. This is very essential in terms of transaction protection. However, when multiple users are trying to change the same data, there is a high chance of generating a lock wait phenomenon. Therefore, in order to minimize the lock wait time, you must reduce the transaction process time as much as possible. In general, a transaction has the BEGIN-> DML -> {SELECT} -> COMMIT -> END pattern. And hence, the more the performance of the SQL statements processed before the COMMIT is delayed, the longer the transaction time will be, and as a result, the lock wait time will increase. For example, if the {SELECT} statement which is usually executed in 1 second is taking 10 seconds due to data increase and etc., then the corresponding transaction’s execution time has increased 9 seconds, and it will hold the row level lock of the corresponding record that much longer. (In other words, there is a high possibility for lock wait phenomenon.) Therefore, it is important to recognize the potential risk factors in advance and to eliminate the risk factors through tuning. But most database performance management products (Oracle EM included) in general do not provide logging data of Lock wait phenomenon by each second. As a result, the only possible tuning method is the re-active method of tuning which begins the analysis on lock issues only after the lock problem has already become serious. However, MaxGauge provides a pro-active tuning method which allows you to take measures before the problem gets serious by logging the Lock wait phenomenon for each second (supports RAC environment). We will discuss further on this topic in this case study.
The order of investigating the cause of lock wait phenomenon by using MaxGauge is as follows.
Image 1. The Flow of Investigating the Lock Wait Phenomenon Issues 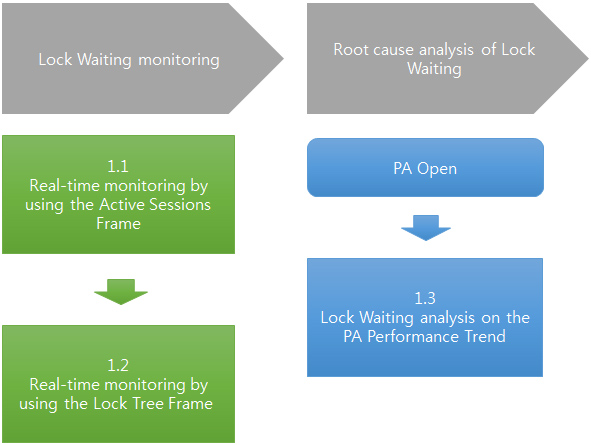
Step 1.1 Real-Time Monitoring by using the Active Sessions Frame
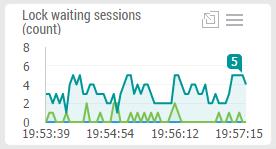
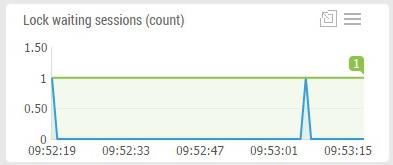
In order to monitor the Lock wait sessions, use the “lock waiting sessions” performance indicators in the Trend Chart Frame. MaxGague provides its own “lock waiting sessions” performance indicators for an effective monitoring of Lock wait sessions, and this refers to the “current number of lock wait sessions” (This performance indicator is not available in the Oracle).
Module Name Setting Method SQL> exec DBMS_APPLICATION_INFO.SET_MODULE('BATCH_CASE3','');
Image 2. Monitoring Lock waiting sessions
Step 1.2 Real-Time Monitoring by using the Lock Tree Frame
Connect to lock tree frame to analyze the lock wait session details. The Lock tree frame displays the relationship between the lock holder and the waiter in a tree structure which allows you to intuitively recognize the lock wait relationships.
Image3. Lock Tree Frame
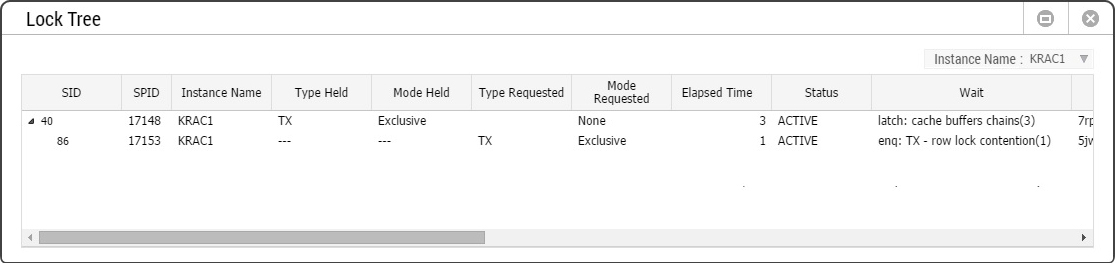 (!) Check Results: Based on the monitoring results, the Lock holder has repeated a pattern of holding the lock and releasing in a short amount of time. In other words, it seems like multiple processes are processing the same transaction (short process time) instead of one transaction occupying the lock for a long time. In order to analyze such type of problems in details, it is more effective to use the Performance Analyzer.
Step 1.3 Lock Waiting Analysis in PA Performance Trend
1.3.1 Check the Lock Waiting Sessions Performance Indicators Trend
Check the Lock Waiting Session’s trend generated today.

1.3.2 Lock Holder Session Tracking
Track the corresponding sessions by using the Session List function for the Lock Holder Session Analysis.
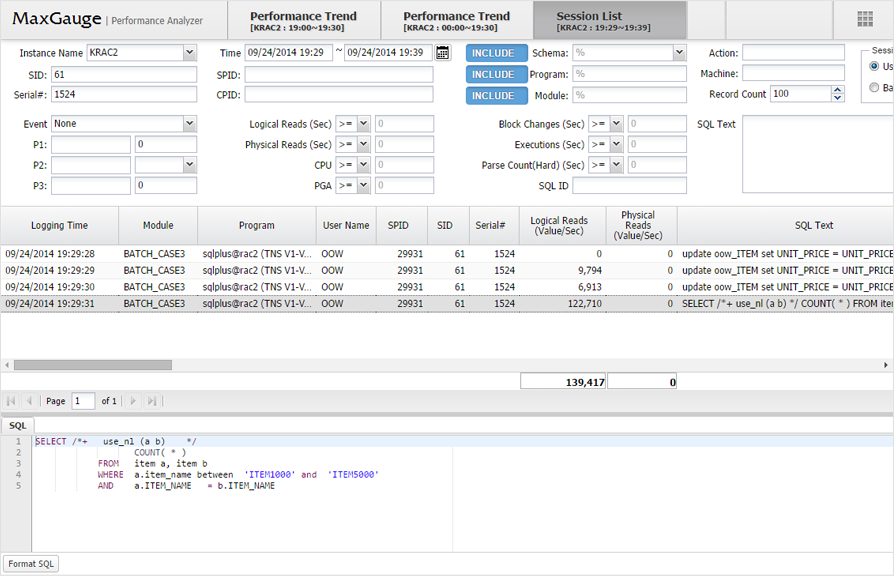
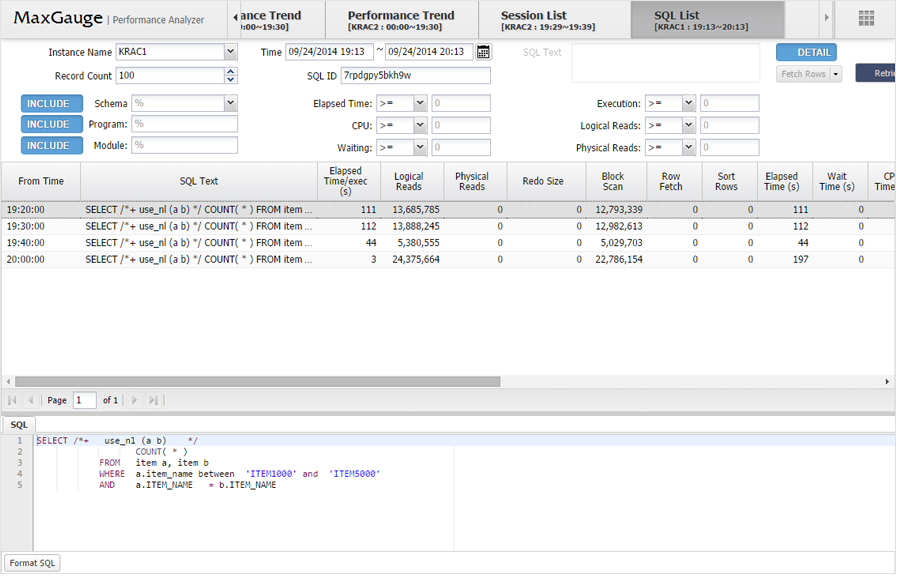
1.3.3 Analysis of SQL details within the Transaction
Use the SQL List function in order to closely analyze the SQLs being executed within the transaction.
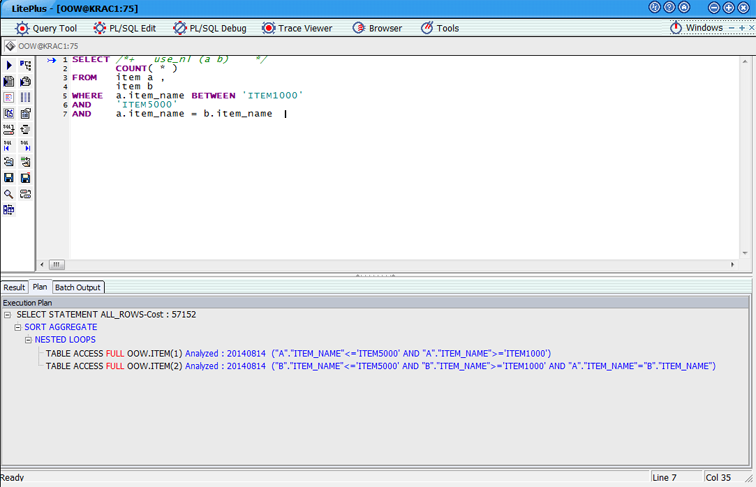
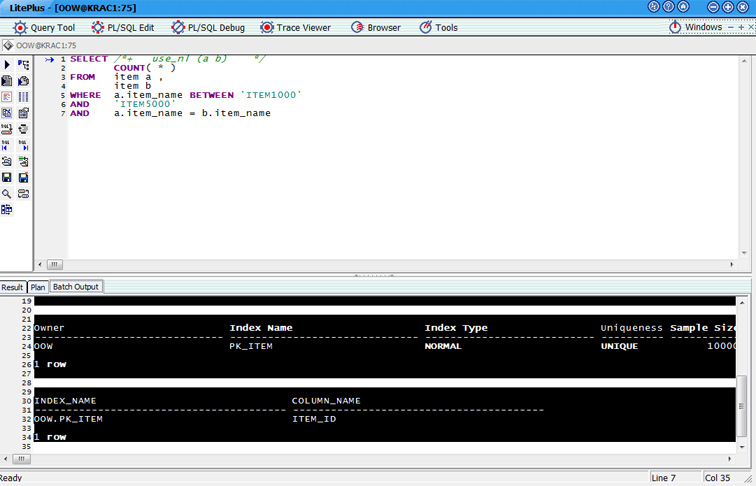
1.3.4 Check for Potential Risk Factors
Unintended Full Scan operations is a problem for the present, and it may further lead to bigger problems due to increase in data. Therefore, you must identify what is causing the full scans.
1.3.5 System Monitoring After Transaction Performance Tuning
After tuning the transaction performance through index generation, monitor the “lock waiting sessions” performance indicator trend.
(!) Check Results: You can see that BATCH_CASE3 transaction’s performance has noticeably improved and the lock waiting sessions have also noticeably decreased as well.
Except for stock or banking systems whose systems must ensure very fast performance such as stock or banking business, short lock whose waiting time is 1~3 seconds may not be considered as a serious problem. However, the lock waiting phenomenon generated within a short time period may possibly bring about very serious issues after a certain amount of time. Therefore, it is necessary to regularly check for such lock waiting phenomenon’s risk factors, and to do this, like MaxGauge, provide an environment in which you will be able to analyze after logging the lock waiting session details by each second.